Using Cost-Effective Surveys From Platforms of Opportunity to Assess Cetacean Occurrence Patterns for Marine Park Management in the Heart of the Coral Triangle
 Achmad Sahri
 Putu Liza Kusuma Mustika
 Purwanto Purwanto
 Albertinka J. Murk
 Meike Scheidat
- 1Marine Animal Ecology Group, Wageningen University and Research, Wageningen, Netherlands
- 2Cetacean Sirenian Indonesia (CETASI), Jakarta, Indonesia
- 3College of Business, Law and Governance, James Cook University, Townsville, QLD, Australia
- 4The Nature Conservancy (TNC) Indonesia, Jakarta, Indonesia
- 5Coral Triangle Center (CTC), Bali, Indonesia
- 6Wageningen Marine Research, Wageningen University and Research, Ijmuiden, Netherlands
For Marine Protected Areas (MPAs) to be effective in conservation their zoning and management needs to be based on scientific data. Obtaining information on spatio-temporal occurrence patterns of cetaceans can be especially challenging. This study used platforms of opportunity (i.e., fishing monitoring vessels) from May 2004 to May 2012 as a cost-effective way to address this knowledge gap in the Wakatobi National Park (WNP) at the heart of Coral Triangle, an important area for cetaceans in Indonesia. A database was created of cetacean sightings per surveyed days at sea, allowing for an analysis of species diversity and habitat use around the islands. Of the 11 cetacean species identified, spinner and bottlenose dolphins were sighted most often, followed by melon-headed and sperm whales. Spinner dolphin showed a wide distribution in the area, whilst bottlenose dolphin and melon-headed whale occupied the waters between the main islands and south atolls. Sperm whales occurred mostly in waters north of the main islands and as melon-headed whales, mostly in deep waters. Most cetacean sightings occurred in the zones designated for human use, indicating where potential conflicts might occur. No sightings were found in the Park core zone, suggesting a mismatch between WNP design and the cetacean ecological needs. Based on a sub-sample of the dedicated fishing monitoring sightings a sighting frequency was derived. Small and large cetaceans were reported mostly during inter-monsoonal seasons, possibly related to increased prey availability due to seasonal upwelling and increased survey activity. Inter-annual occurrence of cetaceans was variable, with no large cetaceans being sighted in 2010–2012, likely due to reduced survey efforts. In areas with limited resources for designated surveys, the use of platforms of opportunity can be a cost-effective tool to provide valuable data on cetacean occurrence. While data collection protocols in the WNP can be improved further, the results presented here already help identify potentially important areas as well as highlight where to direct designated research efforts. We advise to protect currently unprotected cetacean important habitats, and strictly regulate human activities in the current use zones for future WNP rezoning processes.
Introduction
Identification of areas of particular importance for a species is a key aspect in conservation and management of wildlife. This notion requires the acquisition of baseline information on species distribution and dynamics. Within management areas such as national parks, this data are a crucial input for designing effective spatial planning, to evaluate park zoning systems and to prioritize measures for protecting the species from adverse human impact. Obtaining this information can be particularly challenging for cetaceans. Many species migrate over long distances from their reproductive to their feeding grounds (Block et al., 2011; Irvine et al., 2014). Others stay in smaller areas but move between offshore and inshore waters following prey (Benoit-Bird and Au, 2003; Ponnampalam, 2012). While some species can be observed and identified easily due to their surface behavior, others are highly elusive and very difficult to record (Nowacek et al., 2016; Horton et al., 2017). Different methods can be applied to investigate how cetaceans use their habitat and their applicability depends mainly on the research objective and resource availability (Evans and Hammond, 2004).
To cover large-scale areas the most commonly used approach is dedicated aerial or ship-board surveys that follow a design of transects giving each sampling point in the study area an equal probability of being sampled (e.g., line transect distance sampling, Buckland et al., 2001; Evans and Hammond, 2004; Hammond et al., 2013). Conducting such an unbiased and elaborate survey generally involves dedicated vessels and observer teams and thus can be prohibitively costly (Redfern et al., 2006; Williams et al., 2006). An alternative in the case of limited resources (mostly funding constraints) is placing observers on vessels that serve as platforms of opportunity (Williams et al., 2006; Kiszka et al., 2007b; MacLeod et al., 2009). This is a low-cost method because generally no funding is needed for charter or fuel costs. Observers need to be trained for the work, but they can also consist of volunteers reducing running costs even further.
Platforms of opportunity can cover a specific route, such as for example ferries traveling regularly between harbors or cruise vessels following a set itinerary (Williams et al., 2006; MacLeod et al., 2009). The advantage of this type of platform is that it provides samples of the same area repeatedly allowing a monitoring of cetacean occurrence over time. The disadvantage is that they are limited to a few number of transects that might not be representative of a particular study area. Where the ferry routes cross for example national parks the results can be used to inform management (Pennino et al., 2017). Other platforms of opportunity are less confined in their coverage, such as cetacean watching vessels (Vinding et al., 2015). Depending on the target species and limited by the range of the vessel, they cover a particular area with the aim to find cetaceans. This allows for a wider spatial coverage, but it also has the caveat that areas of assumed low density will get less coverage. Whale-watching vessels can stop long enough during an encounter to allow the collection of detailed information on group size, behavior and the presence of calves (Vinding et al., 2015; Alves et al., 2018). Photographs can be taken of animals and used in large-scale databases to identify migratory routes and local occupancy of individual whales (Currie et al., 2018b). Assuming these vessels cover similar areas and the observer effort is also comparable over time, this data can provide an index of occurrence (e.g., sighting frequency) and inform on species diversity and behavior. When collected over a long-term they are a valuable source of information on temporal and spatial changes in cetacean occurrence (Arcangeli et al., 2013; Silva et al., 2014).
Indonesia has a high diversity of cetacean species (Mustika et al., 2015b), and was a popular whaling ground for large whales during the Yankee whaling era from the 18th to early 20th century (Townsend, 1935). The deeper eastern waters of this country are also an important migration route for cetaceans, including large whales (Double et al., 2014). Studies of cetacean species particularly around tropical oceanic islands are limited (Baird et al., 2009), including in Indonesia. These oceanic island cetacean populations likely have specific conservation needs, but these populations are not systematically monitored, particularly in remote areas (Ender et al., 2014) in waters with complex reef and small islands. Some information about cetaceans in Indonesia is available hidden in unpublished internal reports. Insufficient information on spatial ecology of cetaceans impairs effective conservation strategies in this country.
Wakatobi at the heart of Coral Triangle region and part of the Banda Sea ecoregion is the second Indonesian national priority for area conservation (Huffard et al., 2012). Wakatobi is characterized by complex reefs and small-islands with a diverse submerged topography comprising a continental shelf, slopes, and pelagic waters with trough-, ridge- and seamount-like features. These characteristics are known to influence ocean circulation, induce nutrient upwelling and provide a diversity of water masses resulting in a rich habitat complexity, high biodiversity and great abundance for many species including cetaceans (Bartholomew et al., 2000; De Vos et al., 2012). The unique configuration of near-shore yet deep-sea habitat of Wakatobi is of special importance to deep-sea cetacean species, making the area one of the most important marine systems in Indonesia. Wakatobi waters were therefore designated as a marine park in 1996 (WNP Authority, 2008). The near-shore deep-sea cetacean habitats in Wakatobi provides a unique opportunity to survey deep-water cetacean species that normally occur in waters further offshore, which would otherwise be too challenging to monitor with small boats [e.g., in Malaysian waters (Ponnampalam, 2012)]. However, there is significant fisheries activity (Pet-Soede and Erdmann, 2003) and the effectiveness of the marine park as a conservation tool for cetaceans is not known.
Unfortunately, as in other regions of Indonesia, data availability on the status of cetaceans in this regionally important habitat (Huffard et al., 2012) is very limited, posing big challenges for cetacean conservation and management. Neither cetacean diversity nor the spatio-temporal occurrence of the different species is known for Wakatobi waters. In addition, the habitat preferences of the cetaceans in this area in terms of seafloor topography such as reef habitat types and depth have not yet been described in detail. This lack of information hampers informed conservation efforts within the area. To address this issue, a cetacean monitoring program was initiated in the Wakatobi National Park (WNP) and adjacent waters in 2004 and cetacean sightings were documented until 2012. The program aimed to assess cetacean species diversity, reveal spatio-temporal occurrence patterns and their habitat type preferences. The initiative for gathering such information was required by the WNP Management Plan document (WNP Authority, 2008).
Cetaceans can in different ways susceptible to anthropogenic threats. The threat of adverse human impact especially occurs from spatial and ecological overlap with human activities (Williams et al., 2006). Important human disturbances include direct (bycatch) and indirect (prey depletion) impacts from fisheries (Reeves et al., 2013), as well as physical and acoustic disturbance mainly by marine traffic (Pennino et al., 2017; Erbe et al., 2019), seismic activities from oil and gas exploration and naval sonars (Rosenbaum and Collins, 2006; Henderson et al., 2014), and various sources of pollution (Tanabe, 2002; Allen et al., 2011; Venn-Watson et al., 2015). Increasing anthropogenic stressors include coastal-offshore development and energy production, resource extraction, tourism, and climate change (MacLeod, 2009; Passadore et al., 2018b). To assess the potential impact from these human threats, baseline information on cetacean occurrence at a local level is urgently needed.
Our objective was to develop an approach to use platforms of opportunity as well as incidental data from long-term visual monitoring to add knowledge of unstudied cetaceans populating oceanic island-based habitats of Wakatobi. This approach provided information on the diversity, spatio-temporal occurrence patterns, and relative abundance of cetaceans in the area of interest. By comparing the spatio-temporal occurrence patterns with bathymetric characteristics and reef habitat types, we also revealed habitat preferences of these cetaceans. Finally, we discussed the advantages and caveats of using non-systematically collected data, and the implications of our approach and findings for effective cetacean conservation, spatial planning and marine park management.
Materials and Methods
Study Area
The study area encompasses WNP and adjacent waters, centrally located within the Coral Triangle region, a region with exceptional marine biodiversity (Green and Mous, 2008). The park includes a remote island group, approximately 120 km off the southeast Sulawesi mainland (Figure 1). The area is one of the largest marine parks in Indonesia and covers approximately 13,900 km2, containing all the major reef types. WNP includes four major islands with the boundaries are congruent with those of the Wakatobi district government (WNP Authority, 2008). The area has a diverse and complex submerged topography with channels between major landmasses that serve as passages for migrating mammals (Pet-Soede and Erdmann, 2003). The area has a relatively narrow continental shelf and the depth increases very rapidly from the shelf edge at around 150 m from the shorelines. The oceanographic conditions are influenced mainly by circulating and seasonally changing currents in the Flores and Banda Seas and result in productive and relatively cool waters as a consequence of upwelling from the south (Pet-Soede and Erdmann, 2003).
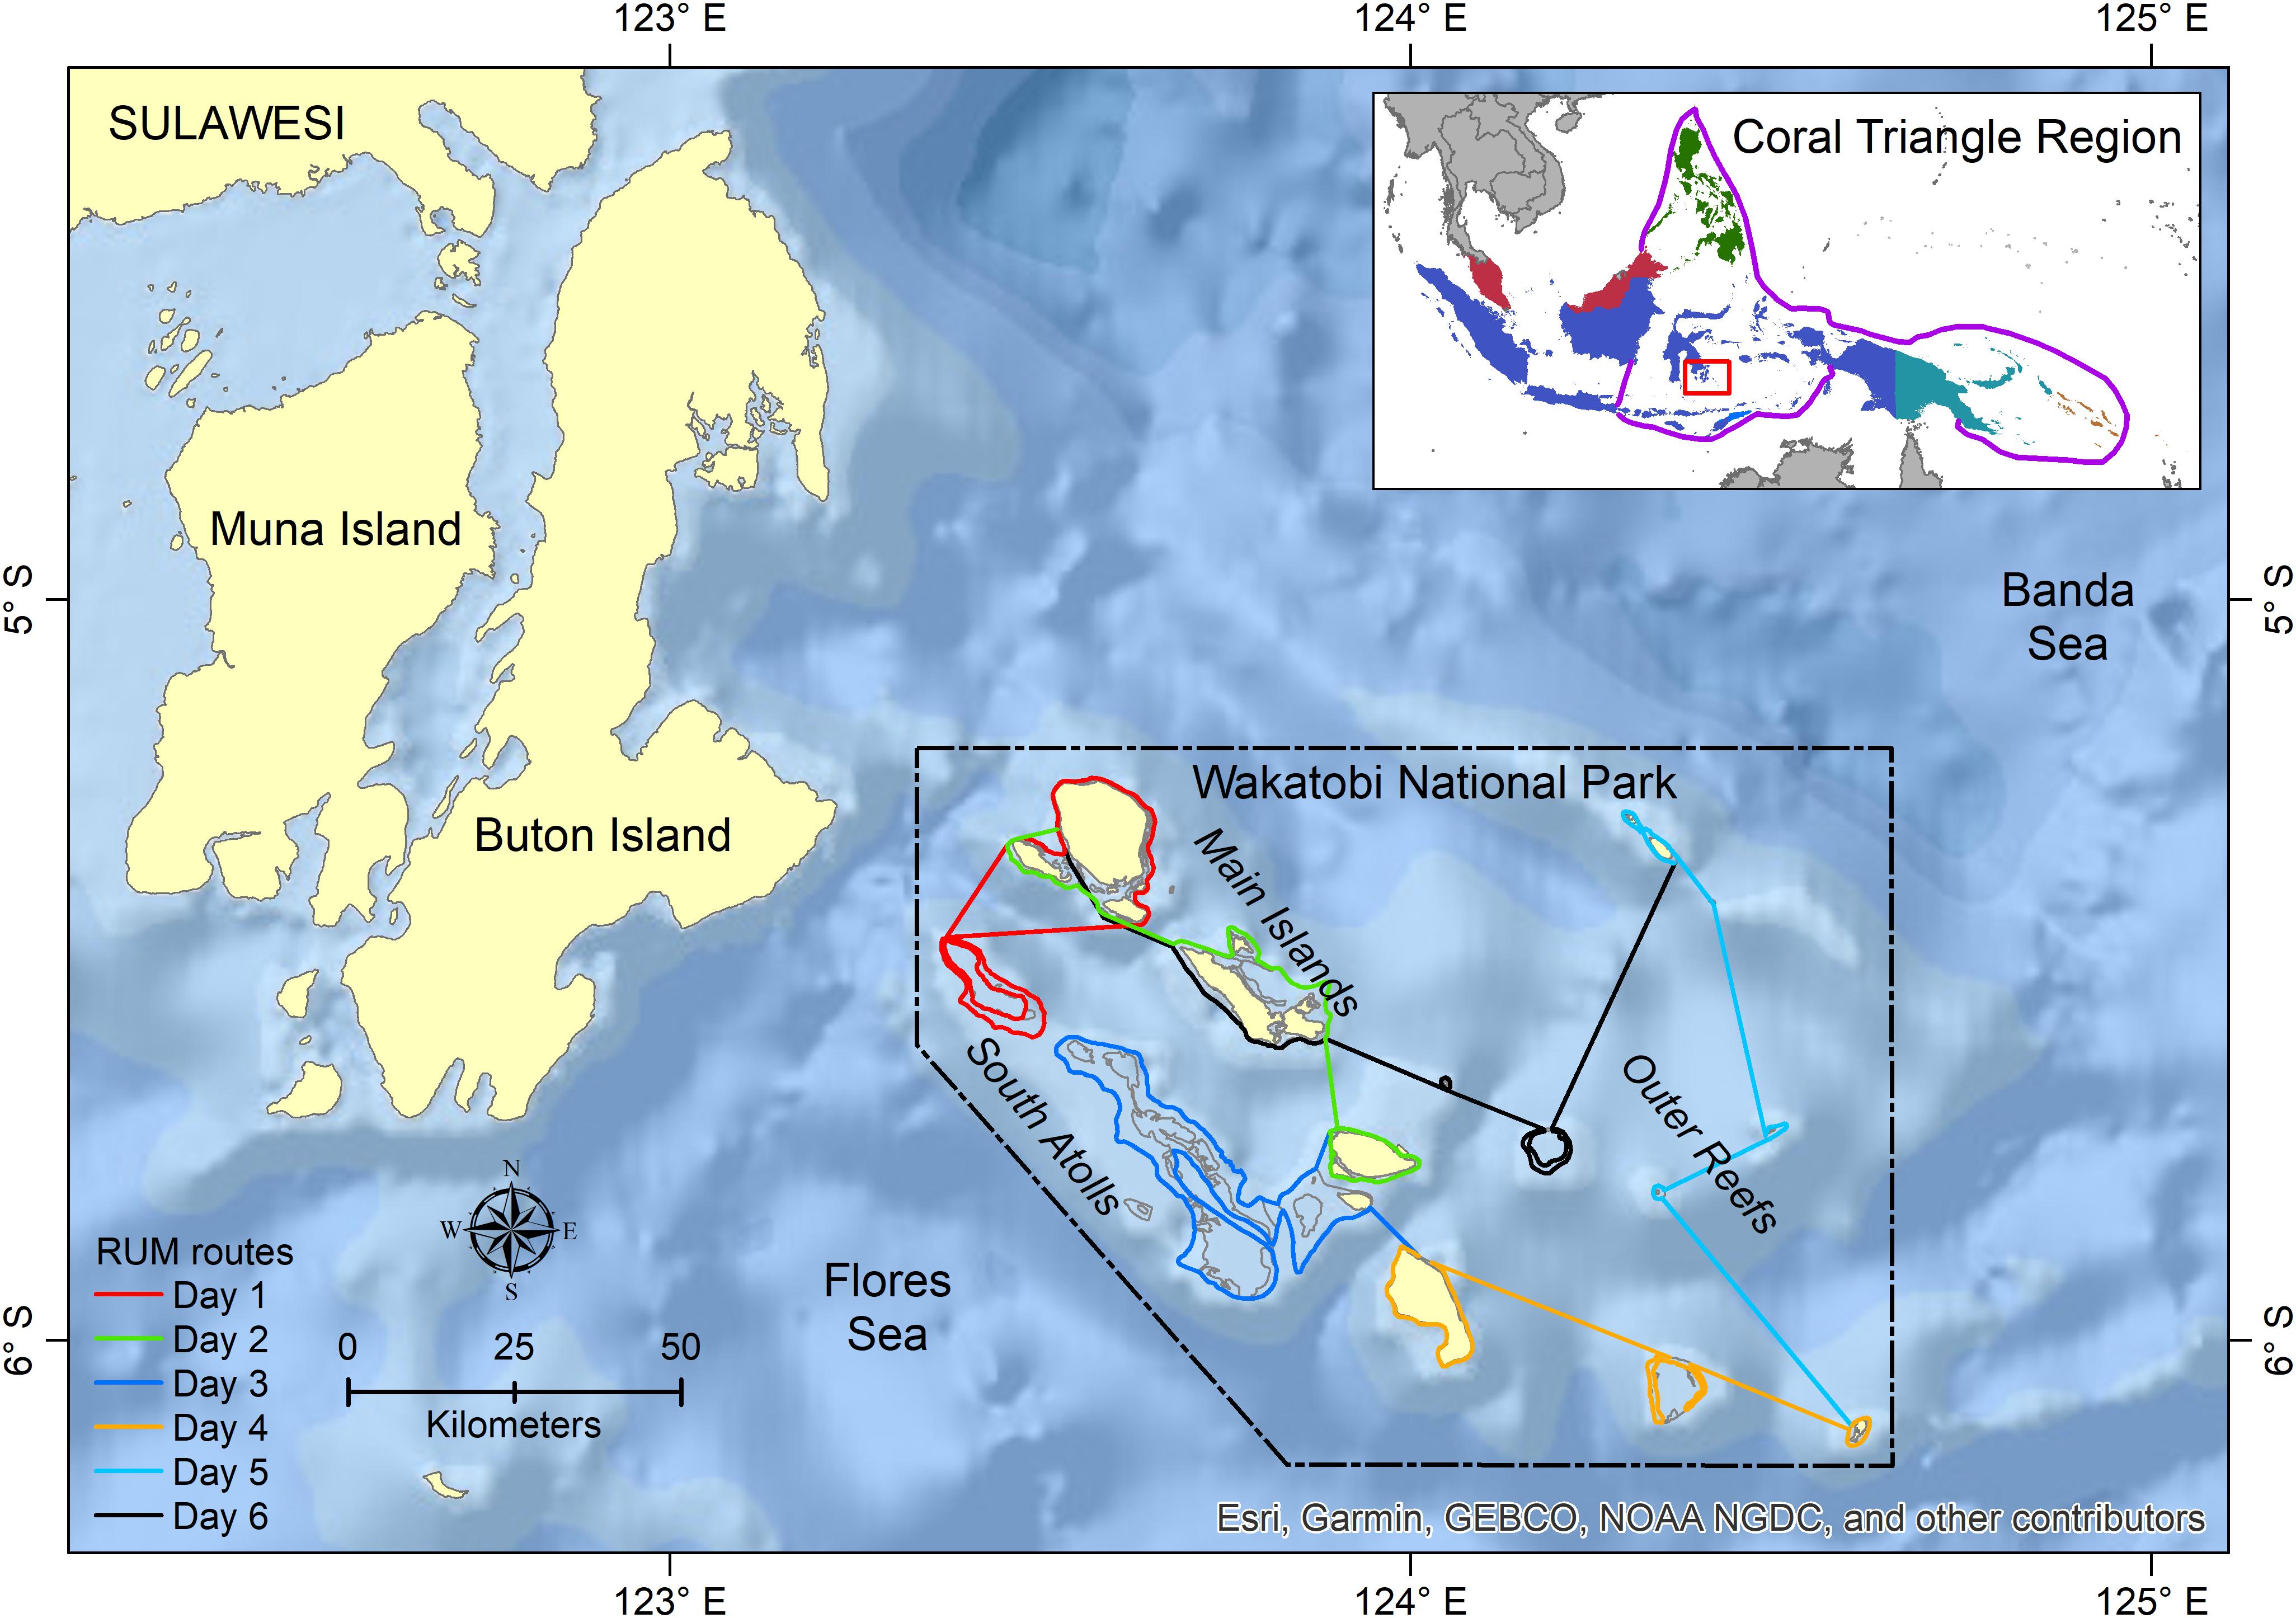
Figure 1. Study area in Wakatobi National Park (WNP) and adjacent waters. The routes of Resource Use Monitoring (RUM) as a main platform-of-opportunity survey are presented as colored lines.
Data Collection
Cetacean data were collected from May 2004 to May 2012 following a cetacean monitoring protocol developed by the WNP Authority and The Nature Conservancy-World Wildlife Fund for Nature (TNC-WWF) Joint Program Wakatobi. Briefly, the protocol was applied by trained personnel mainly during Resource Use Monitoring (RUM) trips conducted to collect data on fishing activity. Other platforms of opportunity used were vessels conducting diverse monitoring programs (reef health, turtle, seabird, spawning aggregation site), the tuna tagging program, VIP guest trips, trips to outer Wakatobi, incidental patrols, and inter-island cruises; thus making the cetacean surveys cost-effective. Sightings reported by fishermen and volunteers were included as incidental sightings.
Different fleets were used as observation platforms, including some speedboats (length ∼4 m; height 0.5–1 m; speed ∼20 knots); and “Floating Ranger Station” liveaboards (length ∼20 m; height 3–5 m; speed 7–9 knots). Travel speed was not constant depending on navigation, boat type and weather conditions.
The RUM was designed to cover all habitat types within the WNP (i.e., main islands, south atolls, and outer reefs), and took 6 days to complete by following fixed line transects (Figure 1). However, the boats did not always follow the predetermined survey routes due to technical issues e.g., logistics and supply, vessel reparation, and weather constraints. This arrangement resulted in changes to the fixed routes and difference in area coverage between surveys. In 2007 and 2008, several surveys could be conducted in 1 month, resulting in the higher sum of surveyed days per month (a complete trip suggested by the protocol).
Cetacean observations took place en-route between the harbor of origin and the destination (e.g., fishing locations, location of targeted monitoring) as well as en-route between destinations. Search efforts were suspended during the RUM interview stops or when a targeted monitoring had to take place. At least one observer maintained visual watch during daylight hours (06:00–18:00 h, weather permitting). Searching was primarily done with the naked eye or sometimes with the aid of hand-held binoculars. The observers were trained and experienced in cetacean data collection and identification, although their abilities varied and it cannot be guaranteed that search effort was continuous in all cases. All records were quality controlled by experienced observers that were onboard to ensure that the methodology was as consistent as possible between observers. Surveys also recorded days at sea with no sightings. Because the method does not follow a standardized distance sampling protocol (Buckland et al., 2001), all sightings recorded during these surveys were categorized as “opportunistic.”
When a cetacean group was detected, the boat slowed down or stopped, and information was recorded on a standardized form. This form included entries for geographic position, time of sighting, species identity, number of individuals, and observer name(s). In the form, estimated distance and relative angle from the vessel to the cetacean group at the time of the sighting were noted as well as specific behavior and other remarks, although not all observers recorded all this information. A cetacean handbook was used to aid in the identification of sightings to the species level. When species identification was questionable, photographs were shown to other cetacean experts working in the region. If identification was not possible on a species level, the sighting was recorded as dolphins, whales or unidentified cetacean. Unidentified species can be caused by a combination of factors, such as very short encounters, distance of the sighting, no clear appearance of the cetacean, or lack of observer identification skills. Weather conditions were not consistently recorded each day and records were not always provided with a sea state description (e.g., Beaufort scale), although outstanding sea conditions including rain, strong wind, and high waves were usually recorded. Vessels did not go out when weather condition were so bad (approximately Beaufort >4) that they would hamper the vessels to conduct their work.
Data Analysis
Survey Efforts
The survey set-up did not facilitate the collection and storage of continuous GPS data, so information on km tracks or search hours per day was not recorded. The best available proxy for survey effort was survey days at sea. For each survey day, information on cetacean sightings, including days with no sightings, were available. The limitations of the data in terms of survey coverage and number of sightings meant it was not feasible to compare the results from outside and inside WNP. Therefore, we treated our data (inside and outside WNP) as one dataset. All data that included effort information were considered to be part of the “eligible survey” dataset.
An eligible survey was defined as any trip that consisted of four (equal to two third of a complete trip suggested by the monitoring protocol) or more days. This subset of the available data made the different surveys more comparable in their area coverage and applicable as a proxy of effort. Using both “days with” as well as “days without” sightings per survey allowed the calculation of a relative sighting frequency (of both sightings and individual animals).
Datasets Used
All cetacean sighting records were quality-checked and placed in a database. This information was used to provide a species record for the area and to describe the presence only occurrence for each species. With this data filtering, the number of surveys for calculating sighting frequency (i.e., number of sightings per survey day) was reduced to 103 (74%) surveys from the original 140 surveys. The number of sightings was also reduced to 241 (67%) sightings from the original 358 sightings. Therefore, we combined the sightings based on higher taxa and defined large cetaceans (baleen and sperm whales) and small cetaceans (the rest taxa). The sighting frequency was averaged per survey and then monthly and annually.
To understand a possible determinant to the inability to identify cetaceans, we conducted logistic regression (Field, 2013) between the dummy variable of unidentified cetaceans and several independent variables, i.e., the distance between the animals and the observers, the number of animals encountered in a group and season. We could not examine the association between other variables (e.g., the encounter period or observers’ skills) due to the absence of such data.
Spatial and Temporal Occurrence Patterns
All sightings that were obtained from all survey days at sea were combined into a single dataset. ArcGIS 10.6.1 (Environmental Systems Research Institute, Inc.) was used to visualize species spatial distribution or occurrence patterns maps based on sighting locations and number of individuals. Sufficient sightings for depicting spatial occurrence patterns were only available for the four most abundant species: spinner dolphin, bottlenose dolphin, melon-headed whale, sperm whale, as well as two unidentified taxa (dolphins and whales). The cetacean occurrence was correlated to the current park zoning system, reef habitat types, and depth preferences to assess area preference. Depth data were extracted from the General Bathymetric Chart of the Ocean (GEBCO1). For investigation of the temporal occurrence patterns, sighting data per species were grouped by month from all survey years. The sighting data of the four most abundant species described in this paper were also used to analyze the habitat suitability of these species in another paper using a more complex habitat model.
Additional Important Information
Information on cetacean behavior, mother-calf pairs, and cetacean-fishing vessel and fish aggregation devices (FADs) interaction was not always recorded for each sighting. Since the amount of additional data was limited, no inferential statistical analysis could be performed, therefore it only was reported descriptively. Behavior of cetaceans was classified into four categories: (i) traveling–normally moving animals on a steady course, (ii) resting–stationary in one place, almost without movement, (iii) socializing–clear and constant interaction between the animals in a normally stationary group, and (iv) foraging–non−synchronized movements and very active animals, normally involving the visualization of prey or aggregation of birds (Alves et al., 2018). We added (v) “bow riding” as a special category, since the behavior is prevalent in small cetaceans, and it shows a cue of being attracted to vessels (Anderwald et al., 2013).
Results
Efforts and Sighting Summary
A total of 671 days were surveyed from May 2004 to May 2012 of which 229 days were with sightings (Table 1). The total of 358 sightings corresponds to 12,846 individual animals. Surveyed days at sea were relatively consistent over the years, although only in 2007 and 2008, all months of the year were covered (Table 1, Figure 2, and Supplementary Figure S1). Although the months in which surveys were performed included all four monsoonal seasons, most effort was concentrated in inter-monsoonal (transition) seasons characterized by calm weather (Figure 2): from March to May (Transition 1 season, before SE monsoon) and September to November (Transition 2 season, before SW monsoon). The remaining months are mainly associated with rough weather, particularly from the end of June to August (SE monsoon).
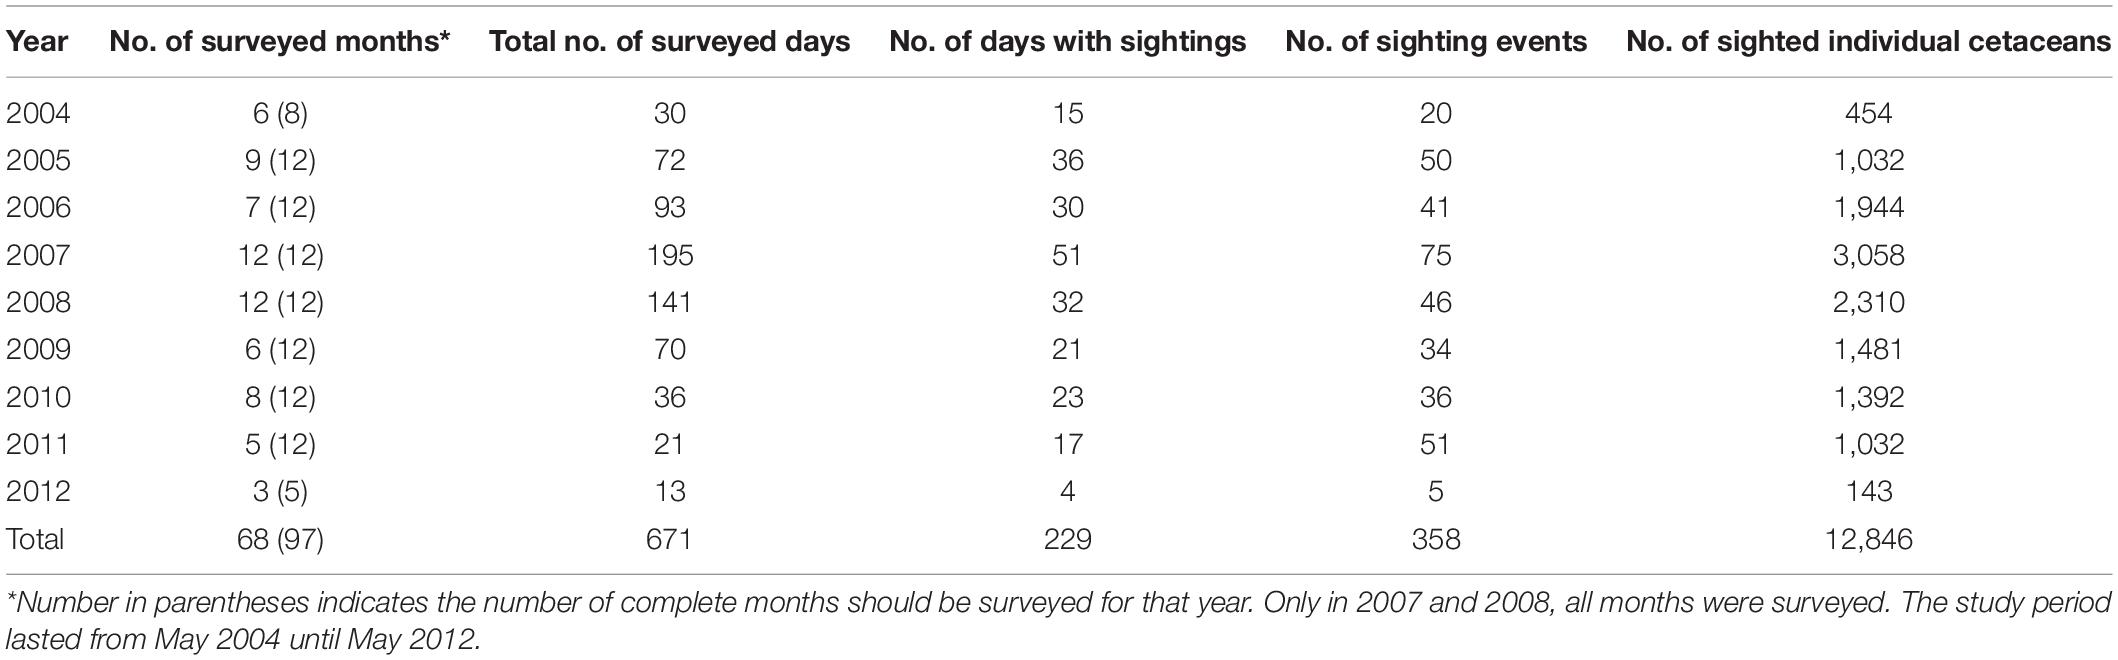
Table 1. Summary per year of cetacean survey efforts (using all dataset) and cetacean sightings and numbers in Wakatobi National Park and adjacent waters.
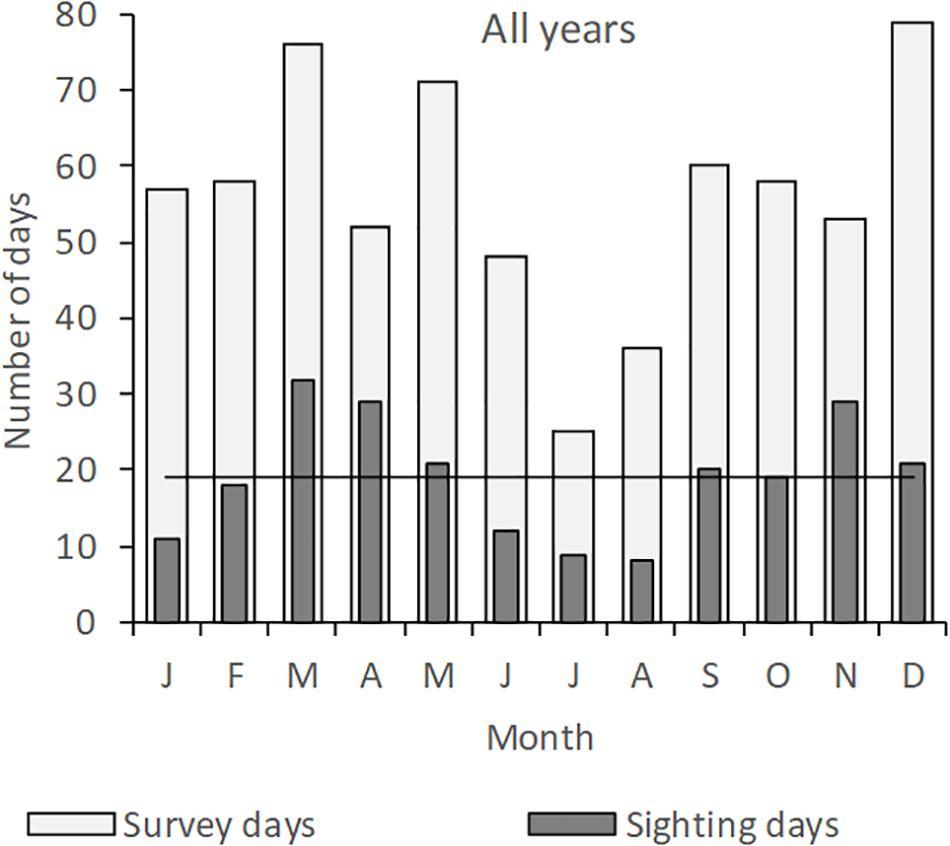
Figure 2. Total monthly survey efforts (number of survey days) and numbers of days with cetacean sighting during the Wakatobi cetacean monitoring program from May 2004 to May 2012. Horizontal line (–) indicates mean number of days with cetacean sighting over all months. T1, Transition 1 season (March–May); SE-Mons, SE Monsoon season (June–August); T2, Transition 2 season (September–November); SW-Mons, SW Monsoon season (December–February).
Cetacean Diversity
Eleven species were positively identified in the WNP and adjacent waters during this study, which accounts for 37.4% of all sighted cetaceans. Among the identified species, eight were small cetaceans and three were large whales (sperm, Bryde’s, and blue whales) (Table 2). The four most frequently sighted species were spinner dolphin (17.6%), bottlenose dolphin (7.5%), sperm whale (5.6%), and melon-headed whale (3.6%) (Table 2). The sightings of these four species comprised 34.4% of the total number of sighting events. Each of six other species only represent less than 1% of the sightings, while the majority of the sightings (55.3%) were unidentified dolphins (Table 2).
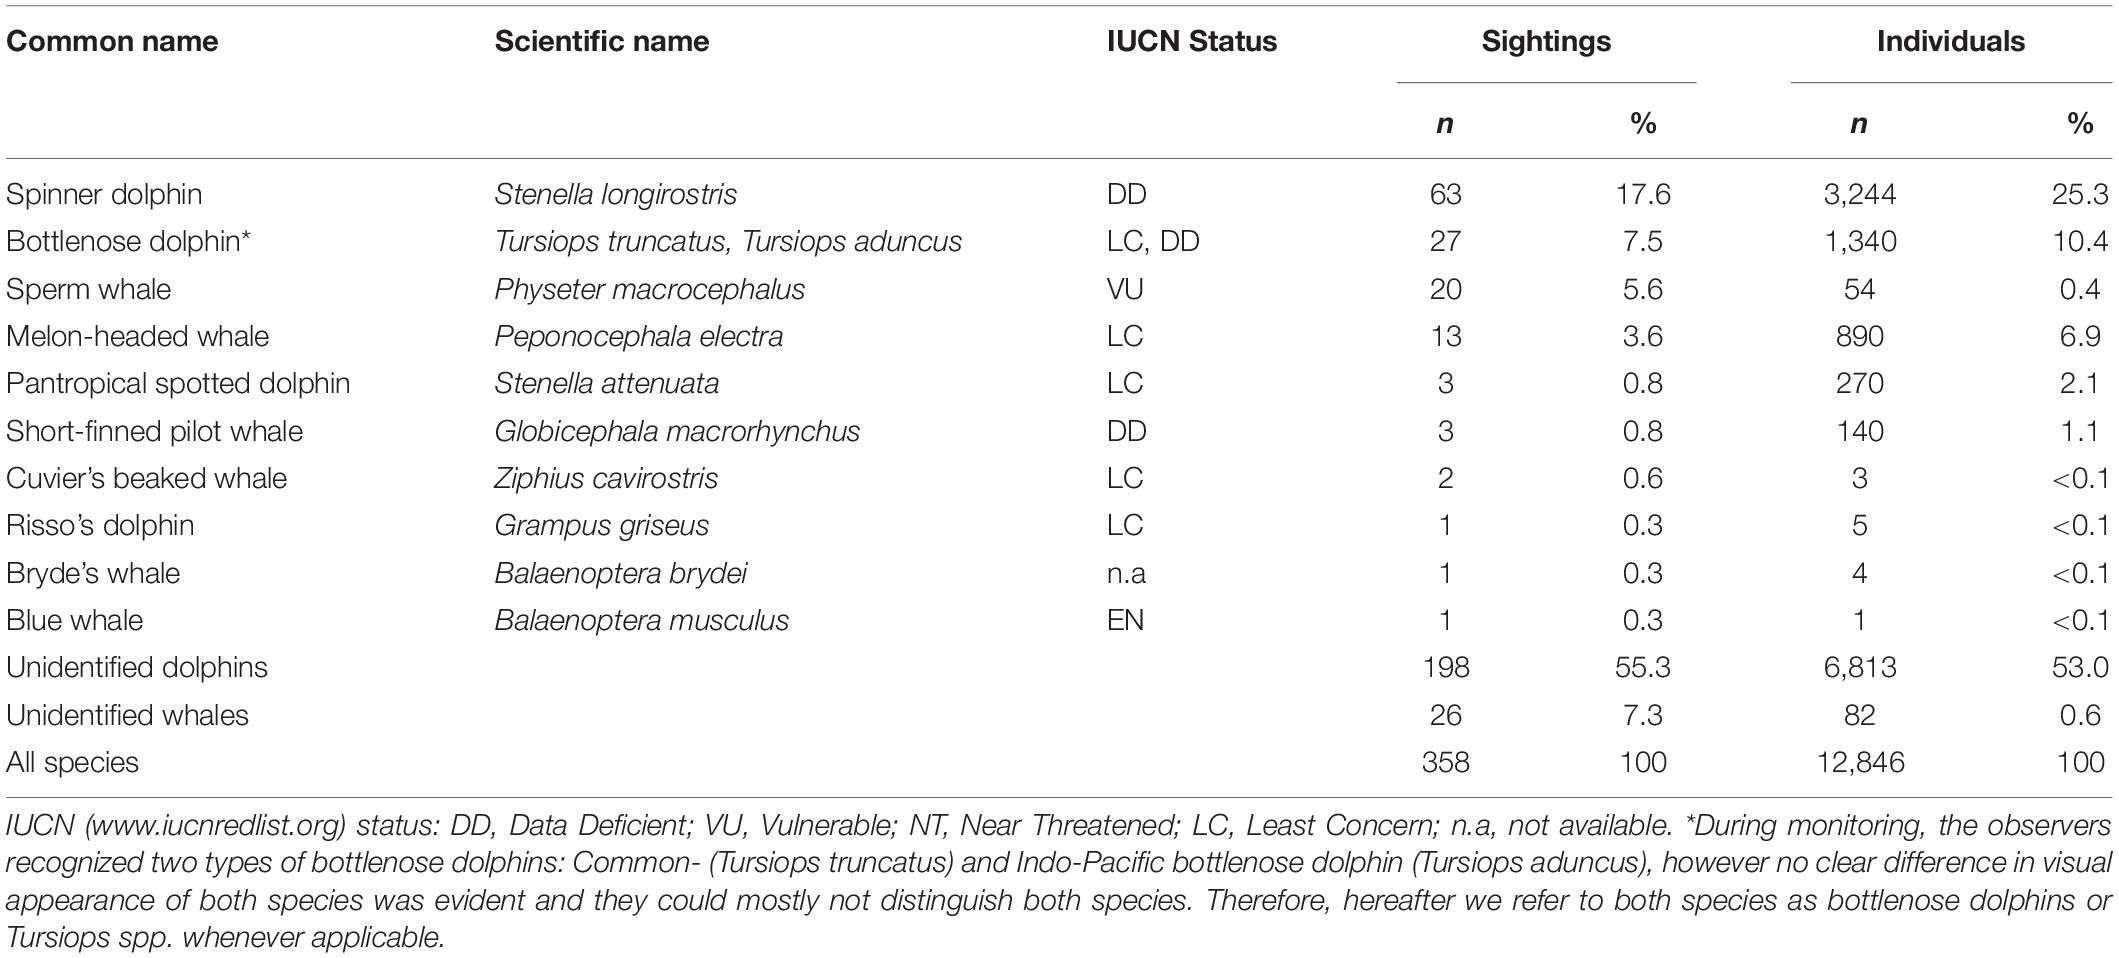
Table 2. Summary of cetacean species sighted in Wakatobi and relative number of sightings and individuals (in relation to total n) from May 2004 to May 2012.
The order of most sighted species based on the number of individuals was a bit different for the first four highest ranks: spinner dolphin (25.3%), bottlenose dolphin (10.4%), melon-headed whale (6.9%), and Pantropical spotted dolphin (2.1%). The greatest proportion of individuals reported were unidentified dolphins (53%). The identified cetacean species mostly have the IUCN status of “Least Concern” (five species) and “Data Deficient” (three species) (Table 2). Observations of less commonly sighted cetaceans also contribute to species presence information for endangered and vulnerable species in Wakatobi waters i.e., blue whale and sperm whale.
Spatial and Temporal Occurrence Patterns
Overall, sightings were mainly concentrated in two geographic areas representing reef habitat types within the WNP i.e., inshore the main islands and south atolls, although some sightings were also observed in offshore outer reefs (Figures 3, 4A). Spinner dolphins were seen in all habitat types (Figures 3A, 4A), while bottlenose dolphins and melon-headed whales occupied mainly the waters between the main islands and south atolls (Figures 3B,D, 4A). Sperm whales were sighted mostly in the east of the main island bordering outer reefs and in the north part of the main islands, and tended to avoid the south atolls (Figures 3C, 4A).
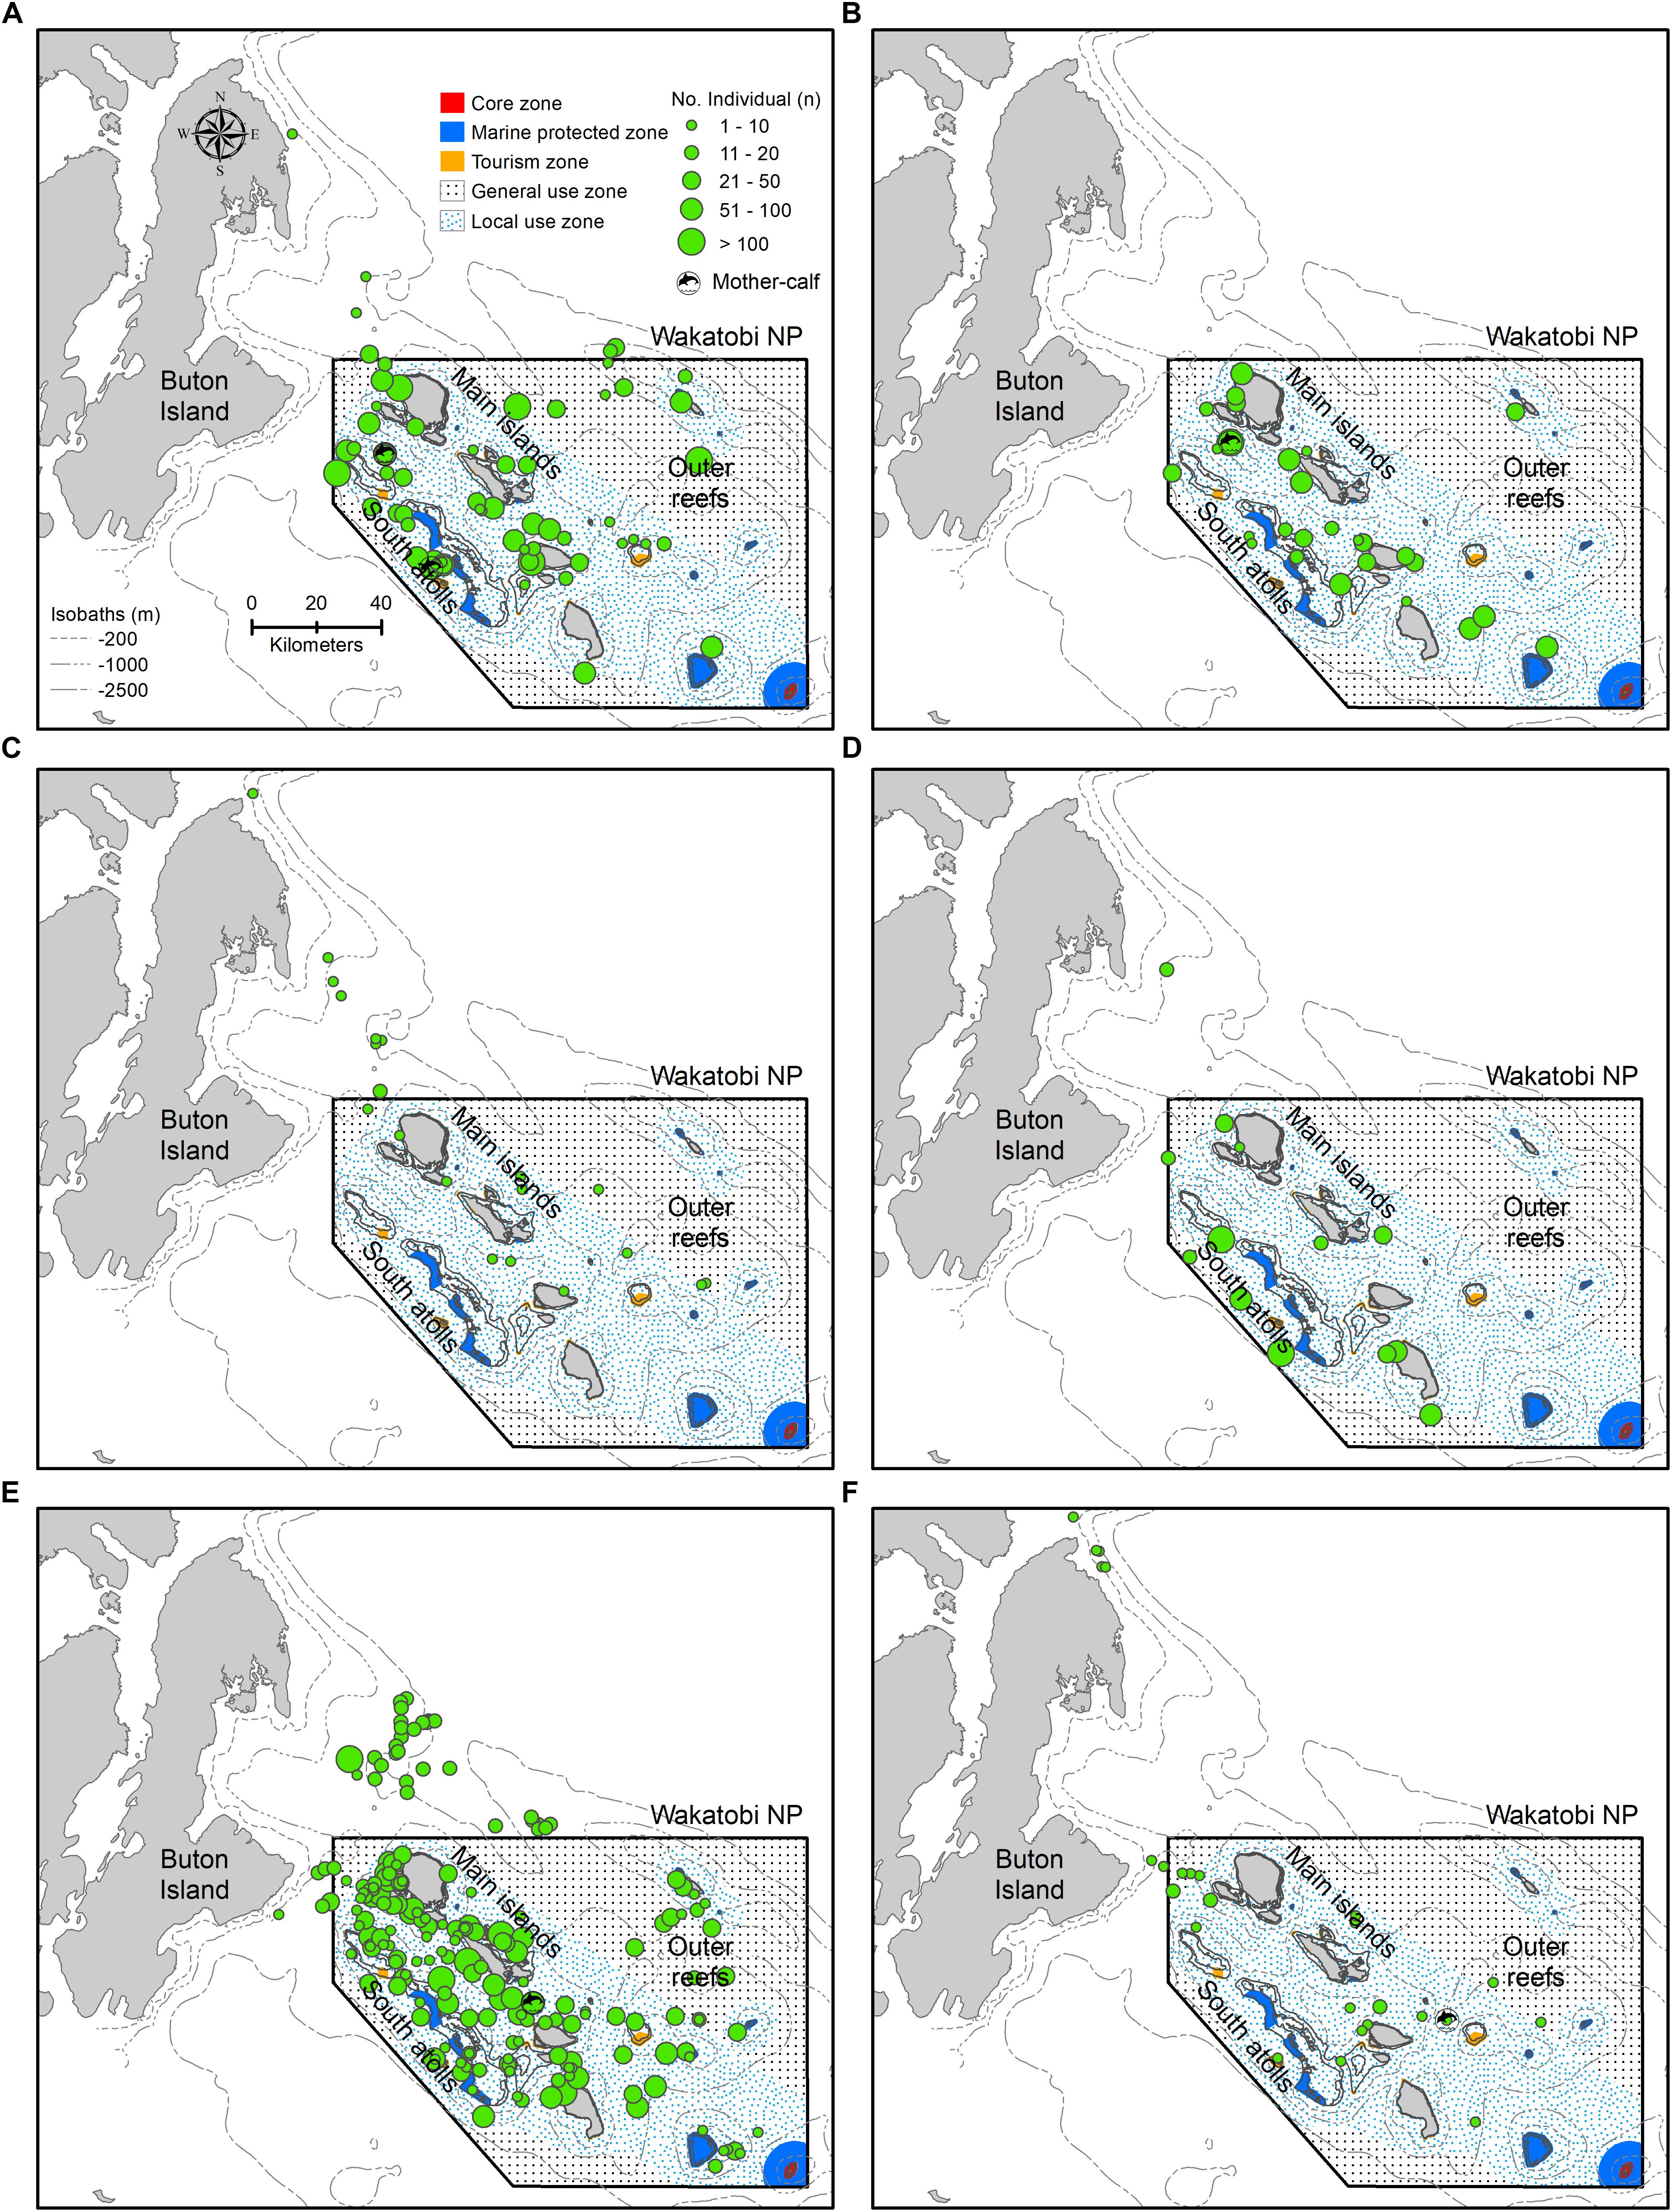
Figure 3. Spatial occurrence patterns of cetaceans in Wakatobi based on sightings in the period of May 2004 to May 2012: (A) Bottlenose dolphin, (B) Spinner dolphin, (C) Sperm whale, (D) Melon-headed whale, (E) Unidentified dolphins, and (F) Unidentified whales. The depth contours (isobaths) and Wakatobi National Park (WNP) zoning system are presented in panel (A).
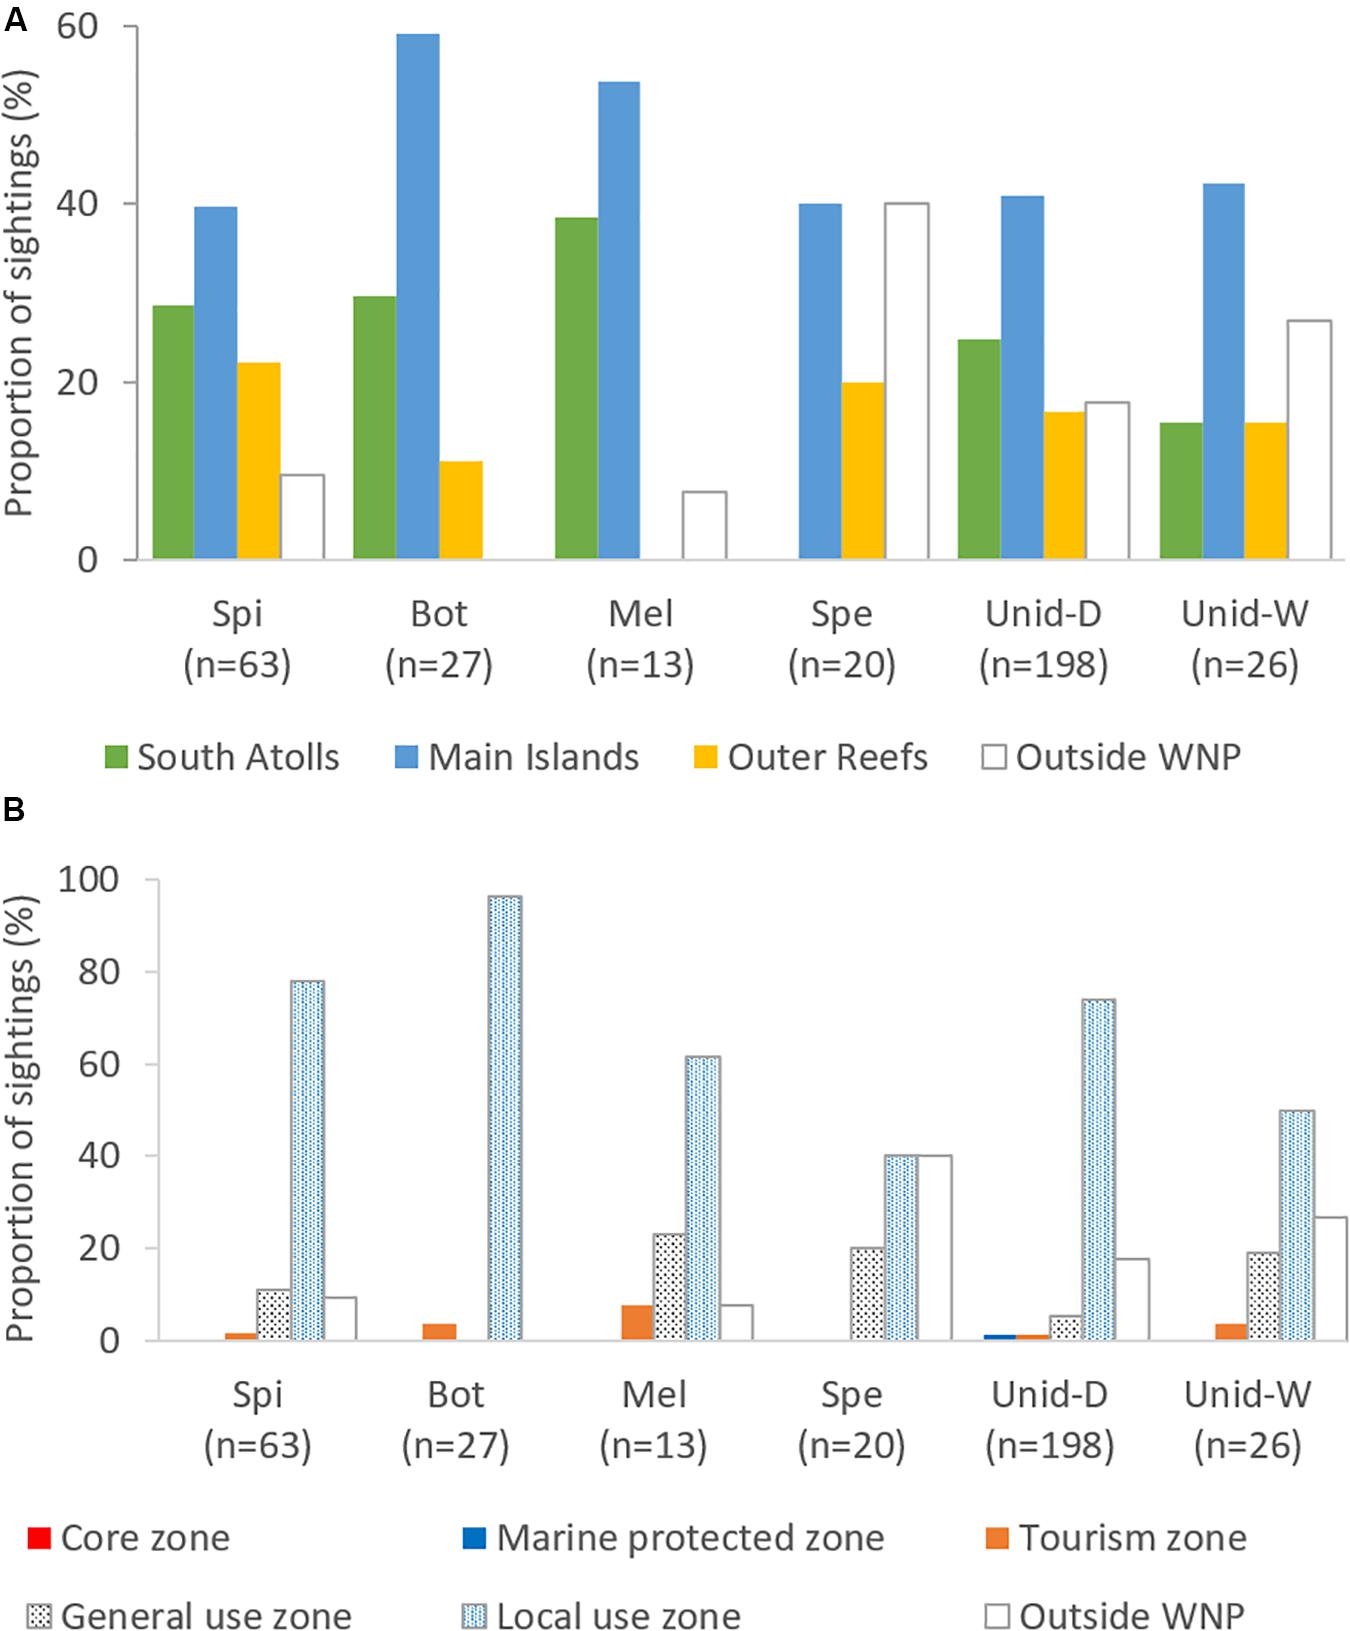
Figure 4. Proportion of sightings based on reef habitat types (A) and WNP zoning system (B). Bot, Bottlenose dolphin; Spi, Spinner dolphin; Mel, Melon-headed whale; Spe, Sperm whale; Unid-D, Unidentified dolphins; Unid-W, Unidentified whales.
Most of the cetacean sightings (>90% for small cetaceans, >60% for large cetaceans) occurred in the zones of the WNP that are also used by people. The WNP Authority accommodates three zones based on the types of human activities: tourism zone, local use zone (only available for local fishermen), and general use zone (open for all, including fishermen from outside WNP with permits) (WNP Authority, 2008), hereafter together indicated as “use zones” (Figure 4B). The “no-use” zones can be divided in a core zone (no go zone) and a marine protected zone (accessible but no human activities allowed). In addition to occurring in the use zones, sperm whale and unidentified whales were also prevalent outside the WNP zoning system (Figures 4A,B). For all species and taxa, sightings seen within “no-use” zones were less than 2%, while no sightings were even found in the core zone (Figure 4B).
Each of the four most sighted species had different depth preferences. Spinner dolphin and bottlenose dolphin mostly occupied shallower waters (depth median of −153 and −10 4 m, respectively), while sperm whale and melon-headed whale were mostly seen in the deeper waters (depth median of −816 and −762 m, respectively) (Figure 5), and sperm whale especially along the steep slopes (Figure 3C).
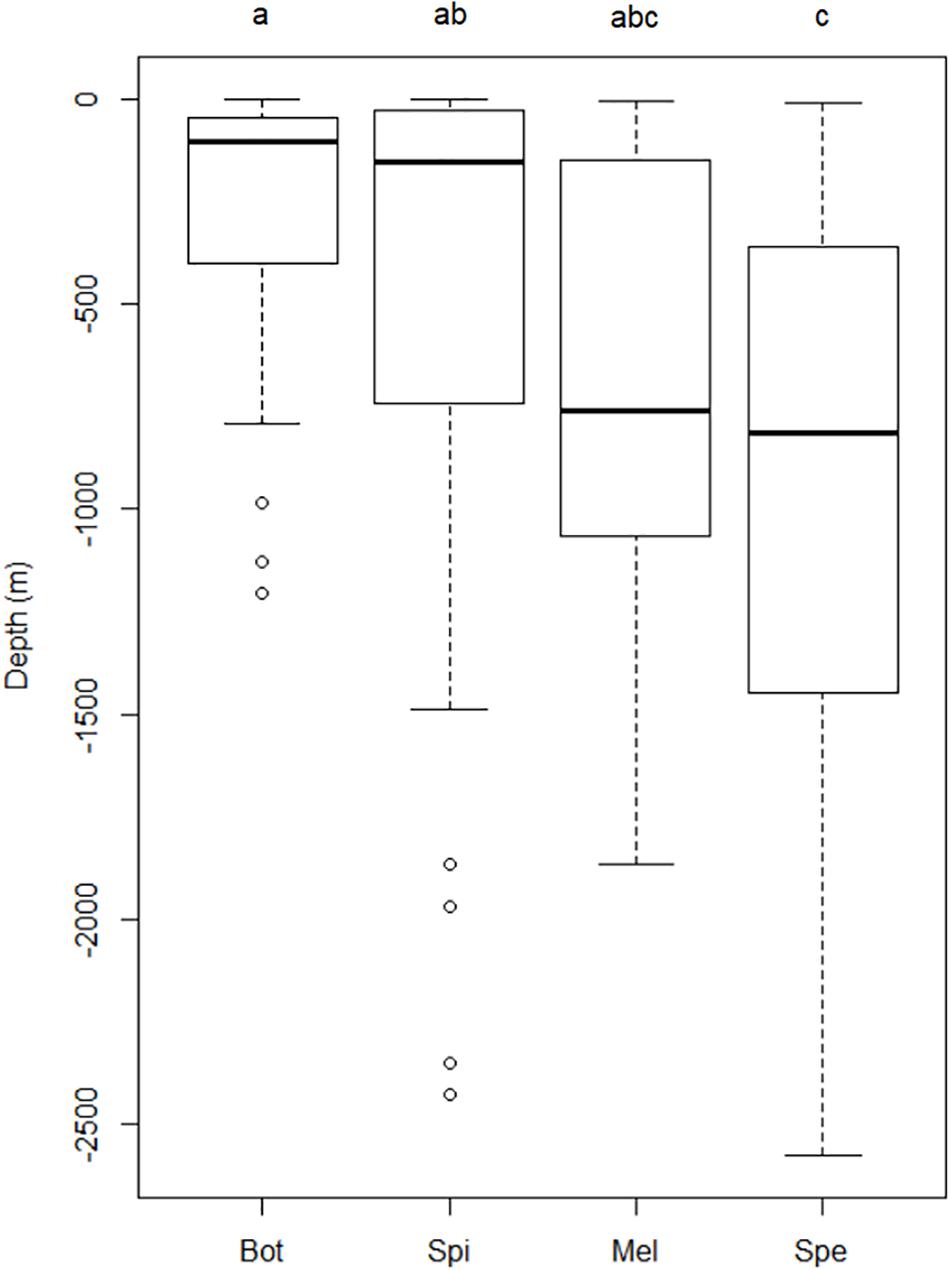
Figure 5. Boxplots of sightings of four most abundant cetacean species associated with depth in Wakatobi: Bot, Bottlenose dolphin (n = 27); Spi, Spinner dolphin (n = 63); Mel, Melon-headed whale (n = 13); Spe, Sperm whale (n = 20). Significant differences of depth among species were checked using Kruskal–Wallis. Wilcoxon post hoc test was applied for multiple comparisons after Kruskal–Wallis testing indicated a significant difference. The same letters indicate the boxplots do not differ significantly.
Seasonally, the number of identified cetacean species sighted was higher (>4 species) in March and April and from September to December, with a maximum of six species in November (Table 3). Only 2–3 identified species were recorded for the other months. Even though the data were collected through opportunistic survey platforms during all months, no successfully identified species was sighted in July (Table 3). Consequently, no single identified species was sighted year-round. Only in March, April, and November were the four most sighted species recorded (Table 3). No apparent temporal occurrence pattern was identified for the remaining six less sighted species.
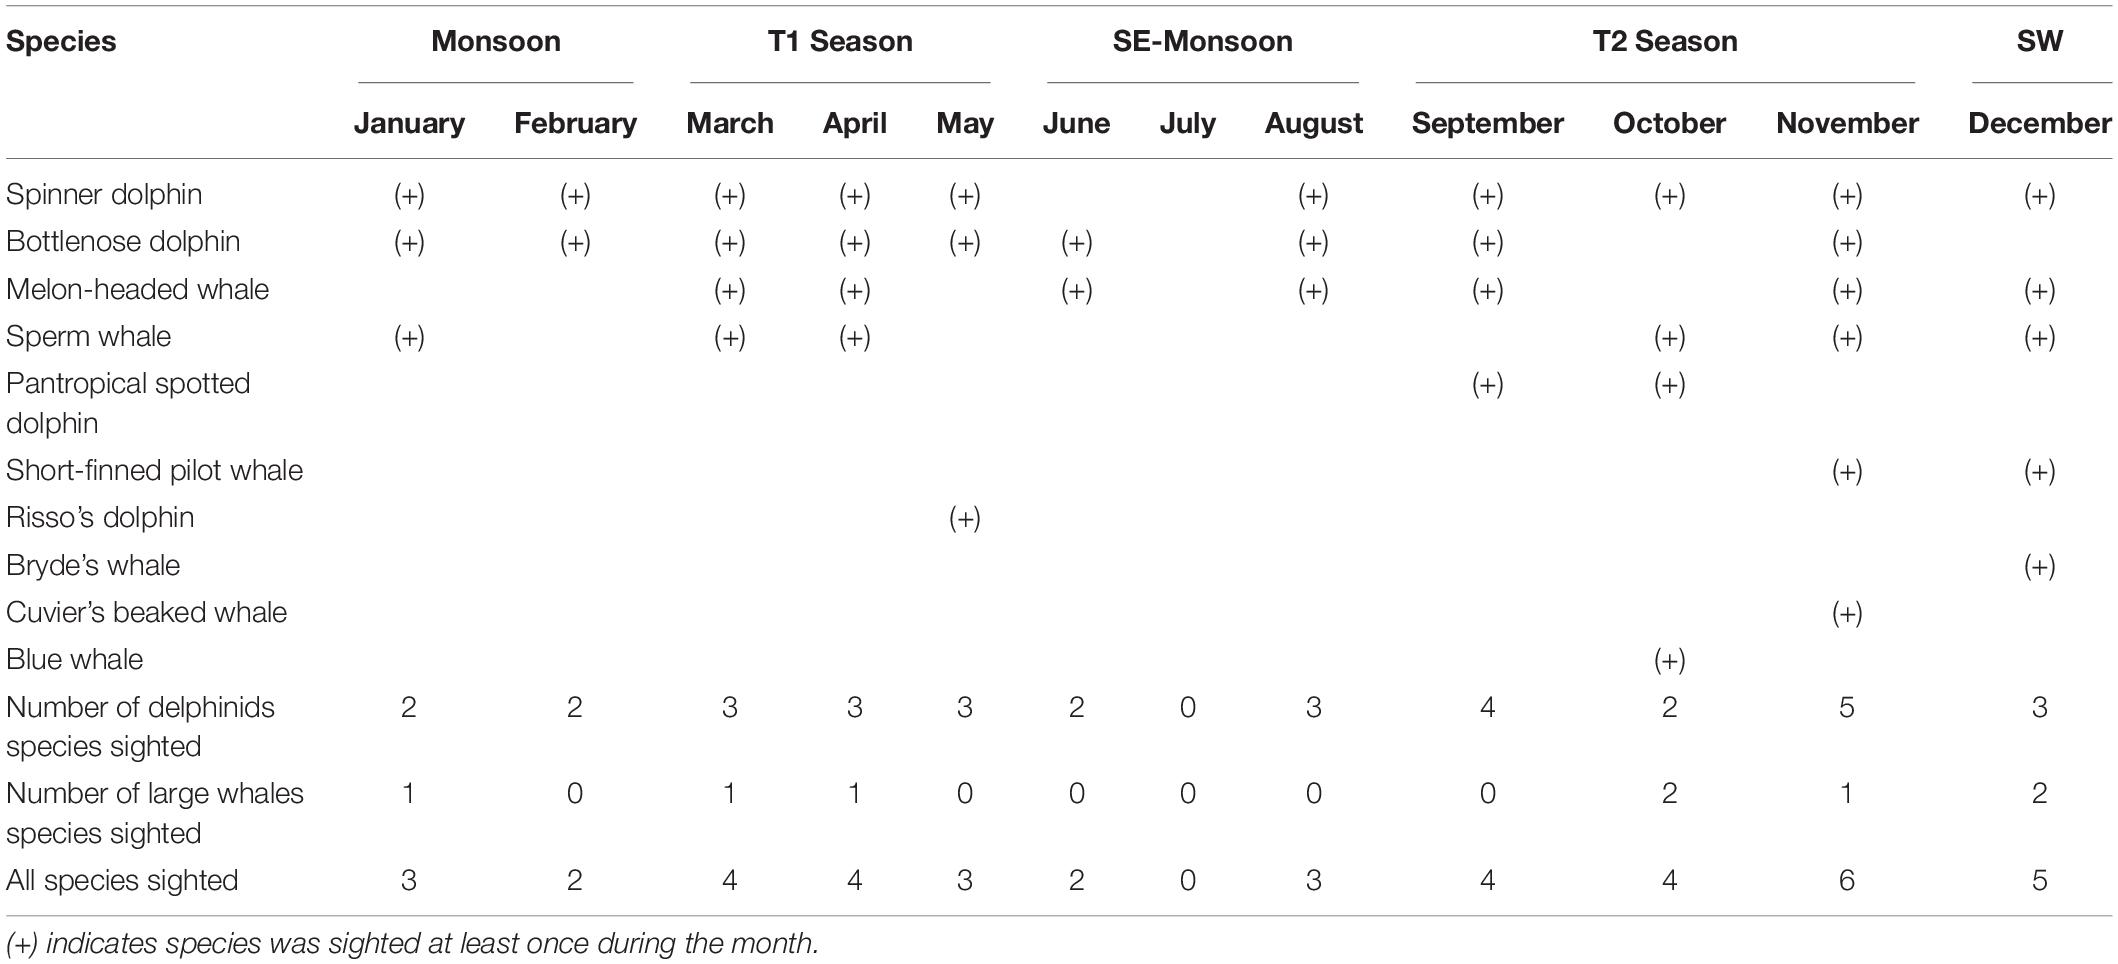
Table 3. Seasonal occurrence: whale and dolphin species sighted in different months between May 2004 and May 2012 in Wakatobi (using all dataset).
Behaviors, Mother-Calf Pairs and Cetacean-Fishing Vessel Interaction
From 193 sightings (53.63%), information on behavior, mother-calf pairs or cetacean-fishing vessel interaction was recorded. Given that behaviors are species-specific, we showed the behavior per species for four most sighted cetaceans (Figure 6). Foraging and socializing were the two prominent behaviors in small delphinids (spinner dolphin, bottlenose dolphin, and melon-headed whale). Bow riding was prevalent in spinner and bottlenose dolphins. Only sperm whales were observed resting, although it is important to note that we only sighted three individuals for this species. For complete information on cetacean behaviors per species and taxa, see Supplementary Table S1 in the Supplementary Information.
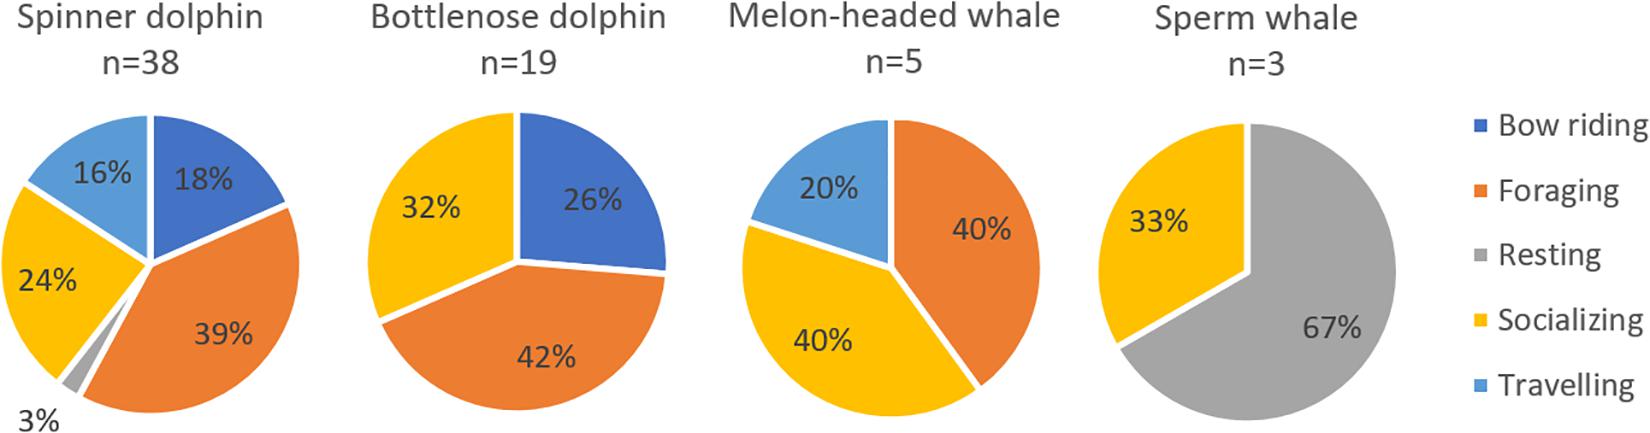
Figure 6. Relative occurrence of each behavior category for four most abundant species.
Cetacean sightings with calves were observed five times (1.4% of total sightings) during the course of study: twice for spinner dolphin, and once each for bottlenose dolphin, unidentified dolphins, and unidentified whales. In total, 13.4% of the sightings were associated with fishing vessels or FADs; all were small cetaceans consisting mainly of unidentified dolphins and spinner dolphin, and to a lesser extent pantropical spotted dolphin, bottlenose dolphin and melon-headed whale.
Opportunistic Survey Results (Sighting Frequency)
A subset of all the surveyed days was defined as “eligible surveys” with comparable spatial coverage between months and years. The results showed that sighting frequency of large cetaceans was relatively constant, at around 0.25 sightings per day from 2004 to 2009, except for 2006 when it was <0.2 sightings per day. No sightings were recorded for large cetaceans in the last 3 years (Figure 7A). Small cetaceans were seen regularly over the study period with the sighting frequency ranging from 2.25 to 4.33 sightings per day, with three peaks occurring in 2005, 2010, and 2011 (Figure 7C). Monthly sighting frequency for both taxa showed a bimodal distribution, with peaks in September to November (Transition 1 season) and around March (Transition 2 season) (Figures 7B,D). The monthly trend was quite similar both for large and small cetaceans, i.e., months with no sightings for large cetaceans tend to also have less sighting frequency for small cetaceans (Figures 7B,D). The frequency of individuals per daily survey for both taxa can be seen in Supplementary Figure S3 of the Supplementary Information.
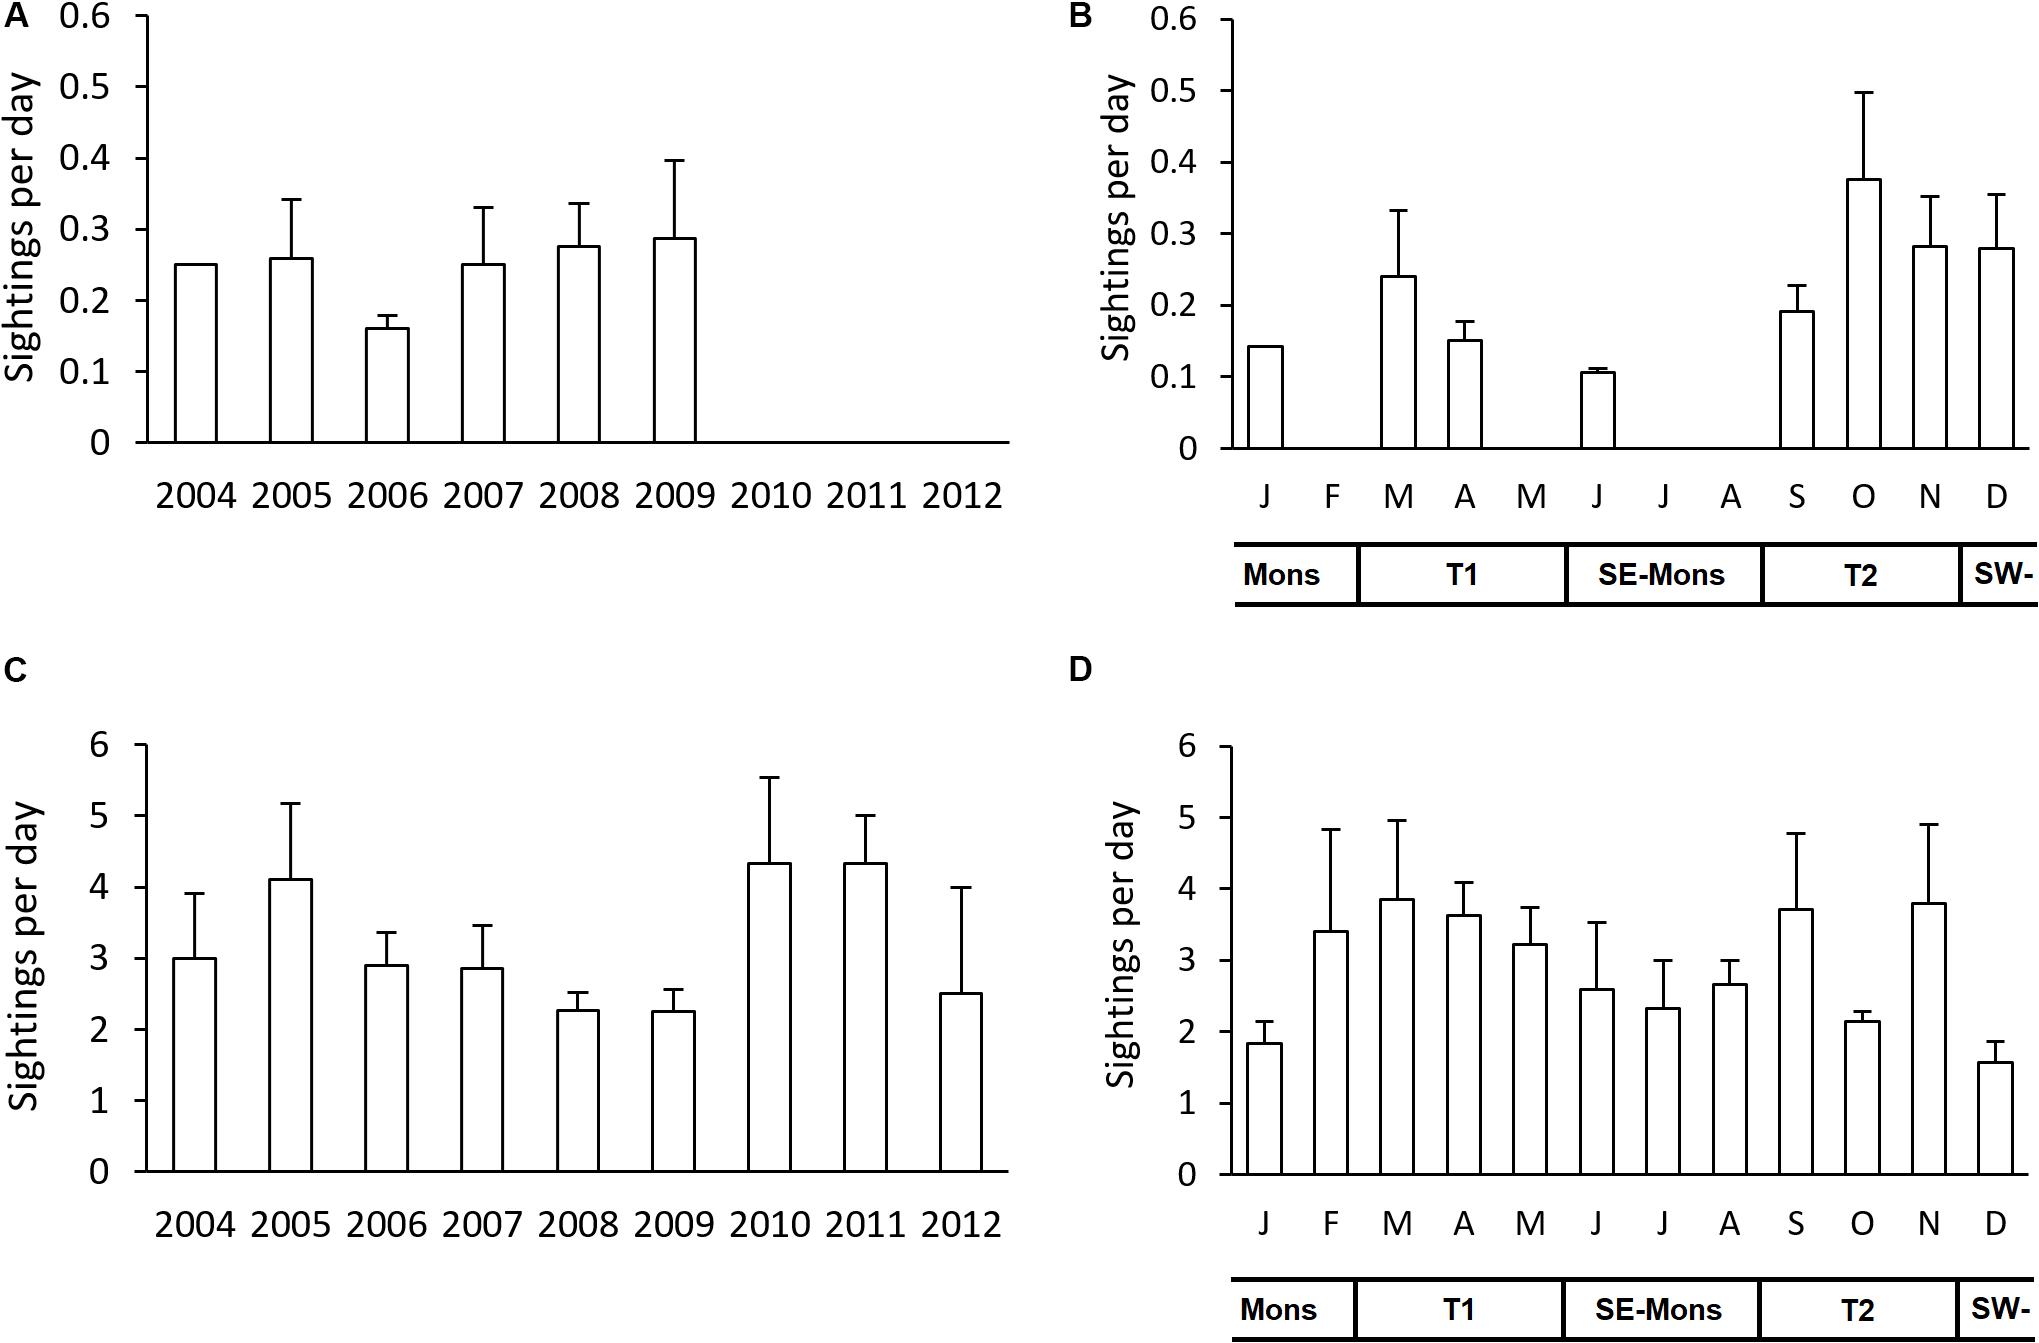
Figure 7. The average sighting frequency per day for each year from May 2004 to May 2012 for large cetaceans (A) and small cetaceans (C); and by month for large cetaceans (B) and small cetaceans (D). T1, Transition 1 season (March–May); SE-Mons, SE Monsoon season (June–August); T2, Transition 2 season (September–November); SW-Mons, SW Monsoon season (December–February). The sighting frequency were calculated from a sub-sample of dataset with surveyed days of 4 or more days per survey. Error bars indicate standard errors.
Calculating the number of all cetacean sightings per year and month allowed for a temporal analysis of cetacean occurrence over time (Supplementary Figure S2). The number of sightings for large and small cetaceans fluctuated greatly over the years with the highest numbers in 2007 and 2008 for both taxa (Supplementary Figures S2A,C). Note that in 2004 and 2012, the survey efforts only cover parts of the year. The monthly sighting frequency (Figures 7B,D) is related to the monthly number of sightings (Supplementary Figures S2B,D). The total number of individual animals per year and per month for both taxa are presented in Supplementary Figure S4 of the Supplementary Information.
Determinants to Unidentified Cetaceans
We conducted separate logistic regressions to examine possible determinants to unidentified dolphins (n = 198) and unidentified whales (n = 26), using season, distance between the observers and the animals and animal group size as the independent variables. Season and distance were not significantly associated with the prevalence of unidentified dolphins or whales. The number of dolphins per group per sighting was a significant determinant for the prevalence of unidentified dolphins (p = 0.000, B = −0.240, Exp(B) or ratio = 0.787), which was produced by a model with Block Chi Square = 56.650 (p model = 0.000, Nagelkerke R2 = 0.364). Using the same model setting, the number of whales per group per sighting was also a significant determinant for the prevalence of unidentified whales (p = 0.000, B = −0.240, Exp(B) or ratio = 0.787, Block Chi Square = 56.650, p model = 0.000, Nagelkerke R2 = 0.364). Thus, the smaller the number of animals per group was, the more likely it was that the species was unidentified (possibly because it was harder to identify the animal with only a few individuals being present).
Discussion
Marine Protected Areas (MPAs) can be a tool to conserve marine ecosystems as well as provide economic growth to local communities (Abdulla et al., 2009). To be effective for cetaceans MPAs need to be adequately designed, which includes the identification of areas suitable for multi-use and the exclusion of potentially harmful human activities. It is also very important to monitor changes over time, assess the effectiveness of conservation actions and be ready to adapt them when required (Hooker and Gerber, 2004).
Informed decision making within the MPA depends on reliable scientific data. Obtaining this for cetaceans can be challenging, but in some areas comprehensive research programs are in place [e.g., Stellwagen Bank in the United States (NOAA, 2010)]. In many MPAs this type of rigorous monitoring cannot be followed due to logistical or financial constraints and alternative approaches are needed. In the following we discuss the use of platforms of opportunity in WNP: the data obtained, challenges encountered as well as the opportunities this low-cost method provides to collect the valuable information on species occurrence needed to inform management decisions.
Cetacean Diversity
Information on cetacean species around Indonesia in the past has been primarily based on strandings (Branch et al., 2007; Mustika et al., 2009) and incidental sightings (Rudolph et al., 1997). Only recently, cetacean monitoring programs have been conducted in several sites in Indonesia, greatly increasing our knowledge on cetacean diversity. The numbers of species identified were 22 in Papua, 27 in East Kalimantan and 28 for wider Lesser Sunda (Kreb, 2004; Mustika, 2006; Ender et al., 2014; Putra et al., 2017). For Wakatobi waters the limited multi-species studies on this taxonomic group are only available in gray literature. This study is the first to provide important baseline information on the ecology and the community patterns of cetaceans. Eleven cetaceans were positively identified at species level representing 32% of all cetacean species recorded in Indonesia (Mustika et al., 2015b). These include species featured in the International Union for Conservation of Nature (IUCN) Red List of Threatened Species (International Union for Conservation of Nature (IUCN), 2020) as Endangered (blue whale, Balaenoptera musculus), and Vulnerable (sperm whale, Physeter macrocephalus). Almost two thirds of the identified species are listed as Least Concern or Data Deficient, the last category making it difficult to assess their population status.
Wakatobi National Park has a high habitat diversity which is reflected in the large number of species recorded. This finding highlights the important role of Wakatobi waters as a regional reservoir of cetacean diversity. Throughout the study period (from 2004 to 2012) 90% of the species had been identified within the first 5 years indicating that even with the non-systematic coverage, the most prevalent and possibly resident species were detected early in the study. As the majority of sightings (62.6%) were recorded as unidentified dolphin or whale species, there are probably still a number of undetected species. Even during dedicated surveys, identification rates for small cetaceans can be below 50% (Di Tullio et al., 2016). This can be improved by training of observers in species identification and taking photographs of the sightings.
Sighting Frequency
Assuming that survey effort is roughly similar between surveys, the sighting frequencies can provide a long-term measure of occurrence and changes for a study area. These results tend to be more quantifiable than studies that only use incidental sightings with no associated effort data (Evans and Hammond, 2004), or are based on perceived trends of cetacean abundance reported by fishermen (Maynou et al., 2011).
The sighting frequency in Wakatobi was about tenfold lower for large cetaceans (0.25 sightings per day) than for small cetaceans (2.25–4.33 sightings per day). A similar relationship was found in the Halmahera Sea and the Pacific Ocean part of North Papua with 0.016 sightings/km for small cetaceans (25 sightings) and 0.003 for large cetaceans (five sperm whale sightings) (Borsa and Nugroho, 2010). Large whale encounters primarily consist of sperm whales and these occur almost exclusively in deep water habitats. The sighting probability is linked to the coverage of potential sperm whale habitat, which as stated earlier is quite well accessible in Wakatobi waters.
In this study, sighting frequencies were used for a subset of the data which allowed the investigation of temporal changes in cetacean occurrence between seasons and years for Wakatobi waters. The reduced number of records made it necessary to pool all sightings into either the category small or large cetacean. The sighting frequency for both small and large cetaceans, combined for the years 2004 to 2012, indicated a bimodal distribution with peaks in the two transition seasons, September to November and March. There are a number of possible reasons for the observed patterns. Weather conditions are calmer during the inter-monsoonal season than in the generally much rougher SE and SW monsoons (Pet-Soede and Erdmann, 2003). As vessels generally only went out at sea to around sea states of Beaufort <4 the rougher seas should not have a large impact on sighting probability. However, for smaller groups of animals or those that are only visible for short times, the chance that an observer sees them will be reduced as soon as white-caps occur (Beaufort 3) (Barlow, 2015). This is in particular true for cryptic species such as beaked whales that occur in solitude or in small group sizes and are difficult to spot (and identify) even under good sighting conditions. For species that occur in large groups, approach vessels for bow riding and show active surface behavior, such as spinner dolphins, the sighting probability would likely not change within this range.
The pooling of all species into either the category small or large cetaceans makes it impossible to determine in what way changes in distribution of different species within each category, e.g., due to changes in prey availability, might influence the overall pattern. This circumstance highlights again the importance of having a higher number of identified sightings which would allow for the investigation of species specific changes in occurrence, both throughout the year and interannually.
Survey effort was lower in the last three monitoring years due to limited resources at the end of the monitoring program (Supplementary Figure S1). During those 3 years no large cetaceans were sighted (Figure 7A). This is most likely because the offshore area received less survey coverage, especially in the outer reefs where large cetaceans were seen more often than in main islands and south atolls (AS and PP, pers. obs.). For species sighted more rarely, such as large whales, a reduced effort can lead to no more animals being registered, thus making the calculation of sighting frequency impossible. Conversely, with the same survey effort around the much smaller inshore waters, the small cetacean density has increased in the last 3 years (Figure 7C). For common species that are also sighted in times of reduced effort, such as spinner and bottlenose dolphins, the sighting frequency is likely a robust measure of occurrence.
Without further study though, it cannot be excluded that a decrease in number of sightings could also be related to depletion of the populations (Amir et al., 2012) or a change in distribution. It is important to use similar temporal and spatial coverage between years, even when using platforms of opportunity. The availability of abundance indices such as sightings per km or hour (rather than sightings per day, as used here) would also provide more refined insights into seasonality of cetacean presence in the study area.
Spatio-Temporal Occurrence Patterns
The complex Wakatobi ecosystem attracts and supports a variety of cetacean species, because Wakatobi is located in the Indonesian tropical upwelling system, where oceanic currents strongly stimulate primary productivity (Drushka et al., 2010; Steinke et al., 2014). In addition, the narrow and very steep continental shelf provides deep waters close to the shore, and the presence of submarine features around the coastline contributes to upwelling, thus further enhancing the productivity of the waters. The local depth and seabed configuration (Pikesley et al., 2012) in combination with oceanographic processes (Tynan et al., 2005) are associated with aggregated cetacean prey species (Bearzi et al., 2008).
Typically spinner dolphin, bottlenose dolphin, and melon-headed whale were observed in the vicinity of fringing reefs around the coastline, atolls and small islands. Spinner dolphin populations are known to occur in island and archipelago habitats and are often observed moving between coastal and oceanic habitats (Benoit-Bird and Au, 2003; Dolar et al., 2006; Borsa and Nugroho, 2010; Ponnampalam, 2012). Bottlenose dolphins in the inshore area may have been Tursiops aduncus, while those observed offshore may have been Tursiops truncatus. These species are very difficult to distinguish at sea, in particular if they are not approached and/or photographed. Consequently, both species were recorded as bottlenose dolphin (Tursiops spp.). Bottlenose dolphins are known to form stable social groups, sometimes with small resident populations that have a high affiliation to a relatively small area, likely linked to high prey availability and low predation risk (Shirakihara et al., 2002; Dulau et al., 2017; Passadore et al., 2018a; Haughey et al., 2020). In Wakatobi bottlenose dolphins occur wide-spread in the area on a regular basis, thus residency for at least some of these animals is likely. World-wide bottlenose dolphin populations can be genetically distinct at small spatial scales, which is highly relevant for any conservation efforts (Chen et al., 2017). The use of photographs of the dorsal fin of individual animals, as well as sampling of tissue for genetic analysis, could provide more insight into this.
Sperm whales were abundant in the vicinity of the submarine trough-like features between major landmasses (Pet-Soede and Erdmann, 2003) in the east part of the main islands bordering the outer reefs, and in the deep waters in the north of the main islands. This is to be expected as they feed mainly on mesopelagic squid and fish around the shelf edge (Whitehead, 2009). Baleen whale sightings were comparatively rare, with Bryde’s whales being sighted in one occasion. In contrast to other baleen whales, Bryde’s whales do not conduct long-distance migrations, instead remaining in tropical and warm temperate waters all year (Kato and Perrin, 2009). They likely conduct movements to areas where breeding occurs, however, the general knowledge on the behavior of this species is still poor (Kato and Perrin, 2009). Sightings around Wakatabi could indicate animals using this area on a regular basis, but further data are needed to confirm this.
Spinner and bottlenose dolphins occurred in Wakatobi waters 75 and 83% of the year, respectively. This is in line with the results from Bird Head Seascape-Papua where spinner dolphins occurred during 92% of the year and bottlenose dolphins were seen 100% of the time (Ender et al., 2014). In Solor-Lesser Sunda, spinner dolphins were also sighted almost continuously around the year (92%), but bottlenose dolphins less so (58%) (Putra et al., 2017). Understanding the regional differences in the residency of these two species requires more designated research, including an improved identification of the two bottlenose dolphin species. Sperm whale occurred in Wakatobi waters 50% of the year round, comparable with the occurrence in Bird Head Seascape-Papua (58%) (Ender et al., 2014) and was higher than that in Solor-Lesser Sunda (33%) (Putra et al., 2017). Sperm whale females, calves and young males have been known to stay in the warmer waters of lower latitudes (Whitehead, 2009). Adult males are thought to move between colder and warmer waters, although their seasonal migration routes are still not well understood. An analysis of historical whaling data indicate that they likely occurred year-round in Indonesian waters and in some areas showed a strong site fidelity (Sahri et al., 2020b). Melon-headed whale occurrence in Wakatobi was higher (58%) than that in Solor-Lesser Sunda (17%) (Putra et al., 2017). Just as sperm whales, this species tends to generally occur in deep offshore waters (Perryman and Danil, 2018). They are also sighted around island groups, examples in the Indian Ocean are the Comoros Archipelago, the Seychelles, the Maldives, and Sri Lanka (Leatherwood et al., 1991; Ballance et al., 2001; Kiszka et al., 2007a, 2010). A number of studies indicate that melon-headed whales around oceanic islands rest inshore during the day and move offshore during the night, likely following their prey (Brownell et al., 2009). This is similar to what is reported for spinner dolphins (Thorne et al., 2012), but for either species information on their detailed habitat use in Wakatobi is still lacking.
Only in July, each of three sightings of unidentified dolphins occurred in 2006, 2007, and 2010, much less than in other months. This could be related to the very rough Wakatobi waters in July in the middle of the SE monsoon limiting survey efforts (Figure 2 and Supplementary Figure S1). While one would in general assume that the productivity in the area was high during the summer, it could also be that this was not the case. There are a number of complex interactions, and in addition human activities on land, leading to a high input of nutrients, and the change in temperature due to climate change, leading to a more stable stratified layer and less upwelling (Chang et al., 2019). Monitoring of the physical processes, productivity as well as the occurrence of top predators would help to achieve a better understanding of the relationship between these factors in Wakatobi waters. Consideration of cetacean monitoring technologies that can also function well during the rough season, such as stationary passive acoustic devices, can clarify this issue (André et al., 2011; Anderson et al., 2012a).
Behaviors, Mother-Calf Pair Presence, and Cetacean-Fishing Vessel Interaction
Data on cetacean behavior and group composition can help recognize areas important in their life cycle. Disruption of behaviors can increase the energy expenditure of individuals and potentially negatively impact their overall fitness and reproductive success (e.g., New et al., 2014; Christiansen and Lusseau, 2015). As an example, the presence of calves and the display of courtship behavior help to identify reproduction grounds for migrating whales (e.g., Scheidat et al., 2000; Johnston et al., 2007). For some species preferred areas for resting and feeding can be identified, allowing protective measures to be taken (Hooker et al., 2011; Tyne et al., 2015; Bejder et al., 2019).
Foraging behavior of spinner dolphins in Wakatobi occurred in areas with a water depth of around −230 m. This is similar to the Sulu sea were they primarily feed on mesopelagic fishes in depths of −200 to −400 m as well as squid and crustaceans (Dolar et al., 2003). This species has been documented to follow the vertical movement of its prey (Benoit-Bird and Au, 2003; Torres and Read, 2009) as well as to follow horizontal prey migrations between coastal and oceanic habitats (Benoit-Bird and Au, 2003; Dolar et al., 2006; Ponnampalam, 2012). There is no information available on what kind of prey spinner dolphins feed on in Wakatobi, thus how it influences their habitat choice remains to be investigated. Bottlenose dolphins foraged in areas with shallower depths around −60 m, which could reflect a specialization of different depth preferences between the two species related to physiological traits or to avoid prey competition.
Out of three sperm whales with recorded behaviors in our dataset, two of them were resting. Resting behavior in large whales such as the sperm whales (Amano and Yoshioka, 2003; Miller et al., 2008) needs to be considered in the WNP spatial planning due to the possible risk of collision (Frantzis et al., 2019) with ships that are using the same area. In addition to the aforementioned need for increased skills for species identification, the identification of species behavior is also needed for future data collection. The presence of some cetacean mother-calf pairs suggest that the WNP provides nursery and calving grounds for several cetacean species.
Some of the small cetacean species are gregarious by nature. The largest group of cetaceans sighted during these surveys comprised of an estimated 200 individuals of spinner dolphins, in line with other studies reporting large groups of up to 500 (De Vos et al., 2012) or even 1000 individuals (Gore et al., 2012). Spinner dolphins are also known to show impressive surface behavior, such as their “spinning” (Würsig and Whitehead, 2009), making them highly visible. Two other species that were seen in groups of more than 100 individuals are melon-headed whale and bottlenose dolphin. Both spinner and bottlenose dolphins frequently approached vessels for bow riding. These charismatic and abundant species could potentially be the basis for ecotourism activities. Cetacean-watching can have great value if conducted in a responsible manner to avoid negative impacts on the animals (Mustika et al., 2015a). Generating economic value for local inhabitants will help to motivate them to protect the marine communities.
During the surveys, skipjack tuna (Katsuwonus pelamis) were spotted at the surface exclusively around fishing vessels and fish aggregating devices (FADs), subsequently attracting small cetaceans (AS, pers. obs.). Dolphins tend to aggregate in such areas where their main prey occurs to increase their feeding success rate (López et al., 2004). Fishermen in Wakatobi even use the presence of small cetaceans (mainly spinner and bottlenose dolphins) to locate the schools of yellowfin tuna (AS, pers. obs.) as has been described for other areas (Anderson, 2005; Anderson et al., 2012b). The co-occurrence between cetaceans and fishing activities increases the risk for cetacean entanglement and drowning (Whitty, 2015). Reeves et al. (2003) suggested that local declines in small cetaceans are mostly due to increased intensification of fisheries and vessel activities. In addition, the co-occurrence with fishing activities may cause fish stock depletion for the cetaceans (Gore et al., 2012).
Limitations of Using Data From Platforms of Opportunity
The data collected with platforms of opportunity during this study come with some limitations that need to be considered when interpreting the information. One of the main challenges is the variable adequate temporal and spatial coverage of the study area.
Some platforms of opportunity, such as ferries, provide regular sampling opportunity over times, but their spatial coverage is limited. Other vessels, such as those used for whale-watching, focus on areas known for their high cetacean density to increase the chance of sightings. This shortcoming in representative coverage of an area can be addressed by using spatial or habitat suitability models (Hedley and Buckland, 2004; Kesner-Reyes et al., 2012). In our study the spatial effort could only be approximated as GPS tracks were not collected making it difficult to ascertain if survey coverage was similar between months or years. This means that there is a chance that the observed spatial patterns may reflect the distribution and abundance of the vessel effort rather than that of the animals.
The sighting probability for cetaceans is influenced by a number of known and unknown parameters. Our surveys varied in observation height, vessel speed, number of observers, search methods and observer experience. Weather conditions can also influence sighting probability, but as vessels did not go out in sea states of Beaufort >4, sighting conditions were relatively comparable between surveys. Ideally the impact of all (known) factors potentially influencing sighting probability are quantified and considered in the analyses (Evans and Hammond, 2004; Buckland et al., 2005; Barlow, 2015). In reality this is often not feasible. In our study we could only calculate a simple sighting frequency per surveyed day used, likely leading to unquantified bias in the results.
Due to the lack of GPS tracks, sighting frequency could not be reported as the number of sightings per km or per hours surveyed, as is commonly done (Alves et al., 2018). Instead effort was recorded as days surveyed and the sighting frequency is reported as “sightings per day” (e.g., Pérez-Vallazza et al., 2008). Assuming that sighting records are obtained throughout the study area, the results can still provide a good qualitative indication of the distribution and abundance of animals (Berrow et al., 1996). In our study, this assumption was made for a subset of data, i.e., mainly the fishery monitoring surveys, where more consistent information on spatial coverage was available.
Even considering these caveats, the data collected during the non-systematic surveys enabled the construction of a positively identified species list and a first indication of the cetacean population status and relative density. Although interpretation of non-systematically collected data is difficult without measure of effort (Evans and Hammond, 2004), with stringent data filtering and quality control, valuable information can be obtained (Pikesley et al., 2012).
Implications for Marine Park Management
Knowledge of cetacean population presence and ecology is fundamental for formulating conservation policy (Reid et al., 2003) and an effective policy depends on understanding relationships between species, habitats and anthropogenic interactions (Cañadas and Hammond, 2008). One of the most important approaches to marine conservation is the establishment of MPAs (Cañadas et al., 2005). When managed well, MPAs designed for top predators as umbrella species are highly effective, resulting in higher biodiversity and more ecosystem benefits (Sergio et al., 2008). To identify areas of particular importance for specific species, baseline knowledge on the presence of cetaceans is needed (Panigada et al., 2008). The approach and findings derived from the platform of opportunity surveys can support the WNP Authority in their management of cetaceans within the MPA.
Wakatobi National Park was established with multiple-use zoning system, including two no-use zones (core and marine protected zones) and three use zones (tourism, local use, general use zones) (WNP Authority, 2008). Only ∼3% of the total WNP area falls under the no-use zone, and this mainly concerns more sedentary coastal and marine ecosystems such as coral reefs, seagrass beds, mangrove, fish spawning aggregation sites and turtle and seabird nesting sites (WNP Authority, 2008). Actually no sightings were found in the core zone of the WNP and >90% of small cetacean sightings and >60% of large cetacean sightings occurred in the use zones. This is a crucial finding that indicates the mismatch between WNP design and the ecological needs of the cetaceans.
The use zones are commonly highly used corridors by humans with traditional fishing, recreational activities and shipping taking place (Figures 3, 4) (Read, 2008; Howes et al., 2012). The potential adverse impact of these human activities on cetaceans can be addressed by setting and enforcing stricter rules such as only applying cetacean-friendly fishing gear, restricting vessel speeds and developing responsible ecotourism. The WNP Authority has set rules on fishing gear that is allowed to be used within the WNP (WNP Authority, 2008), however no such a “code of conduct” is available yet for whale and dolphin watching tourism, even under the national legislation (Sahri et al., 2020a).
Improved information on behavior and the spatial and temporal occurrence of cetacean species is urgently needed in WNP to inform the future management of specific threats to cetaceans and to identify appropriate areas for MPAs (Cañadas et al., 2005; Gómez De Segura et al., 2006). When cetaceans frequently use an MPA, cetacean conservation issues need to be included in the MPA management plan (Cañadas and Hammond, 2008; Dulau-Drouot et al., 2008). Information on cetacean ecology should be used to adjust the existing zoning system as an important step in balancing the needs of local users and those of protected species. Adjusting zoning designation of areas where threatening human activities significantly overlap with important cetacean habitat can contribute effectively to the species’ conservation (Silva et al., 2012).
Large whales, especially sperm whales, occurred in the use zones as well as outside the WNP boundaries. The latter areas do not have any regulations in place to manage potential threats to cetaceans. MPAs that are predominantly designed for protection of coastal habitats and to support sustainable local fisheries may have little effect in protecting highly mobile cetaceans (Dinis et al., 2016). Designing protected areas for specific species requires knowledge of their spatio-temporal distribution and habitat requirements, in order to adjust the size of the management area to their ecological needs (Silva et al., 2012). Both an adequate management regime (Howes et al., 2012) and MPA range expansion are needed, since the mobile animals usually have ranges that go outside of a single MPA (Wilson et al., 2004; Dinis et al., 2016). An MPA network may be needed to truly protect these highly mobile species (Hooker et al., 2011). The possible connectivity between the Wakatobi cetaceans and those of the Flores and Banda Seas need further investigation to strengthen the cetacean conservation in the central and eastern waters of Indonesia. These areas have recently been recognized to be important for conservation by an ongoing international research and conservation initiative, named Important Marine Mammal Areas (IMMAs) (IUCN-MMPATF, 2019). This recognition highlights the need for protecting this unique and vulnerable area through the adoption of substantial management measures informed by scientific evidence. Information obtained from this study can also help inform national and local governments with data for cetacean species with different status from Data Deficient to Endangered under the IUCN Red List of Threatened Species (International Union for Conservation of Nature (IUCN), 2020). Distribution and species diversity data, for instance, are recognized as critical for managing cetaceans in Indonesia (Ender et al., 2014).
We show that non-systematic low-cost survey data are a valuable information source in data-poor situations and where funding is limited. Relative occurrence, such as a sighting rate, if collected appropriately, is an adequate method for long-term monitoring and can provide the information needed to support improved park management and conservation planning. Some of the caveats that were identified during data collection can be easily addressed, such as the improvement of effort data by recording of GPS tracks and the collection of photographs for species identification. Recent software developments can facilitate data collection during non-systematic surveys and could be applied in WNP (Currie et al., 2018a, 2017). Data analysis and inferences based on non-systematic surveys need to take the limitations of the method into account. Where cetacean studies or wildlife-based ecotourism are just beginning, non-systematic surveys and collection of opportunistic sightings can provide enough information on animal occurrence that it can inform the kind of future studies that might be needed. We recommend that data collected from non-systematic, opportunistic, or incidental based projects be published to strengthen the value of volunteer efforts (Theobald et al., 2015) and to maximize the benefit of such efforts for science and management (Pirotta et al., 2019). When funds are available, designated surveys should be considered to obtain more accurate estimates of cetacean density and habitat use. Localized studies of cetacean species focusing on residence patterns, genetic structure, and population impacts arising from interactions with other anthropogenic threats, such as marine traffic, should yield additional information for management strategies at the local level.
This study showed the importance of the WNP for cetaceans and the necessity to obtain reliable scientific data to adequately manage this area based on validated instead of assumed presence and migration routes. The use of platforms of opportunity provided first information on areas that are especially important to cetacean species and where conflict with human use might occur. The current survey approach can easily be adapted to collect improved data and it can also be used to inform future survey designs. Until more information on cetacean habitat use in the Wakatobi waters is available we advise to consider protecting currently unprotected cetacean key-habitats as revealed by this study, and setting stricter regulations for human activities in the current use zones during future WNP rezoning processes.
Data Availability Statement
The data analyzed in this study are subject to the following licenses/restrictions: The data were obtained through a data sharing agreement from The Nature Conservancy (TNC) Indonesia and therefore are not publicly accessible. Requests to access these datasets should be directed to the corresponding author.
Author Contributions
AS, PM, AM, and MS conceived the ideas. AS and PP collected the data. AS, MS, and PM analyzed the data. AS, AM, and MS led the writing. All authors discussed the results and commented on the manuscript.
Funding
This study was financially supported by the Indonesia Endowment Fund for Education (LPDP) Scholarship from Ministry of Finance of Indonesia to AS [Contract Number: PRJ-482/LPDP.3/2017].
Conflict of Interest
AS and PP were employed as monitoring coordinators by The Nature Conservancy (TNC) Indonesia to conduct sighting data collection.
The remaining authors declare that the research was conducted in the absence of any commercial or financial relationships that could be construed as a potential conflict of interest.
Acknowledgments
The cetacean data were collected by the Wakatobi National Park Authority and the Joint Program of The Nature Conservancy (TNC) Indonesia and WWF Indonesia. Authors would like to thank all Wakatobi National Park staff, Wakatobi District Government staff, speedboat captains and crews, monitoring staff, all volunteers who collected data in the field and especially Yusuf Fajariyanto for the data sharing agreement. The authors would like to thank the Indonesia Endowment Fund for Education (LPDP) Scholarship from the Ministry of Finance of Indonesia for financially supporting this study. The authors would like to thank Debby Barbé for the preliminary work she performed for this study and the reviewers who helped to improve the quality of the manuscript.
Supplementary Material
The Supplementary Material for this article can be found online at: https://www.frontiersin.org/articles/10.3389/fmars.2020.569936/full#supplementary-material
Footnotes
References
Abdulla, A., Gomei, M., Hyrenbach, D., Notarbartolo-Di-Sciara, G., and Agardy, T. (2009). Challenges facing a network of representative marine protected areas in the Mediterranean: prioritizing the protection of underrepresented habitats. ICES J. Mar. Sci. 66, 22–28. doi: 10.1093/icesjms/fsn164
Allen, B. M., Brownell, R. L. Jr., and Meade, J. (2011). Species review of Cuvier’s beaked whale, Ziphius cavirostris SC/63/SM17. Int. Whal. Comm. Sci. Meet. 63, 1–8.
Alves, F., Ferreira, R., Fernandes, M., Halicka, Z., Dias, L., and Dinis, A. (2018). Analysis of occurrence patterns and biological factors of cetaceans based on long-term and fine-scale data from platforms of opportunity: Madeira Island as a case study. Mar. Ecol. 39:e12499. doi: 10.1111/maec.12499
Amano, M., and Yoshioka, M. (2003). Sperm whale diving behavior monitored using a suction-cup-attached TDR tag. Mar. Ecol. Prog. Ser. 258, 291–295. doi: 10.3354/meps258291
Amir, O. A., Berggren, P., and Jiddawi, N. S. (2012). Recent records of marine mammals in Tanzanian waters. J. Cetacean Res. Manag. 12, 249–253.
Anderson, R. C. (2005). Observations of cetaceans in the Maldives, 1990-2002. J. Cetacean Res. Manag. 7, 119–135.
Anderson, R. C., Branch, T. A., Alagiyawadu, A., Baldwin, R., and Marsac, F. (2012a). Seasonal distribution, movements and taxonomie status of blue whales (Balaenoptera musculus) in the northern Indian Ocean. J. Cetacean Res. Manag. 12, 203–218.
Anderson, R. C., Sattar, S. A., and Shiham Adam, M. (2012b). Cetaceans in the maldives: a review. J. Cetacean Res. Manag. 12, 219–225.
Anderwald, P., Brandecker, A., Coleman, M., Collins, C., Denniston, H., Haberlin, M. D., et al. (2013). Displacement responses of a mysticete, an odontocete, and a phocid seal to construction related vessel traffic. Endanger. Species Res. 21, 231–240. doi: 10.3354/esr00523
André, M., van der Schaar, M., Zaugg, S., Houégnigan, L., Sánchez, A. M., and Castell, J. V. (2011). Listening to the Deep: live monitoring of ocean noise and cetacean acoustic signals. Mar. Pollut. Bull. 63, 18–26. doi: 10.1016/j.marpolbul.2011.04.038
Arcangeli, A., Marini, L., and Crosti, R. (2013). Changes in cetacean presence, relative abundance and distribution over 20 years along a trans-regional fixed line transect in the Central Tyrrhenian Sea. Mar. Ecol. 34, 112–121. doi: 10.1111/maec.12006
Baird, R. W., Gorgone, A. M., McSweeney, D. J., Ligon, A. D., Deakos, M. H., Webster, D. L., et al. (2009). Population structure of island-associated dolphins: evidence from photo-identification of common bottlenose dolphins (Tursiops truncatus) in the main Hawaiian Islands. Mar. Mammal Sci. 25, 251–274. doi: 10.1111/j.1748-7692.2008.00257.x
Ballance, L. T., Anderson, R. C., Pitman, R., Stafford, K., Shaan, A., Waheed, Z., et al. (2001). Cetacean sightings around the Republic of the Maledives, April 1998. J. Cetacean Res. Manag. 3, 213–218.
Barlow, J. (2015). Inferring trackline detection probabilities, g(0), for cetaceans from apparent densities in different survey conditions. Mar. Mammal Sci. 31, 923–943. doi: 10.1111/mms.12205
Bartholomew, A., Diaz, R. J., and Cicchetti, G. (2000). New dimensionless indices of structural habitat complexity: predicted and actual effects on a predator’s foraging success. Mar. Ecol. Prog. Ser. 206, 45–58. doi: 10.3354/meps206045
Bearzi, G., Agazzi, S., Bonizzoni, S., Costa, M., and Azzellino, A. (2008). Dolphins in a bottle: abundance, residency patterns and conservation of bottlenose dolphins Tursiops truncatus in the semi-closed eutrophic Amvrakikos Gulf Greece. Aquat. Conserv. Mar. Freshw. Ecosyst. 18, 130–146. doi: 10.1002/aqc.843
Bejder, L., Videsen, S., Hermannsen, L., Simon, M., Hanf, D., and Madsen, P. T. (2019). Low energy expenditure and resting behaviour of humpback whale mother-calf pairs highlights conservation importance of sheltered breeding areas. Sci. Rep. 9:771. doi: 10.1038/s41598-018-36870-7
Benoit-Bird, K. J., and Au, W. W. L. (2003). Prey dynamics affect foraging by a pelagic predator (Stenella longirostris) over a range of spatial and temporal scales. Behav. Ecol. Sociobiol. 53, 364–373. doi: 10.1007/s00265-003-0585-4
Berrow, S. D., Holmes, B., and Kiely, O. R. (1996). Distribution and abundance of bottle-nosed Dolphins Tursiops Truncatus (Montagu) in the Shannon Estuary. Biol. Environ. 96, 1–9. doi: 10.1016/S0967-0653(98)80578-4
Block, B. A., Jonsen, I. D., Jorgensen, S. J., Winship, A. J., Shaffer, S. A., Bograd, S. J., et al. (2011). Tracking apex marine predator movements in a dynamic ocean. Nature 475, 86–90. doi: 10.1038/nature10082
Borsa, P., and Nugroho, D. A. (2010). Spinner dolphin (Stenella longirostris) and other cetaceans in Raja Ampat waters, West Papua. Mar. Biodivers. Rec. 3:e49. doi: 10.1017/s175526721000045x
Branch, T. A., Stafford, K. M., Palacios, D. M., Allison, C., Bannister, J. L., Burton, C. L. K., et al. (2007). Past and present distribution, densities and movements of blue whales Balaenoptera musculus in the Southern Hemisphere and northern Indian Ocean. Mamm. Rev. 37, 116–175. doi: 10.1111/j.1365-2907.2007.00106.x
Brownell, R. L., Ralls, K., Baumann-Pickering, S., and Poole, M. M. (2009). Behavior of melon-headed whales, Peponocephala electra, near oceanic islands. Mar. Mammal Sci. 25, 639–658. doi: 10.1111/j.1748-7692.2009.00281.x
Buckland, S. T., Anderson, D. R., Burnham, K. P., and Laake, J. L. (2005). “Distance Sampling,” in Encyclopedia of Biostatistics, eds P. Armitage and T. Colton (Hoboken, NJ: John Wiley & Sons, Ltd).
Buckland, S. T., Anderson, D. R., Burnham, K. P., Laake, J. L., Borchers, D. L., and Thomas, L. (2001). Introduction to Distance Sampling. Oxford: Oxford University Press.
Cañadas, A., and Hammond, P. S. (2008). Abundance and habitat preferences of the short-beaked common dolphin Delphinus delphis in the southwestern Mediterranean: implications for conservation. Endanger. Species Res. 4, 309–331. doi: 10.3354/esr00073
Cañadas, A., Sagarminaga, R., De Stephanis, R., Urquiola, E., and Hammond, P. S. (2005). Habitat preference modelling as a conservation tool: proposals for marine protected areas for cetaceans in southern Spanish waters. Aquat. Conserv. Mar. Freshw. Ecosyst. 15, 495–521. doi: 10.1002/aqc.689
Chang, C. W. J., Hsu, H. H., Cheah, W., Tseng, W. L., and Jiang, L. C. (2019). Madden–julian oscillation enhances phytoplankton biomass in the maritime continent. Sci. Rep. 9:5421. doi: 10.1038/s41598-019-41889-5
Chen, I., Nishida, S., Yang, W. C., Isobe, T., Tajima, Y., and Hoelzel, A. R. (2017). Genetic diversity of bottlenose dolphin (Tursiops sp.) populations in the western North Pacific and the conservation implications. Mar. Biol. 164:202. doi: 10.1007/s00227-017-3232-8
Christiansen, F., and Lusseau, D. (2015). Linking behavior to vital rates to measure the effects of non-lethal disturbance on wildlife. Conserv. Lett. 8, 424–431. doi: 10.1111/conl.12166
Currie, J. J., McCordic, J. A., Kaplun, S. M., Stack, S. H., and Kaufman, G. (2017). An Update on Whale & Dolphin Tracker, Application for Cetacean Data Collection & Long-Term Monitoring. Doc. SC/67a/WW/07. Schaffhausen: IWC Sci. Committee.
Currie, J. J., Stack, S. H., and Kaufman, G. D. (2018a). Conservation and education through ecotourism: using citizen science to monitor cetaceans in the four-island region of Maui, Hawaii. Tour. Mar. Environ. 13, 65–71. doi: 10.3727/154427318X15270394903273
Currie, J. J., Stack, S. H., McCordic, J. A., and Roberts, J. (2018b). Utilizing occupancy models and platforms-of-opportunity to assess area use of mother-calf humpback whales. Open J. Mar. Sci. 08, 276–292. doi: 10.4236/ojms.2018.82014
De Vos, A., Clark, R., Johnson, C., Johnson, G., Kerr, I., Payne, R., et al. (2012). Cetacean sightings and acoustic detections in the offshore waters of Sri Lanka: March-June 2003. J. Cetacean Res. Manag. 12, 185–193.
Di Tullio, J. C., Gandra, T. B. R., Zerbini, A. N., and Secchi, E. R. (2016). Diversity and distribution patterns of cetaceans in the subtropical Southwestern Atlantic outer continental shelf and slope. PLoS One 11:e0155841. doi: 10.1371/journal.pone.0155841
Dinis, A., Carvalho, A., Alves, F., Nicolau, C., Ribeiro, C., Kaufmann, M., et al. (2016). Spatial and temporal distribution of bottlenose dolphins, Tursiops truncatus, in the Madeira archipelago, NE Atlantic. Arqu. Life Mar. Sci. 33, 45–54.
Dolar, M. L. L., Perrin, W. F., Taylor, B. L., Kooyman, G. L., and Alava, M. N. R. (2006). Abundance and distributional ecology of cetaceans in the central Philippines. J. Cetacean Res. Manag. 8, 93–111.
Dolar, M. L. L., Walker, W. A., Kooyman, G. L., and Perrin, W. F. (2003). Comparative feeding ecology of spinner dolphins (Stenella longirostris) and Fraser’s dolphins (Lagenodelphis hosei) in the Sulu Sea. Mar. Mammal Sci. 19, 1–19. doi: 10.1111/j.1748-7692.2003.tb01089.x
Double, M. C., Andrews-Goff, V., Jenner, K. C. S., Jenner, M. N., Laverick, S. M., Branch, T. A., et al. (2014). Migratory movements of pygmy blue whales (Balaenoptera musculus brevicauda) between Australia and Indonesia as revealed by satellite telemetry. PLoS One 9:e93578. doi: 10.1371/journal.pone.0093578
Drushka, K., Sprintall, J., Gille, S. T., and Brodjonegoro, I. (2010). Vertical structure of Kelvin waves in the Indonesian throughflow exit passages. J. Phys. Oceanogr. 40, 1965–1987. doi: 10.1175/2010JPO4380.1
Dulau, V., Estrade, V., and Fayan, J. (2017). Identifying key demographic parameters of a small island-associated population of Indo-Pacific bottlenose dolphins (Reunion, Indian Ocean). PLoS One 12:e0179780. doi: 10.1371/journal.pone.0179780
Dulau-Drouot, V., Boucaud, V., and Rota, B. (2008). Cetacean diversity off la Réunion Island (France). J. Mar. Biol. Assoc. U.K. 88, 1263–1272. doi: 10.1017/S0025315408001069
Ender, A. I., Muhajir, Mangubhai, S., Wilson, J. R., Purwanto, and Muljadi, A. (2014). Cetaceans in the global centre of marine biodiversity. Mar. Biodivers. Rec. 7, 1–9. doi: 10.1017/S1755267214000207
Erbe, C., Marley, S. A., Schoeman, R. P., Smith, J. N., Trigg, L. E., and Embling, C. B. (2019). The effects of ship noise on marine mammals—a review. Front. Mar. Sci. 6:606. doi: 10.3389/fmars.2019.00606
Evans, P. G. H., and Hammond, P. S. (2004). Monitoring cetaceans in European waters. Mamm. Rev. 34, 131–156. doi: 10.1046/j.0305-1838.2003.00027.x
Field, A. (2013). Discovering statistics using IBM SPSS statistics. New York: SAGE Publications Ltd.
Frantzis, A., Leaper, R., Alexiadou, P., Prospathopoulos, A., and Lekkas, D. (2019). Shipping routes through core habitat of endangered sperm whales along the Hellenic Trench, Greece: can we reduce collision risks? PLoS One 14:e0212016. doi: 10.1371/journal.pone.0212016
Gómez De Segura, A., Crespo, E. A., Pedraza, S. N., Hammond, P. S., and Raga, J. A. (2006). Abundance of small cetaceans in waters of the central Spanish Mediterranean. Mar. Biol. 150, 149–160. doi: 10.1007/s00227-006-0334-0
Gore, M. A., Kiani, M. S., Ahmad, E., Hussain, B., Ormond, R. F., Siddiqui, J., et al. (2012). Occurrence of whales and dolphins in Pakistan with reference to fishers’ knowledge and impacts. J. Cetacean Res. Manag. 12, 235–247.
Green, A. L., and Mous, P. J. (2008). Delineating the Coral Triangle, its ecoregions and functional seascapes, Version 5.0. TNC Coral Triangle Program Report 1/08. Bali: TNC.
Hammond, P. S., Macleod, K., Berggren, P., Borchers, D. L., Burt, L., Cañadas, A., et al. (2013). Cetacean abundance and distribution in European Atlantic shelf waters to inform conservation and management. Biol. Conserv. 164, 107–122. doi: 10.1016/j.biocon.2013.04.010
Haughey, R., Hunt, T., Hanf, D., Rankin, R. W., and Parra, G. J. (2020). Photographic capture-recapture analysis reveals a large population of indo-pacific bottlenose Dolphins (Tursiops aduncus) with low site fidelity off the north west cape, Western Australia. Front. Mar. Sci. 6:781. doi: 10.3389/fmars.2019.00781
Hedley, S. L., and Buckland, S. T. (2004). Spatial models for line transect sampling. J. Agric. Biol. Environ. Stat. 9, 181–199. doi: 10.1198/1085711043578
Henderson, E. E., Smith, M. H., Gassmann, M., Wiggins, S. M., Douglas, A. B., and Hildebrand, J. A. (2014). Delphinid behavioral responses to incidental mid-frequency active sonar. J. Acoust. Soc. Am. 136, 2003–2014. doi: 10.1121/1.4895681
Hooker, S. K., Cañadas, A., Hyrenbach, K. D., Corrigan, C., Polovina, J. J., and Reeves, R. R. (2011). Making protected area networks effective for marine top predators. Endanger. Species Res. 13, 203–218. doi: 10.3354/esr00322
Hooker, S. K., and Gerber, L. R. (2004). Marine reserves as a tool for ecosystem-based management: the potential importance of megafauna. Bioscience 54, 27–39. doi: 10.1641/0006-3568(2004)054[0027:mraatf]2.0.co;2
Horton, T. W., Hauser, N., Zerbini, A. N., Francis, M. P., Domeier, M. L., Andriolo, A., et al. (2017). Route fidelity during marine megafauna migration. Front. Mar. Sci. 4:422. doi: 10.3389/fmars.2017.00422
Howes, L., Scarpaci, C., and Parsons, E. C. M. (2012). Ineffectiveness of a marine sanctuary zone to protect burrunan dolphins (Tursiops australis sp.nov.) from commercial tourism in Port Phillip Bay. Austral. J. Ecotour. 11, 188–201. doi: 10.1080/14724049.2012.713362
Huffard, C. L., Erdmann, M. V., and Gunawan, T. (2012). Geographic Priorities for Marine Biodiversity Conservation in Indonesia. Jakarta: Ministry of Marine Affairs and Fisheries and Marine Protected Areas Governance Program.
International Union for Conservation of Nature (IUCN) (2020). The IUCN Red List of Threatened Species [WWW Document]. Available online at: https://www.iucnredlist.org/ (accessed February 2, 2020).
Irvine, L. M., Mate, B. R., Winsor, M. H., Palacios, D. M., Bograd, S. J., Costa, D. P., et al. (2014). Spatial and temporal occurrence of blue whales off the U.S. West Coast, with implications for management. PLoS One 9:e102959. doi: 10.1371/journal.pone.0102959
IUCN-MMPATF (2019). Important Marine Mammal Area Regional Workshop for the North East Indian Ocean and South East Asian Seas: Final Report of the Third IMMA Workshop. Kota Kinabalu: IUCN Marine Mammal Protected Areas Task Force.
Johnston, D., Chapla, M., Williams, L., and Matthila, D. (2007). Identification of humpback whale Megaptera novaeangliae wintering habitat in the Northwestern Hawaiian Islands using spatial habitat modeling. Endanger. Species Res. 3, 249–257. doi: 10.3354/esr00049
Kato, H., and Perrin, W. F. (2009). “Bryde’s whales Balaenoptera edeni/brydei,” in Encyclopedia of Marine Mammals, eds W. F. Perrin, B. Würsig, and J. G. M. Thewissen (Amsterdam: Academic Press), 158–163.
Kesner-Reyes, K., Kaschner, K., Kullander, S., Garilao, C., Baril, J., and Froese, R. (2012). AquaMaps: Algorithm and Data Sources for Aquatic Organisms. FishBase. New York, NY: World Wide Web Electron.
Kiszka, J., Ersts, P., and Ridoux, V. (2007a). Cetacean diversity around the Mozambique Channel island of Mayotte (Comoros archipelago). J. Cetacean Res. Manag. 9, 105–109.
Kiszka, J., Macleod, K., Van Canneyt, O., Walker, D., and Ridoux, V. (2007b). Distribution, encounter rates, and habitat characteristics of toothed cetaceans in the Bay of Biscay and adjacent waters from platform-of-opportunity Data. ICES J. Mar. Sci. 64, 1033–1043. doi: 10.1093/icesjms/fsm067
Kiszka, J., Vely, M., and Breysse, O. (2010). Preliminary account of cetacean diversity and humpback whale (Megaptera novaeangliae) group characteristics around the Union of the Comoros (Mozambique Channel). Mammalia 74, 51–56. doi: 10.1515/MAMM.2010.003
Kreb, D. (2004). Facultative River Dolphins: Conservation and Social Ecology of Freshwater and Coastal Irrawaddy Dolphins in Indonesia. Amsterdam: Universiteit van Amsterdam.
Leatherwood, S., McDonald, D., Prematunga, W. P., Girton, P., Ilangakoon, A., and McBrearty, D. (1991). Records of the “Blackfish” (killer, false killer, pilot, pygmy killer and melon-headed whales) in the Indian Ocean,1772-1986. Cetaceans and Cetacean Research in the Indian Ocean Sanctuary. UNEP Marine Mammal Technical Report Number 3. Berkeley, CA: University of California, 33–65.
López, A., Pierce, G. J., Valeiras, X., Santos, M. B., and Guerra, A. (2004). Distribution patterns of small cetaceans in Galician waters. J. Mar. Biol. Assoc. U.K. 84, 283–294. doi: 10.1017/S0025315404009166h
MacLeod, C. D. (2009). Global climate change, range changes and potential implications for the conservation of marine cetaceans: a review and synthesis. Endanger. Species Res. 7, 125–136. doi: 10.3354/esr00197
MacLeod, C. D., Brereton, T., and Martin, C. (2009). Changes in the occurrence of common dolphins, striped dolphins and harbour porpoises in the English Channel and Bay of Biscay. J. Mar. Biol. Assoc. U.K. 89, 1059–1065. doi: 10.1017/S0025315408002828
Maynou, F., Sbrana, M., Sartor, P., Maravelias, C., Kavadas, S., Damalas, D., et al. (2011). Estimating trends of population decline in long-lived marine species in the mediterranean sea based on fishers’ perceptions. PLoS One 6:e21818. doi: 10.1371/journal.pone.0021818
Miller, P. J. O., Aoki, K., Rendell, L. E., and Amano, M. (2008). Stereotypical resting behavior of the sperm whale. Curr. Biol. 18, R21–R23. doi: 10.1016/j.cub.2007.11.003
Mustika, P. L. K. (2006). Marine Mammals in the Savu Sea (Indonesia): Indigenous Knowledge, Threat Analysis and Management Options. Australia: James Cook University.
Mustika, P. L. K., Birtles, A., Everingham, Y., and Marsh, H. (2015a). Evaluating the potential disturbance from dolphin watching in Lovina, north Bali, Indonesia. Mar. Mammal Sci. 31, 808–817. doi: 10.1111/mms.12188
Mustika, P. L. K., Madusari, C. C., Purnomo, F. S., Setiawan, A., Tjandra, K., and Prabowo, W. E. (2009). Whale strandings in Indonesia, including the first record of a humpback whale (Megaptera novaeangliae) in the Archipelago. Raffles Bull. Zool. 57, 199–206.
Mustika, P. L. K., Sadili, D., Sunuddin, A., Kreb, D., Sarmintohadi, R. I, Suprapti, D., et al. (2015b). Rencana Aksi Nasional Konservasi Cetacea Indonesia Periode I: 2016-2020, Direktorat Konservasi dan Keanekaragaman Hayati Laut, Ditjen Pengelolaan Ruang Laut, Kementerian Kelautan dan Perikanan Indonesia. Jakarta: University of Jakarta.
New, L. F., Clark, J. S., Costa, D. P., Fleishman, E., Hindell, M. A., Klanjšček, T., et al. (2014). Using short-term measures of behaviour to estimate long-term fitness of southern elephant seals. Mar. Ecol. Prog. Ser. 496, 99–108. doi: 10.3354/meps10547
NOAA (2010). Stellwagen Bank National Marine Sanctuary Final Management Plan and Environmental Assessment. Silver Spring, MD: NOAA.
Nowacek, D. P., Christiansen, F., Bejder, L., Goldbogen, J. A., and Friedlaender, A. S. (2016). Studying cetacean behaviour: new technological approaches and conservation applications. Anim. Behav. 120, 235–244. doi: 10.1016/j.anbehav.2016.07.019
Panigada, S., Zanardelli, M., MacKenzie, M., Donovan, C., Mélin, F., and Hammond, P. S. (2008). Modelling habitat preferences for fin whales and striped dolphins in the Pelagos Sanctuary (Western Mediterranean Sea) with physiographic and remote sensing variables. Remote Sens. Environ. 112, 3400–3412. doi: 10.1016/j.rse.2007.11.017
Passadore, C., Möller, L., Diaz-Aguirre, F., and Parra, G. J. (2018a). High site fidelity and restricted ranging patterns in southern Australian bottlenose dolphins. Ecol. Evol. 8, 242–256. doi: 10.1002/ece3.3674
Passadore, C., Möller, L. M., Diaz-Aguirre, F., and Parra, G. J. (2018b). Modelling dolphin distribution to inform future spatial conservation decisions in a marine protected area. Sci. Rep. 8, 1–14. doi: 10.1038/s41598-018-34095-2
Pennino, M. G., Arcangeli, A., Fonseca, V. P., Campana, I., Pierce, G. J., Rotta, A., et al. (2017). A spatially explicit risk assessment approach: cetaceans and marine traffic in the Pelagos Sanctuary (Mediterranean Sea). PLoS One 12:e0179686. doi: 10.1371/journal.pone.0179686
Pérez-Vallazza, C., Álvarez-Vázquez, R., Cardona, L., Pintado, C., and Hernández-Brito, J. (2008). Cetacean diversity at the west coast of La Palma Island (Canary Islands). J. Mar. Biol. Assoc. U.K. 88, 1289–1296. doi: 10.1017/S0025315408001239
Perryman, W. L., and Danil, K. (2018). “Melon-headed whale: Peponocephala electra,” in Encyclopedia of Marine Mammals (Third Edition), eds B. Würsig, J. G. M. Thewissen, and K. M. Kovacs (Houston: Gulf Professional Publishing), 593–595.
Pet-Soede, L., and Erdmann, M. (2003). Rapid Ecological Assessment Wakatobi National Park, TNC-WWF Join Program Wakatobi-Indonesia. Bali: TNC.
Pikesley, S. K., Witt, M. J., Hardy, T., Loveridge, J., Loveridge, J., Williams, R., et al. (2012). Cetacean sightings and strandings: evidence for spatial and temporal trends? J. Mar. Biol. Assoc. U.K. 92, 1809–1820. doi: 10.1017/S0025315411000464
Pirotta, V., Reynolds, W., Ross, G., Jonsen, I., Grech, A., Slip, D., et al. (2019). A citizen science approach to long-term monitoring of humpback whales (Megaptera novaeangliae) off Sydney, Australia. Mar. Mammal Sci. 36, 472–485. doi: 10.1111/mms.12651
Ponnampalam, L. S. (2012). Opportunistic observations on the distribution of cetaceans in the Malaysian South China, Sulu and Sulawesi seas and an updated checklist of marine mammals in Malaysia. Raffles Bull. Zool. 60, 221–231.
Putra, M. I. H., Topan, E., and Lewis, S. (2017). Technical report Marine Megafauna in Solor Waters, East Flores – East Nusa Tenggara, Indonesia 2016–2017 (in Bahasa Indonesia). (Indonesia: Misool Foundation, Savu Sea Program), 61.
Read, A. J. (2008). The looming crisis: interactions between marine mammals and fisheries. J. Mammal. 89, 541–548. doi: 10.1644/07-mamm-s-315r1.1
Redfern, J. V., Ferguson, M. C., Becker, E. A., Hyrenbach, K. D., Good, C., Barlow, J., et al. (2006). Techniques for cetacean - habitat modeling. Mar. Ecol. Prog. Ser. 310, 271–295. doi: 10.3354/meps310271
Reeves, R. R., McClellan, K., and Werner, T. B. (2013). Marine mammal bycatch in gillnet and other entangling net fisheries, 1990 to 2011. Endanger. Species Res. 20, 71–97. doi: 10.3354/esr00481
Reeves, R. R., Smith, B. D., Crespo, E. A., and Notarbartolo di Sciara, G. (2003). Dolphins, Whales and Porpoises: 2002–2010, Conservation Action Plan for the World’s Cetaceans. Gland: IUCN.
Reid, J. B., Reid, J. B., Evans, P. G. H., Evans, P. G. H., Northridge, S. P., and Northridge, S. P. (2003). Atlas of Cetacean distribution in north-west European waters. Jt. Nat. Conserv. Comm. 81, 117–127. doi: 10.1017/S0022149X07754718
Rosenbaum, H., and Collins, T. (2006). The ecology, population characteristics and conservation efforts for humpback whales (Megaptera novaeangliae) on their wintering grounds in the coastal waters of Gabon. Bull. Biol. Soc. Washingt. 12, 425–433.
Rudolph, P., Smeenk, C., and Leatherwood, S. (1997). Preliminary checklist of Cetacea in the Indonesian Archipelago and adjacent waters. Zool. Verh. 312, 1–48.
Sahri, A., Mustika, P. L. K., Dewanto, H. Y., and Murk, A. J. (2020a). A critical review of marine mammal governance and protection in Indonesia. Mar. Policy 117:103893. doi: 10.1016/j.marpol.2020.103893
Sahri, A., Putra, M. I. H., Mustika, P. L. K., and Murk, A. J. (2020b). A treasure from the past: former sperm whale distribution in Indonesian waters unveiled using distribution models and historical whaling data. J. Biogeogr. 47, 2102–2116. doi: 10.1111/jbi.13931
Scheidat, M., Castro, C., Denkinger, J., González, J., and Adelung, D. (2000). A breeding area for humpback whales (Megaptera novaeangliae) off Ecuador. J. Cetacean Res. Manag. 2, 165–172.
Sergio, F., Caro, T., Brown, D., Clucas, B., Hunter, J., Ketchum, J., et al. (2008). Top predators as conservation tools: ecological rationale, assumptions, and efficacy. Annu. Rev. Ecol. Evol. Syst. 39, 1–19. doi: 10.1146/annurev.ecolsys.39.110707.173545
Shirakihara, M., Shirakihara, K., Tomonaga, J., and Takatsuki, M. (2002). A resident population of Indo-Pacific bottlenose dolphins (Tursiops aduncus) in Amakusa, western Kyushu, Japan. Mar. Mammal Sci. 18, 30–41. doi: 10.1111/j.1748-7692.2002.tb01016.x
Silva, M. A., Prieto, R., Cascão, I., Seabra, M. I., Machete, M., Baumgartner, M. F., et al. (2014). Spatial and temporal distribution of cetaceans in the mid-Atlantic waters around the Azores. Mar. Biol. Res. 10, 123–137. doi: 10.1080/17451000.2013.793814
Silva, M. A., Prieto, R., Magalhães, S., Seabra, M. I., Machete, M., and Hammond, P. S. (2012). Incorporating information on bottlenose dolphin distribution into marine protected area design. Aquat. Conserv. Mar. Freshw. Ecosyst. 22, 122–133. doi: 10.1002/aqc.1243
Steinke, S., Prange, M., Feist, C., Groeneveld, J., and Mohtadi, M. (2014). Upwelling variability off southern Indonesia over the past two millennia. Geophys. Res. Lett. 41, 7684–7693. doi: 10.1002/2014GL061450
Tanabe, S. (2002). Contamination and toxic effects of persistent endocrine disrupters in marine mammals and birds. Mar. Pollut. Bull. 45, 69–77. doi: 10.1016/S0025-326X(02)00175-3
Theobald, E. J., Ettinger, A. K., Burgess, H. K., DeBey, L. B., Schmidt, N. R., Froehlich, H. E., et al. (2015). Global change and local solutions: tapping the unrealized potential of citizen science for biodiversity research. Biol. Conserv. 181, 236–244. doi: 10.1016/j.biocon.2014.10.021
Thorne, L. H., Johnston, D. W., Urban, D. L., Tyne, J., Bejder, L., Baird, R. W., et al. (2012). Predictive modeling of spinner dolphin (Stenella longirostris) resting habitat in the main Hawaiian Islands. PLoS One 7:e43167. doi: 10.1371/journal.pone.0043167
Torres, L. G., and Read, A. J. (2009). Where to catch a fish? the influence of foraging tactics on the ecology of bottlenose dolphins (Tursiops truncatus) in Florida Bay, Florida. Mar. Mammal Sci. 25, 797–815. doi: 10.1111/j.1748-7692.2009.00297.x
Townsend, C. H. (1935). The distribution of certain whales as shown by logbook records of American whaleships. Zoologica 19, 1–50. doi: 10.2307/j.ctvh9vv3t.4
Tynan, C. T., Ainley, D. G., Barth, J. A., Cowles, T. J., Pierce, S. D., and Spear, L. B. (2005). Cetacean distributions relative to ocean processes in the northern California Current System. Deep. Res. Part II Top. Stud. Oceanogr. 52, 145–167. doi: 10.1016/j.dsr2.2004.09.024
Tyne, J. A., Johnston, D. W., Rankin, R., Loneragan, N. R., and Bejder, L. (2015). The importance of spinner dolphin (Stenella longirostris) resting habitat: implications for management. J. Appl. Ecol. 52, 621–630. doi: 10.1111/1365-2664.12434
Venn-Watson, S., Colegrove, K. M., Litz, J., Kinsel, M., Terio, K., Saliki, J., et al. (2015). Adrenal gland and lung lesions in Gulf of Mexico common bottlenose dolphins (Tursiops truncatus) found dead following the Deepwater Horizon oil spill. PLoS One 10:e0126538. doi: 10.1371/journal.pone.0126538
Vinding, K., Bester, M., Kirkman, S. P., Chivell, W., and Elwen, S. H. (2015). The use of data from a platform of opportunity (whale watching) to study coastal cetaceans on the southwest coast of South Africa. Tour. Mar. Environ. 11, 33–54. doi: 10.3727/154427315X14398263718439
Whitehead, H. (2009). “Sperm Whale: Physeter macrocephalus,” in Encyclopedia of Marine Mammals, eds B. Würsig, J. G. M. Thewissen, and K. M. Kovacs (Houston: Gulf Professional Publishing), 1091–1097.
Whitty, T. S. (2015). Governance potential for cetacean bycatch mitigation in small-scale fisheries: a comparative assessment of four sites in Southeast Asia. Appl. Geogr. 59, 131–141. doi: 10.1016/j.apgeog.2015.01.003
Williams, R., Hedley, S. L., and Hammond, P. S. (2006). Modeling distribution and abundance of Antarctic baleen whales using ships of opportunity. Ecol. Soc. 11:1. doi: 10.5751/ES-01534-110101
Wilson, B., Reid, R. J., Grellier, K., Thompson, P. M., and Hammond, P. S. (2004). Considering the temporal when managing the spatial: a population range expansion impacts protected areas-based management for bottlenose dolphins. Anim. Conserv. 7, 331–338. doi: 10.1017/S1367943004001581
WNP Authority (2008). Management Plan of Wakatobi National Park 1998-2023 (Revision 2008). Baubau-Indonesia: Wakatobi National Park Authority.
Keywords: cetacean, Coral Triangle, platforms of opportunity, marine park management, spatio-temporal occurrence
Citation: Sahri A, Mustika PLK, Purwanto P, Murk AJ and Scheidat M (2020) Using Cost-Effective Surveys From Platforms of Opportunity to Assess Cetacean Occurrence Patterns for Marine Park Management in the Heart of the Coral Triangle. Front. Mar. Sci. 7:569936. doi: 10.3389/fmars.2020.569936
Received: 05 June 2020; Accepted: 30 September 2020;
Published: 21 October 2020.
Edited by:
Diego Horacio Rodriguez, Consejo Nacional de Investigaciones Científicas y Técnicas (CONICET), ArgentinaReviewed by:
Gail Schofield, Queen Mary University of London, United KingdomDavid Ainley, H.T. Harvey & Associates, United States
Copyright © 2020 Sahri, Mustika, Purwanto, Murk and Scheidat. This is an open-access article distributed under the terms of the Creative Commons Attribution License (CC BY). The use, distribution or reproduction in other forums is permitted, provided the original author(s) and the copyright owner(s) are credited and that the original publication in this journal is cited, in accordance with accepted academic practice. No use, distribution or reproduction is permitted which does not comply with these terms.
*Correspondence: Achmad Sahri, achmad.sahri@wur.nl