Article

The Effect of Kurzrasen and Strip-Grazing on Grassland Performance and Soil Quality of a Peat Meadow

1
Louis Bolk Institute, Kosterijland 3–5, 3981 AJ Bunnik, The Netherlands
2
Animal Nutirition, Wageningen University and Research, 6708 WD Wageningen, The Netherlands
3
Agrosystems Research, Wageningen Plant Research, 6708 PB Wageningen, The Netherlands
4
Animal Health & Welfare, Wageningen Livestock Research, 6708 WD Wageningen, The Netherlands
5
KTC Zegveld, Oude Meije 18, 3474 KM Zegveld, The Netherlands
*
Author to whom correspondence should be addressed.
Sustainability 2019, 11(22), 6283; https://doi.org/10.3390/su11226283
Submission received: 11 October 2019 / Revised: 31 October 2019 / Accepted: 4 November 2019 / Published: 8 November 2019
(This article belongs to the Special Issue Sustainable Grazing Systems)

Abstract

:
Due to the increased herd size in the Netherlands, there is need to assess the performance of different grazing systems at high stocking densities. The objective of the current experiment was to assess the effect of two extreme grazing systems, kurzrasen (continuous grazing at 3–5 cm sward height) and strip-grazing at a high stocking rate, on grass production and quality, grass morphology and sward density, root development and load bearing capacity on peat soil. To this end, a two-year grazing trial with four herds of 15 cows on 2 ha each was conducted. Kurzrasen showed 18% lower herbage dry matter production on average compared to strip-grazing. The yield penalty of using a shorter regrowth period under kurzrasen was limited due to the strong response in grass morphology, resulting in a dense and lamina-rich sward. There was a small decline in root density at 10 cm soil depth, but no evidence of a lower root density at 20 cm soil depth for kurzrasen compared to strip-grazing. Sward density was higher for kurzrasen compared to strip-grazing, which had a positive impact on load bearing capacity. This is an important feature on peat soils, where load bearing capacity is often limited.

1. Introduction

In northwestern Europe, grazed pastures form an important feed source for dairy production and grazing cows are important for the image of the dairy sector [1]. In general, there is a downwards trend in the proportion of cows with access to pasture, and Reijs et al. [2] reported a decline in grazing in five out of seven grazing areas in Europe. In the Netherlands, the proportion of dairy cows with access to pasture has declined from 90% in 2001 to 63% in 2013. In more recent years, this proportion has stabilized and even increased up to 75% in 2017 [3]. In recent decades, herd size has nearly doubled from 55 to 97 dairy cows per farm [4], whereas the available grassland area close to the farm yard remained the same [5]. This results in high(er) stocking rates on the grazed area, often in excess of 7.5 cows per ha, which makes it difficult to maintain a grazing system with access to pasture for more than six hours per day [5]. Additionally, the high milk output per cow demands a high dry matter and nutrient intake. Achieving sufficient pasture intake and pasture utilization in a system with high supplementary feeding can be a challenge. Another concern is the lack of grassland management skills of many farmers [6].
In the western peat meadow region in the Netherlands, the proportion of dairy cows grazing is still relatively high but, even here, there is increasing pressure on grazing. There are natural limitations such as the relatively small and narrow fields, which are often poorly accessible due to a lack of paved farm tracks. Also, the peat soil has a relatively low load bearing capacity, particularly when soils are wet, resulting in trampling and sward damage.
Currently, most farmers in the western peat meadow region apply rotational grazing, a system in which the cows are moved to a new paddock every 3–5 days, with a target pre-grazing sward height of 13–18 cm [7]. While this system requires relatively little labor and infrastructure in terms of moving fences, herbage production is not optimal because the herbage supply to be grazed is fouled and trampled due to the multiple-day residence time. Additionally, the quality and quantity of herbage intake is variable, which may negatively affect the stability of milk production. Alternatively, strip-grazing is a system in which cows are allowed a fresh strip of pasture (with back-fence) each day, followed by a regrowth period. This system generally results in the highest grass production and milk production. However, it requires large investments in terms of grazing infrastructure (cow paths and watering points) and labor for moving fences, water supply and grassland planning.
Recently, there is increasing interest in the kurzrasen grazing system, which was developed in Switzerland and Germany. Kurzrasen is a continuous grazing system, in which sward height is always kept between 3 and 5 cm, which is much shorter than conventional continuous grazing systems at approximately 8 cm. Trials with simulated grazing have shown that the herbage production in these grazing systems is lower than for strip-grazing [8,9]. However, the high quality of the ingested herbage, which consists mainly of protein- and energy-rich young leaf tips potentially results in a good conversion into milk. A major potential benefit of this system for the Dutch peat meadow region is its positive effect on sward density, which may increase the load bearing capacity. At the same time, the high defoliation frequency and intensity may result in a reduction in root biomass for kurzrasen [10]. This could have a negative impact on the drought resistance of the herbage. Additionally, Ernst et al. [11], estimated that continuous grazing resulted in a reduction of labor input of 50% and lower costs for infrastructure compared to intensive rotational grazing.
The objectives of the current experiment were to assess the effect of these two contrasting grazing systems, strip-grazing and kurzrasen at a high stocking rate, on grass production and quality, grass morphology and sward density, load bearing capacity, water infiltration rate and root development on peat soil. We hypothesize that in comparison to strip-grazing, kurzrasen results in lower grass productivity, but with a higher feeding value. The lower sward height will affect grass morphology and sward density, which may have a positive effect on load bearing capacity. Root density is expected to be lower for kurzrasen, particularly at deeper soil layers.

2. Materials and Methods

2.1. Experimental Setup

The experiment was conducted at Knowledge Transfer Centre Zegveld (ZV) (52°08′25.8″ N 4°50′19.7″ E) which is situated on drained peat soil (Terric Histosols; FAO 2015) in the western peat region in the Netherlands (soil organic matter content of 37.5%, 18% sand, 25% clay). The site was a permanent grassland with combined grazing and cutting management. The swards were last resown in 2012 or 2013 and in the years preceding the trial, received on average 200 kg N ha−1 yr−1 in the form of slurry and inorganic fertilizer. The trial ran for two years in 2016 and 2017.
The experimental treatments consisted of two grazing systems, strip-grazing (SG) and kurzrasen (KR), in two replications. In both years, four independent groups or farmlets were formed, each consisting of 15 cows on 2 ha, representing a stocking rate of 7.5 LU ha−1 on the grazing platform. The additional area only used for silage production was not taken into account. Sixty cows (36 Holstein Friesian and 24 Jersey) were assigned to 15 blocks based on breed, parity, days in milk, milk yield and body weight. Within blocks, cows were randomly allocated to one of four treatment groups.
Prior to the experiment, in 2015, the kurzrasen area had already been subjected to a kurzrasen grazing regime, whereas the strip-grazing area was grazed in a rotational grazing system in order to allow the swards to adapt to the different regimes.

2.2. Grazing Management

Because of the high stocking density, and to avoid heat stress during the summer months, grazing was restricted to night-time grazing only. For kurzrasen, each farmlet consisted of one single grazing block, with the aim to maintain a constant sward height between 3 and 5 cm. For strip-grazing, cows had access to a fixed area of two strips, which was a combination of a fresh new strip and the strip from the day before, with strip-size depending on the herbage growth rate and supply (total grazing area of 47 to 267 m2 per cow). In the strip-grazing system, herbage in excess of animal requirements was harvested for silage production. Cows were supplemented with grass silage in the stable during day-time depending on grass production and supply (on average 3.9 and 2.6 kg DM cow−1 day−1 in 2016 and 2017, respectively). Additionally, all cows received on average of 7 kg concentrates cow−1 day−1.
In March, 25 m3 (2016) or 30 m3 (2017) of cattle slurry was applied to all fields. Additionally, fields were fertilized with 100 (2016) or 80 kg N ha−1 (2017) in the form of calcium ammonium nitrate, distributed over 3 to 4 applications over the growing season.

2.3. Weather Conditions and Impact on Grazing

Monthly temperature and rainfall data in comparison to the long-term average (since 1980) collected from the KNMI weather station in De Bilt (23 km distance) are shown in Figure S1. In 2016, wet conditions in early April resulted in low load bearing capacity of the grazing area and, as a result, the grazing season started on 20 April for strip-grazing. At this stage, the sward height was over 10 cm for kurzrasen, which is way in excess of the target 5 cm, and it was decided to cut and harvest this herbage, before turning out the cows on 24 April. In June and July 2016, due to high amounts of rainfall (Figure S1), the strip-grazing groups were kept indoors for two weeks. Rainfall in September and October was low, and the grazing season was ended for both systems on 22 October due to a lack of herbage growth.
In 2017, the grazing season started on 27 March for kurzrasen and 4 April for strip-grazing. For strip-grazing, cows were kept indoors for one week during June and September because of low grass supply and for a few days in September because of low load bearing capacity due to rainfall. The grazing season was ended for both systems on 5 October due to high rainfall resulting in a poor load-bearing capacity.

2.4. Soil Parameters

Within each farmlet, two 5 m × 5 m observation plots were set up within which all soil and morphological measurements were carried out, resulting in a total of 8 observations per time point. All soil measurements were carried out at the start of the growing season (March/April) and at the end of the growing season (October/November). Additionally, load bearing capacity and soil moisture content were measured on three additional occasions during the growing season (May, July and September).
Load bearing capacity was measured with an analog penetrometer (Eijkelkamp), with a cone diameter of 5.0 cm2 and an apex angle of 60°. Load bearing capacity was recorded at 10 points per plot and was expressed as the average value of the maximum force needed to push the cone through the sod. Water infiltration rate was measured at 3 randomly chosen spots within each observation plot. A PVC pipe of 15 cm high (ø 15 cm) was driven into the soil to a depth of 10 cm and the time it took for 500 mL water to infiltrate was recorded. The soil moisture content was measured by taking 20 soil cores (0–10 cm depth) per observation plot with a grassland auger. The bulked soil was dried at 100 °C for 24 h.
Visual assessments of rooting density were conducted by an expert at the start and end of the growing season. In each observation plot, two 20 × 20 cm soil cubes were dug out with a spade and separated into two halves (0–10 and 10–20 cm depth). Rooting density was assessed by counting root tips in a 10 × 10 cm square at the 10 cm and 20 cm horizontal surface [12]. This method was chosen since the more conventional method determining root density through soil coring followed by root washing is very hard and unreliable on peat soil.

2.5. Herbage Parameters

For kurzrasen, the sward height was measured weekly using a Jenquip folding plate meter. For strip grazing, pre- and post-grazing sward heights were recorded daily. For strip-grazing, herbage production at the grazed area was estimated based on weekly differences in sward height. Grass production for kurzrasen was estimated by measuring the weekly increase in sward height under grass cages (two cages of 1 × 4 m per group) that were moved to a new spot every week. For both methods, the difference in sward height was converted to herbage DM yield based on a conversion factor that was based on the calibration of sward height with herbage DM. For this calibration, five sward height measurements were taken before and after cutting a strip of approximately 0.5 × 4 m using a lawnmower. The fresh weight of the herbage was recorded, and a subsample was dried at 70 °C for 48 h to determine dry matter content. A total of 200 calibration measurements were taken throughout the season during 2016 and 2017 for both kurzrasen and strip-grazing swards (see Figure S2). Analysis of the calibration measurements showed that the conversion factor was on average 237 kg DM ha−1 cm−1 and was the same for kurzrasen and strip-grazing (See Figure S2, R2 = 0.92). Only during May and June, when the strip-grazing herbage showed generative regrowth (whereas this was minimal under kurzrasen), the conversion factor was significantly lower for strip-grazing at 191 kg DM ha−1 cm−1 (R2 = 0.86), which is in line with Klootwijk et al. [13].
Grass harvested for silage production was weighed after collection, and a sample was taken for DM and quality analyses.
In order to determine the herbage quality under grazing, herbage grab samples were taken once a week (strip-grazing) or once every two weeks (kurzrasen) for the duration of the grazing season. Particularly for kurzrasen, it was hard to obtain a representative sample of sufficient size. During 2016, samples were taken with a lawnmower set at 3.5 cm height, which yielded unsatisfactory results (see Table 1). In 2017, extra care was taken to mimic intake of the grazing cows, and samples were collected by cutting of grass tips with scissors. Concentrates, fresh grass and grass silage were analysed for chemical composition and feeding value at Eurofins Agro (NIRS, Wageningen, NL, USA).
Whole-field botanical composition was determined by an expert assessing the percentage cover of all grass and herb species in April and December 2016 and in October 2017.
In May, August and September 2016 and 2017, 25 perennial ryegrass tillers were collected from each observation plot. For strip-grazing, tillers were collected from one pre-grazing and one post-grazing plot for each farmlet. For each tiller, the number of (ungrazed) leaves per tiller was recorded. Additionally, the length of the pseudostem and all leaves (free-leaf lamina, so excluding the length of the pseudostem) was measured. The proportion of free-leaf lamina was calculated for each tiller as the sum of the free-leaf lamina length divided by the total leaf length.
In August and November 2016 and March, May and September 2017, sward density was assessed using the point quadrat method, for which 10 spokes in a row at 10 cm distance were gently pushed into the soil. The number of spokes touching the base of a grass tiller (as opposed to litter or bare soil) at the soil surface was recorded. This was repeated ten times in each observation plot, and the percentage cover was calculated.

2.6. Number of Steps

The number of steps during grazing was determined throughout the grazing season in 2016 and 2017 for all cows using NEDAP smarttag leg sensors [14].

2.7. Statistical Analysis

The effect of grazing system on mean daily herbage growth rate, herbage production, silage production and feeding value was analyzed by Generalized Linear Modelling (GLM). The effect of grazing system and time of measurement on herbage morphology and soil parameters were analyzed with GLM, taking into account the random structure of repeated measures over time and sub-plots within each farmlet, using the LMER package in R 3.4.4 [15]. Pearson correlations were carried out to assess correlations between soil and sward parameters.

3. Results

3.1. Soil Parameters

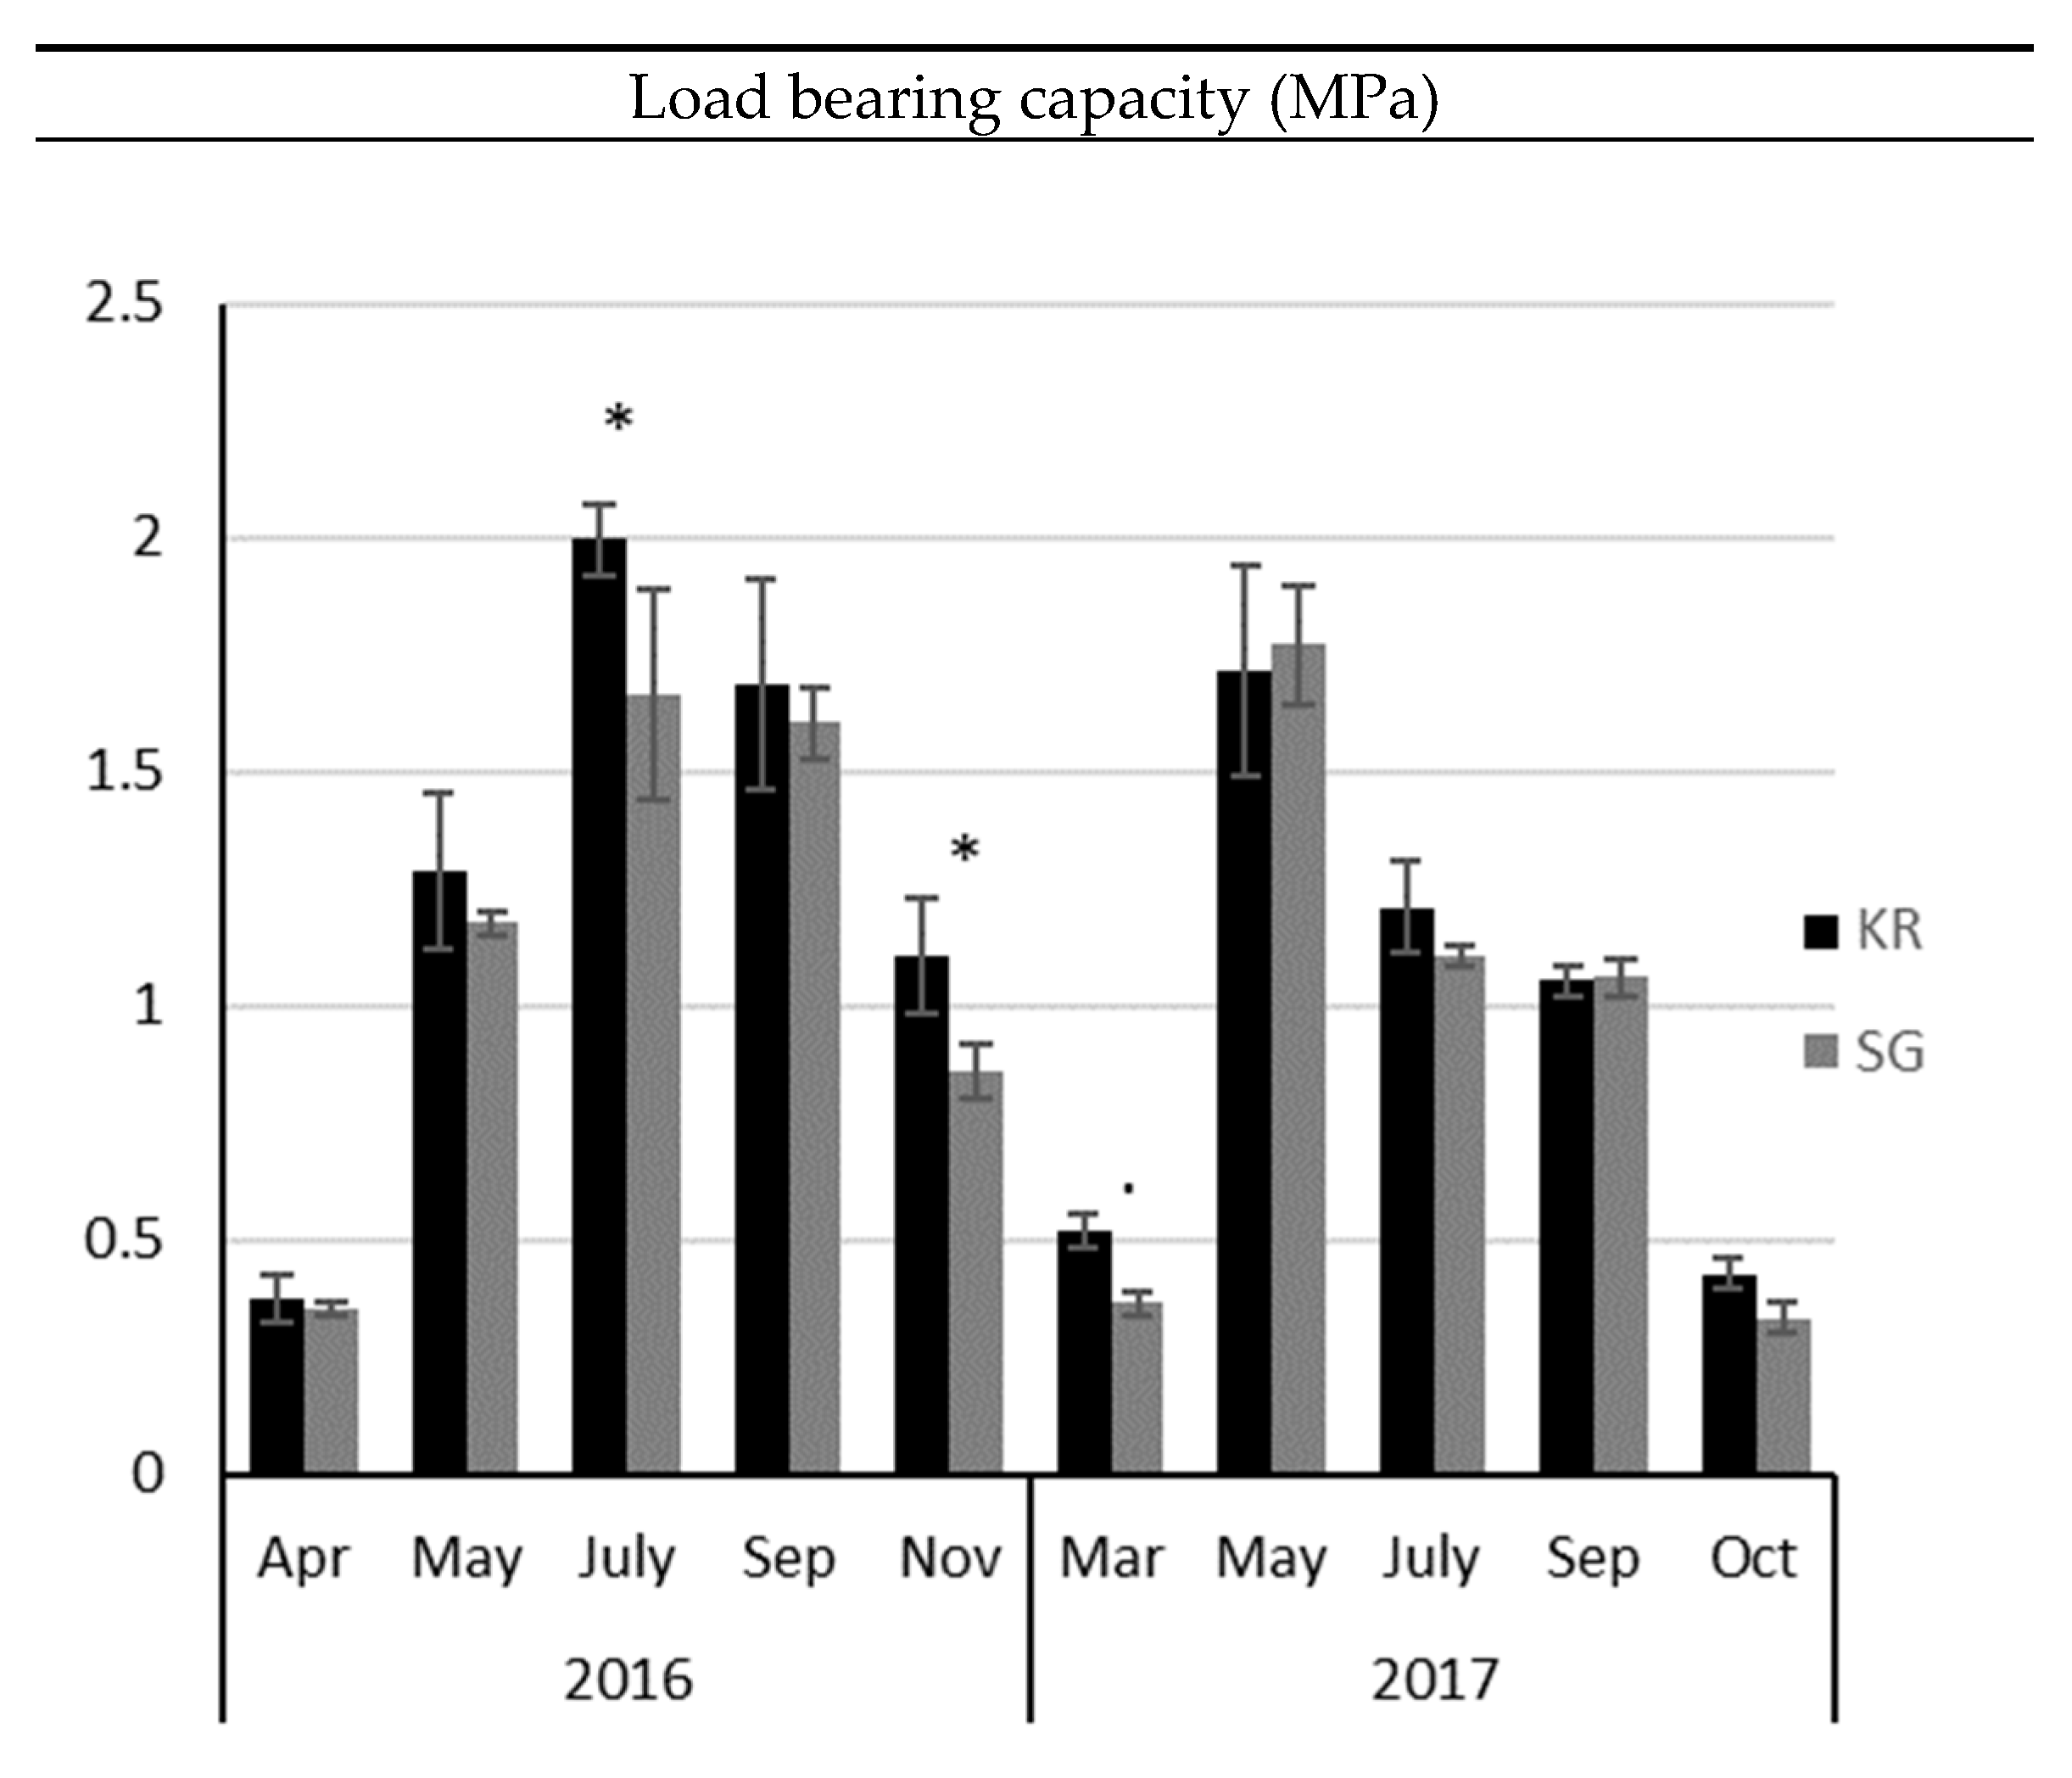
3.1.1. Load Bearing Capacity and Penetration Resistance

Load bearing capacity ranged from below 0.4 MPa in April 2016 and March and October 2017 to over 1.6 MPa during July and September 2016 and May 2017 (Figure 1). On average, the loadbearing capacity was higher for kurzrasen (on average 1.1 MPa) compared to strip-grazing (on average 1.0 MPa), however this difference was only statistically significantly (p < 0.05) during July and November 2016 (Figure 1).
Penetration resistance ranged from 1.5 MPa in November 2016 to 0.39 MPa in April 2016, both at 0–10 cm soil depth (Figure S3). In the top 20 cm and below 30 cm, there was no significant effect of system on penetration resistance. Only at 20–30 cm soil depth, penetration resistance was significantly higher for kurzrasen compared to strip-grazing during November 2016 and March 2017, but this effect was not significant during April 2016 and October 2017 (significant system × month interaction, p < 0.05).

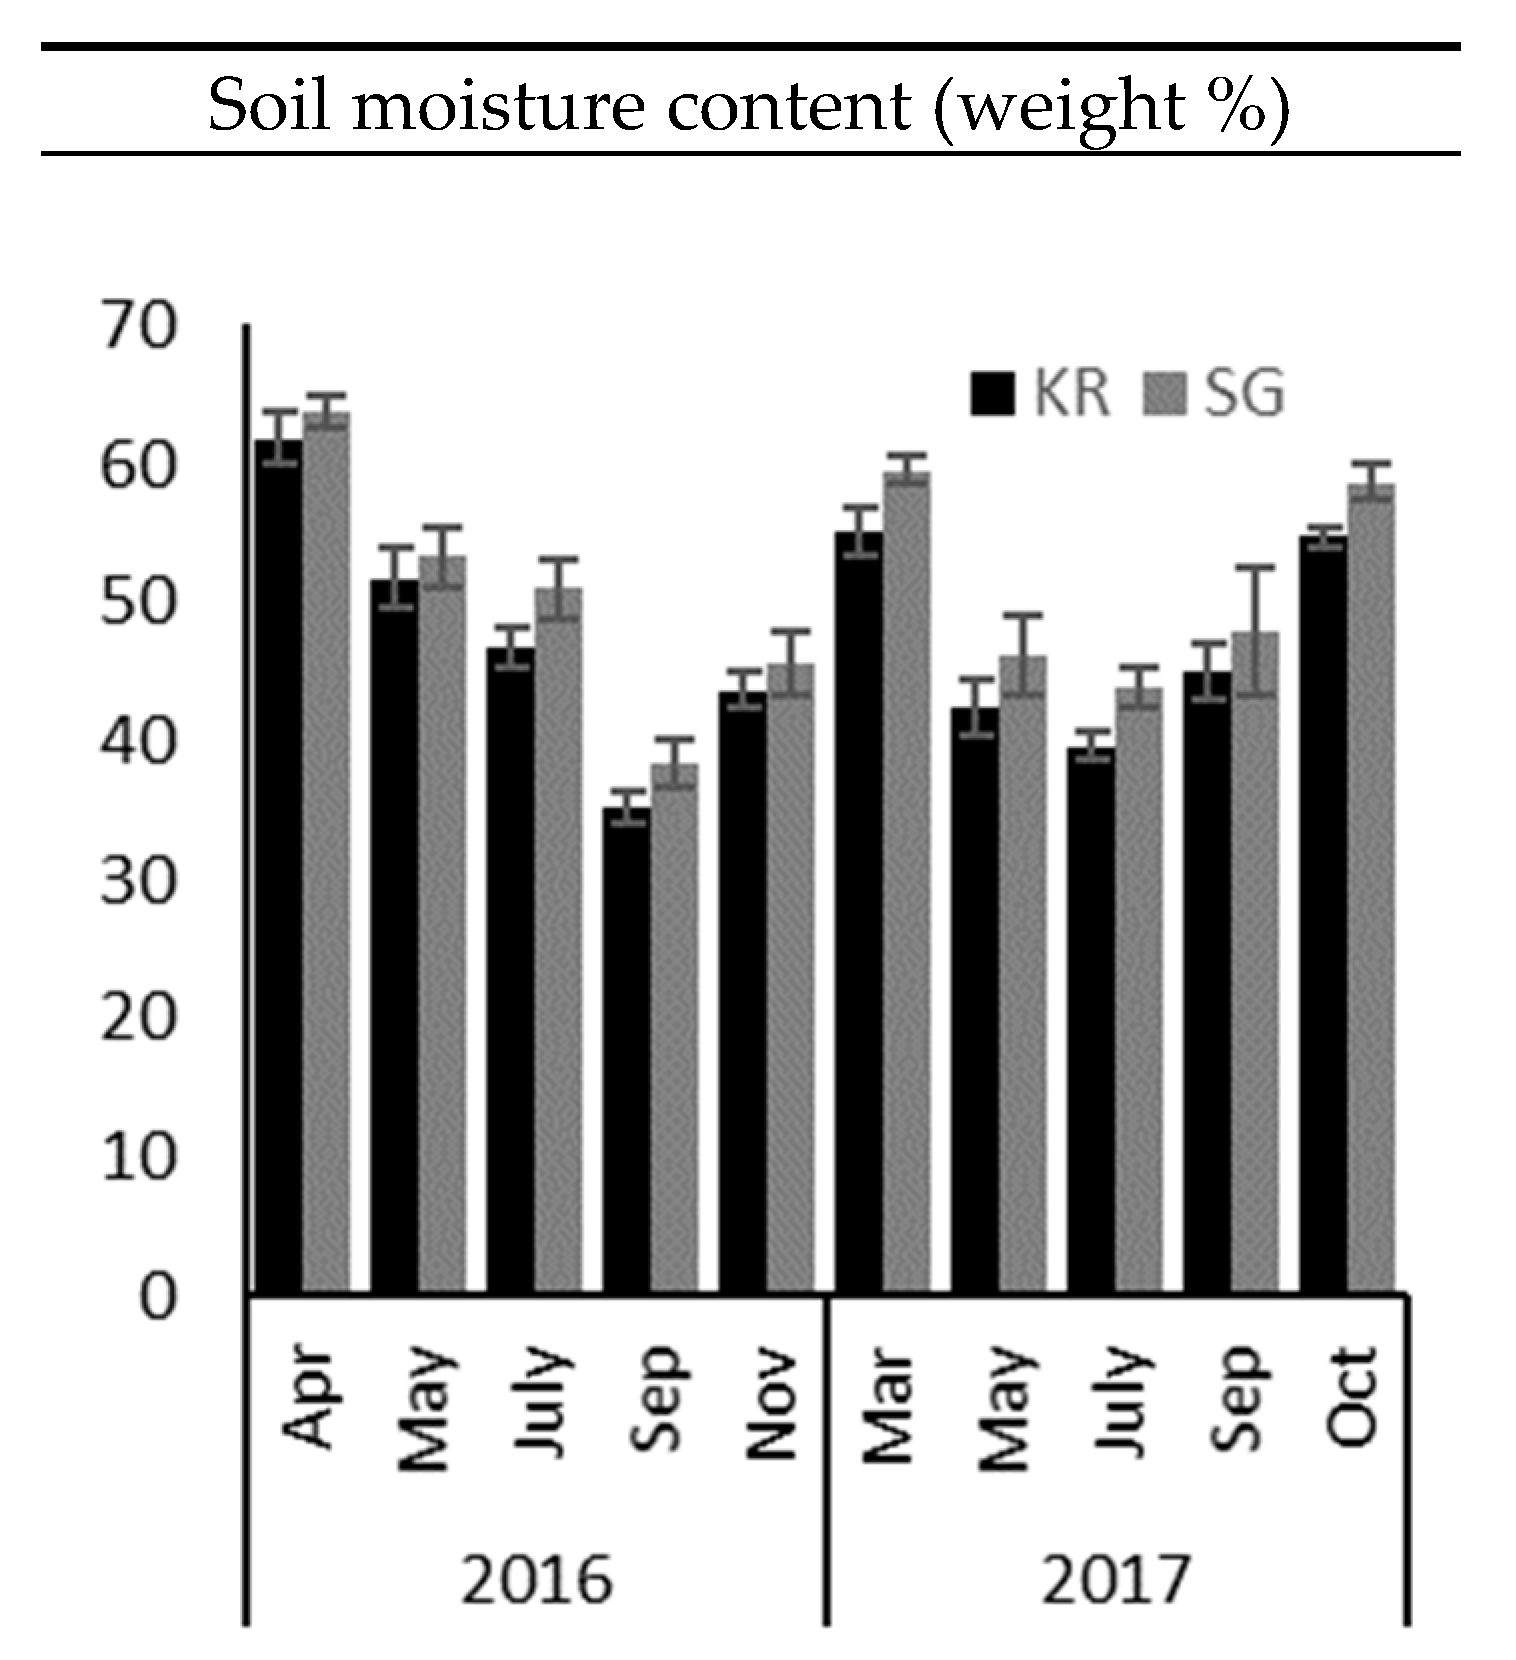
3.1.2. Soil Moisture Content and Temperature

Soil moisture content ranged from over 62% in April 2016 to below 45% in July 2017 (Figure 2). Soil moisture content was slightly but significantly (p < 0.05) lower for kurzrasen compared to strip-grazing (47.9% and 50.9%, respectively).
Mean daily soil temperature ranged from 7.9 °C in March 2017 to 22.1 °C in July 2017 and was not significantly affected by grazing system (data not shown).

3.1.3. Water Infiltration Rate

During April 2016 and October 2017, it was not possible to measure the water infiltration rate, because the high soil moisture content severely impeded the infiltration of water into the soil. For the two remaining measurement periods, there was a significant month by system interaction: During October 2016, when soil conditions were relatively dry, the water infiltration rate was significantly lower for kurzrasen compared to strip-grazing, 41 and 70 mm per minute, respectively (Figure S4). During March 2017, when the soil was really wet, the water infiltration rate was on average 1.7 mm per minute and there was no significant difference between the two grazing systems.

3.1.4. Root Density

The root density was on average 145 and 108 roots dm−2 at 10 and 20 cm soil depth, respectively (Figure 3). There was a significant (p < 0.01) month by system interaction for the root density at 10 cm soil depth. The root density at 10 cm soil depth tended to be lower for kurzrasen compared to strip-grazing, but only significantly so in April 2016 (p < 0.01). There was no significant effect of system on the root density at 20 cm soil depth or on the proportion of roots at 10 cm soil depth, which was on average 60%.

3.2. Herbage Parameters
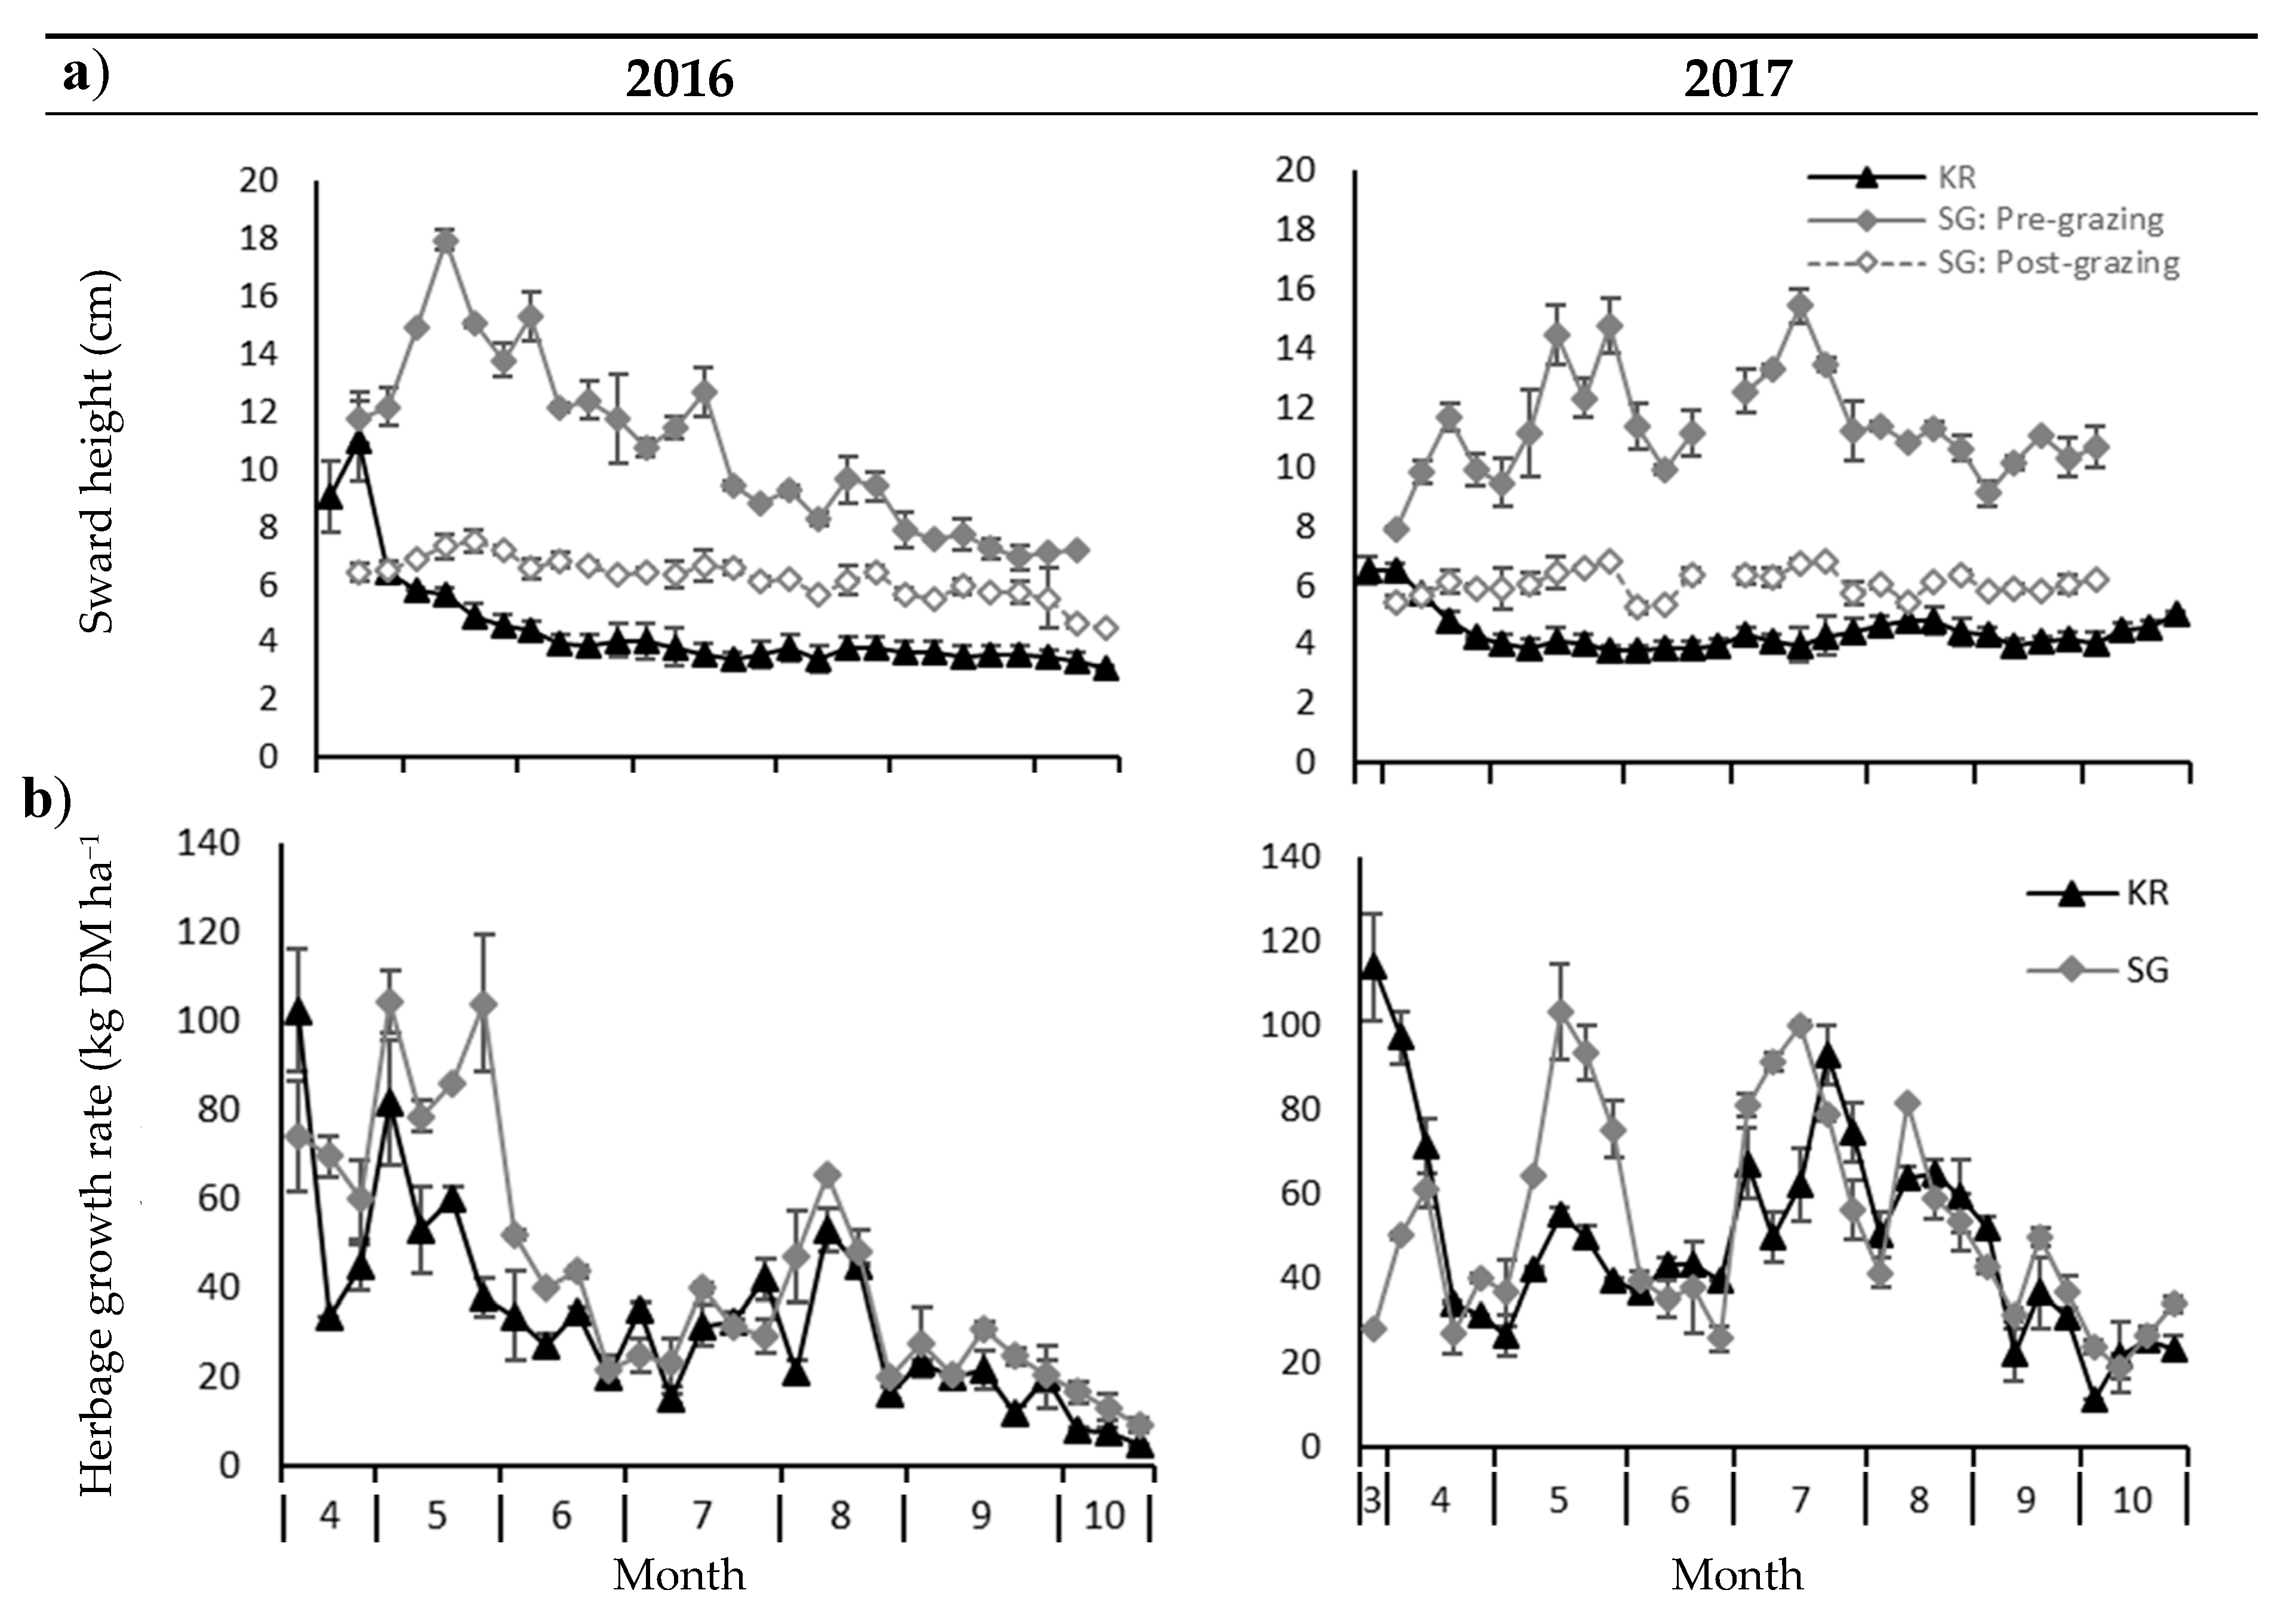
3.2.1. Sward Height

The sward height for kurzrasen in 2016 ranged from 6.5 cm in April to between 4 and 3 cm from June onwards (4.5 cm on average) and between 4 and 5 cm in 2017 from May onwards (4.5 cm on average, Figure 4a). In 2016, the pre-grazing sward height for strip-grazing ranged from 18 cm in May to below 8 cm in September and October. The post-grazing sward height ranged from 7.5 cm in May to below 6 cm in September and October. In 2017, the mean pre-grazing sward height was 11.3 cm and the post-grazing sward height was 6 cm.

3.2.2. Herbage Growth Rate on the Grazed Area

In 2016, the herbage growth rate on the grazed area (excluding area set aside for silage production) was on average 33 and 44 kg DM ha−1 d−1 for kurzrasen and strip-grazing, respectively (Figure 4b and Table 1). Peak growth for kurzrasen was in mid-April, when the sward height was in excess of the target 5 cm (see also above). For strip-grazing maximum growth rates of over 110 kg DM ha−1 d−1 were achieved in May and June. In 2017, the herbage growth rate on the grazed area was on average 46 and 59 kg DM ha−1 d−1 for kurzrasen and strip-grazing, respectively (Figure 4b).
In 2016, the cumulative herbage DM production on the grazed area based on these herbage growth rates was 7.4 and 8.8 t DM ha−1 for kurzrasen and strip-grazing, respectively (Table 1). In 2017, the cumulative herbage dry matter production was 23% higher for strip-grazing than kurzrasen 12.8 and 10.4 t DM ha−1, respectively).

3.2.3. Herbage Chemical Composition

In 2016, there was no significant difference in crude protein (CP) content between kurzrasen and strip-grazing (Table 1), whereas the VEM (feed unit milk; 1000 VEM = 6.9 MJ; Van Es, 1978), DVE (true protein digested in the small intestine; Tamminga et al., 1994), organic matter (OM) digestibility and ash content were significantly (p < 0.05) lower for kurzrasen compared to strip-grazing. Acid detergent fiber (ADF) and lignin (ADL) were significantly (p < 0.05) higher for kurzrasen compared to strip-grazing. This unexpected result was strongly related to the sample collection method (lawnmower for kurzrasen), which was not representative of the actual plant parts (leaves) selected during grazing. Therefore, in 2017, we adjusted the sampling protocol to better mimic the grazing pattern of the cows. In 2017, the crude protein content, VEM and DVE were significantly (p < 0.05) higher for kurzrasen compared to strip-grazing (Table 1), and digestibility also tended to be higher (p = 0.08). In contrast, NDF and ADF were significantly (p < 0.05) lower for kurzrasen than strip-grazing.

3.2.4. Botanical Composition

The proportion of desirable grasses (Lolium perenne and Phleum pratense) was on average 58% for kurzrasen and 69% for strip-grazing (p < 0.05, Table S1). This difference was already apparent at the start of the kurzrasen grazing treatment in May 2015 (71.3 and 89.8% for kurzrasen and strip-grazing, respectively). This proportion decreased from on average 73% in April 2016 to 59% and 58% in December 2016 and October 2017, respectively (p < 0.05). The remaining species mainly consisted of other grasses (mainly Poa trivialis, Elymus repens, Poa annua and Agrostis stolonifera). The proportion of dicots ranged from 0.4% in April 2016 to 3.7% in October 2017.

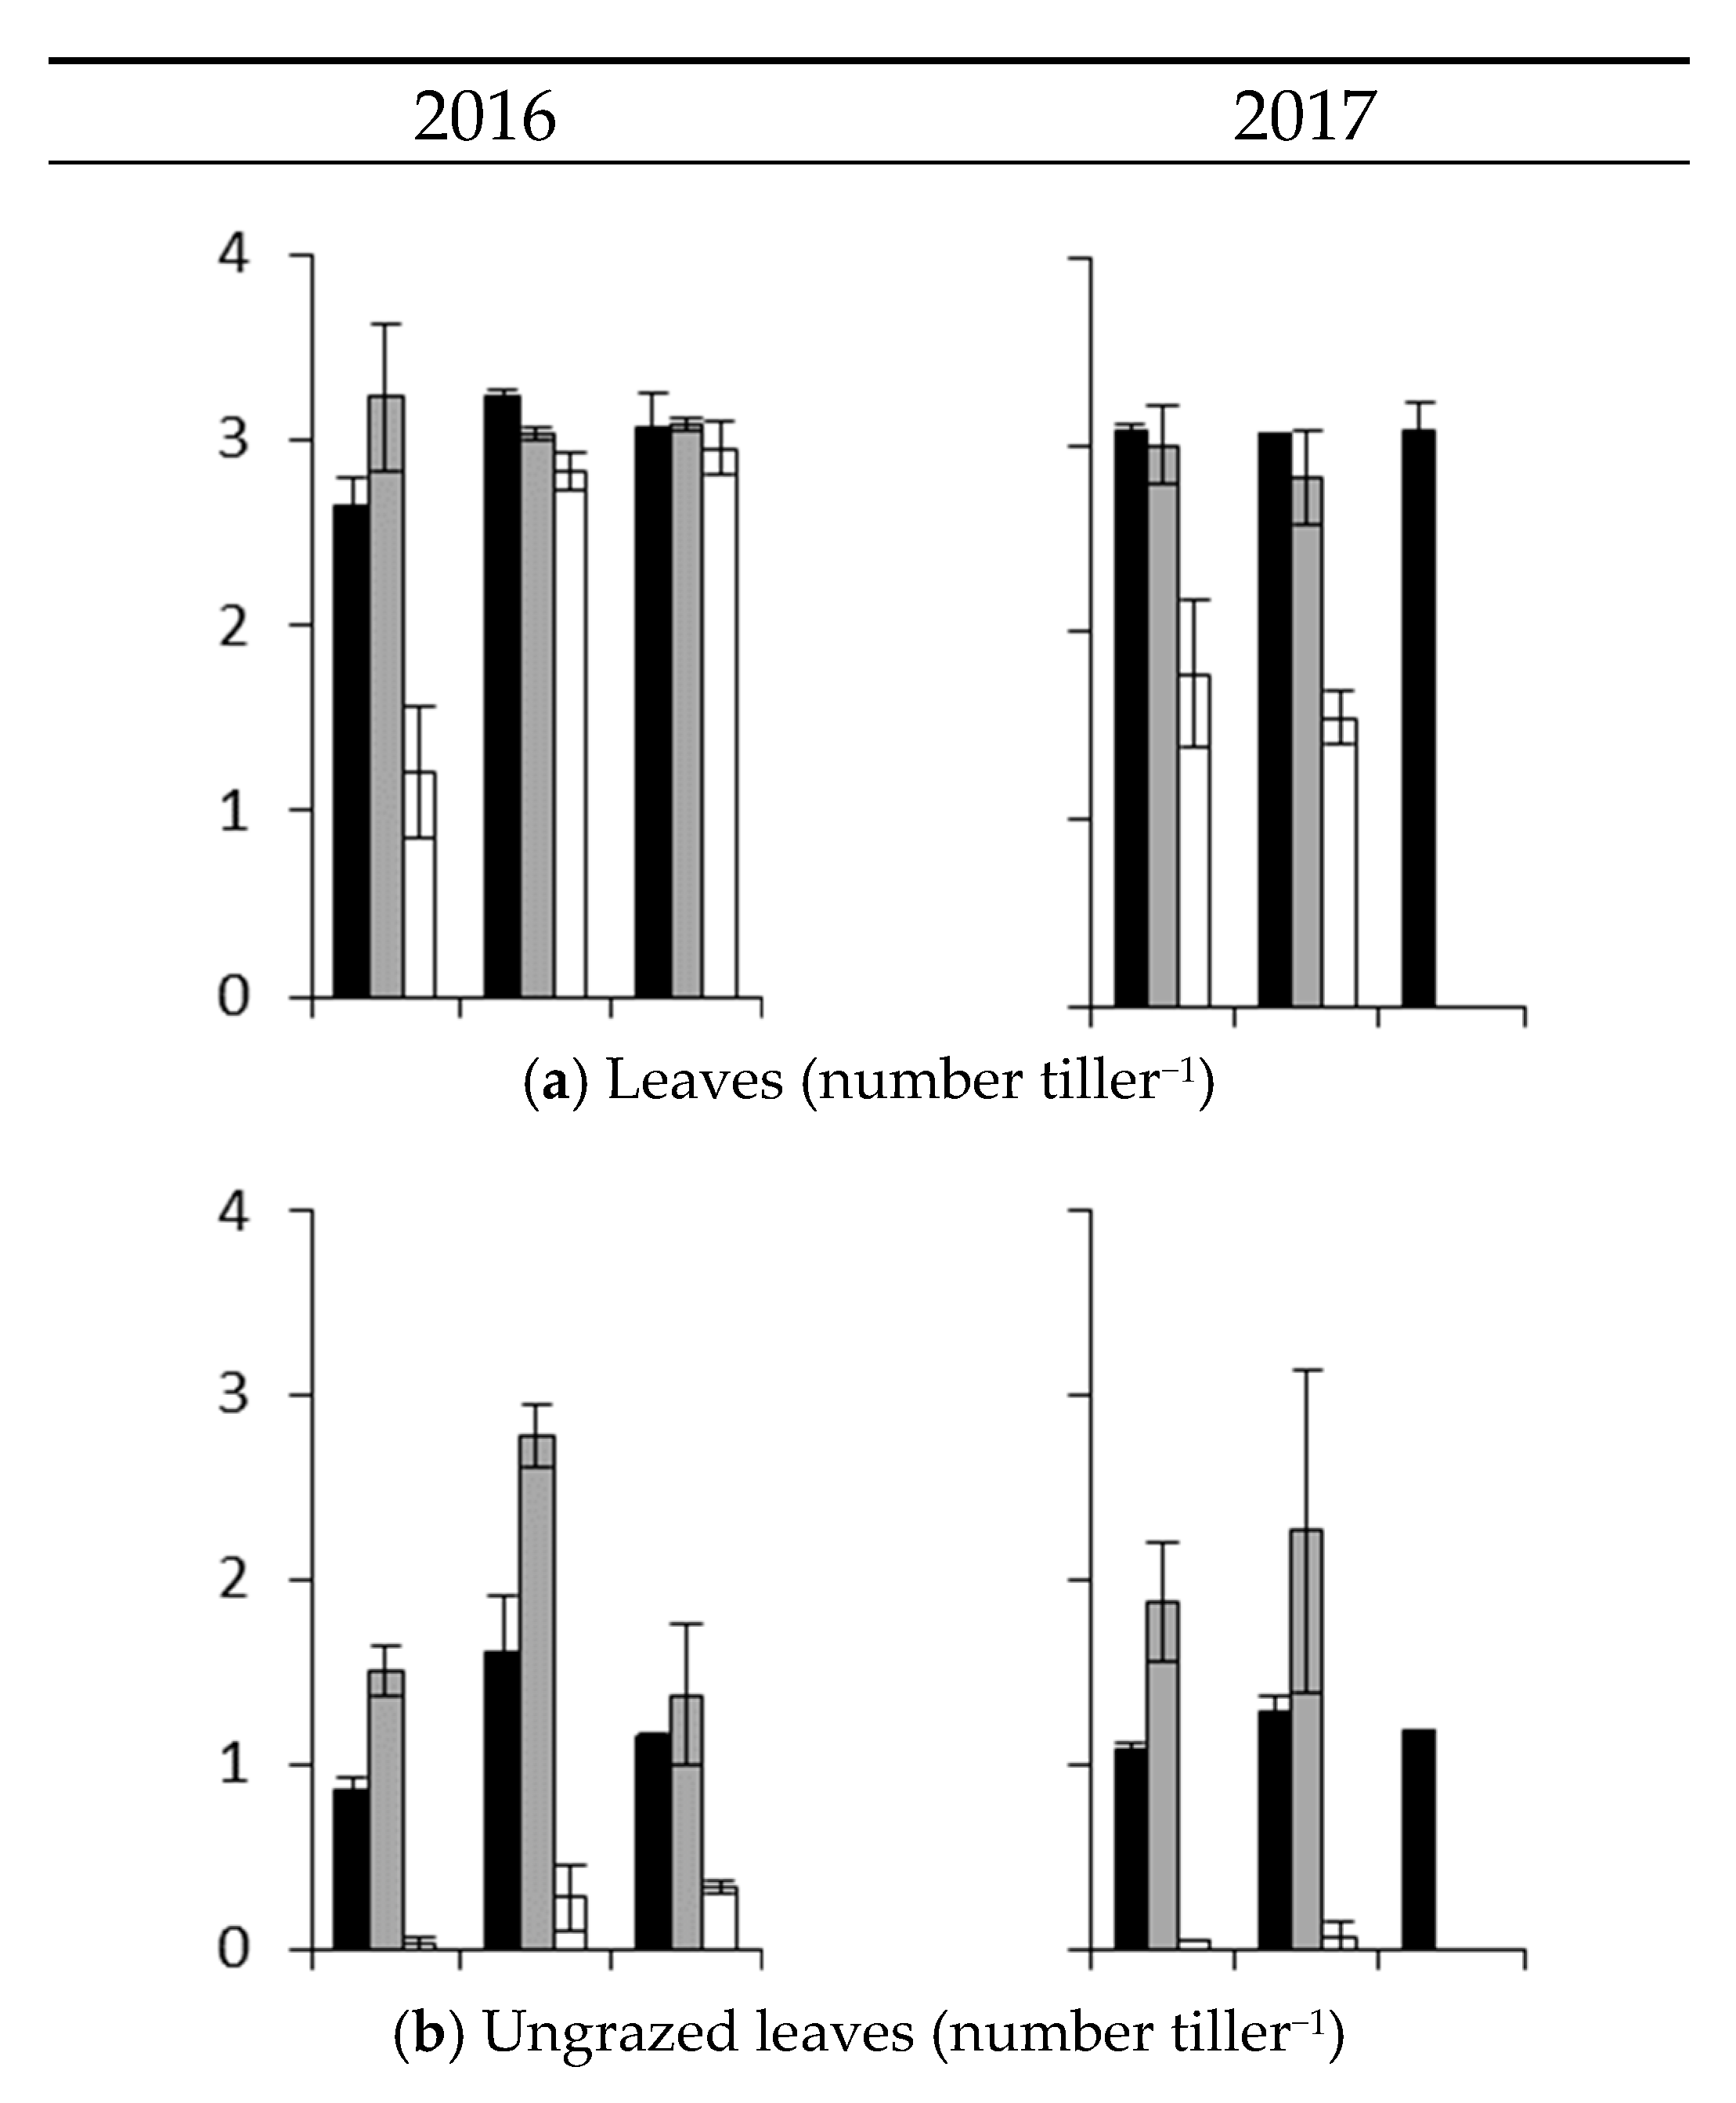
3.2.5. Herbage Morphology

The number of green leaves per tiller was on average 2.7 (Figure 5a). In 2016, the number of leaves was lower for strip-grazing-post during May, (significant system × month interaction, p < 0.001). In 2017, the number of leaves was significantly (p < 0.001) lower for strip-grazing-post during all months (no measurements during September).
The number of ungrazed leaves per tiller (Figure 5b) was on average 1.2 for kurzrasen, 2.0 for strip-grazing-pre and 0.13 for strip-grazing-post. Also, the number of ungrazed leaves was higher in July compared to May and September, for kurzrasen and strip-grazing-pre, resulting in a significant (p < 0.05) month by system interaction.
There was a significant (p < 0.05) system x month interaction for the total free-leaf lamina length (Figure 5c). The total free-leaf lamina length was highest for strip-grazing-pre, with on average 30 cm tiller−1. The total free-leaf lamina length for kurzrasen (on average 9.4 cm tiller−1) compared to strip-grazing-post (on average 5.9 cm tiller−1) was either higher (May both years, July 2017) or similar (July 2016).
The proportion of free-leaf lamina (proportion of total tiller length) was significantly (p < 0.001) lower for strip-grazing-post compared to strip-grazing-pre and kurzrasen (Figure 5d) and was on average 0.47, 0.75 and 0.76, respectively.
There was a significant (p < 0.001) month x system interaction for the proportional sward cover measured with the point quadrat method (sward density). The mean sward cover was on average 80% and 60% for kurzrasen and strip-grazing, respectively (Figure 6). The difference between kurzrasen and strip-grazing was smaller and not significant in March 2017.

3.3. Number of Steps

The average number of steps per day during grazing in 2016 was 19,942 and 17,591 for kurzrasen and strip-grazing, respectively (p < 0.05), and the average number of steps per day during grazing in 2017 was 25,313 and 20,530 for kurzrasen and strip-grazing (p = 0.12), respectively. The higher number of steps per day for kurzrasen was the result of a higher number of grazing hours per day (on average 13.0 and 12.1 h per day for kurzrasen and strip-grazing, respectively) and an increase in the number of steps per grazing hour (1732 and 1588 for kurzrasen and strip-grazing, respectively).

3.4. Correlations

In general, there was a negative correlation between load bearing capacity and soil moisture content, and this correlation was significant during May and July 2016 and March and October 2017 (Figure 7a and Table S2). In contrast, the load bearing capacity was generally positively correlated with the sward density, significantly so during July 2016 and July and October 2017 (Figure 7b and Table S2). Load bearing capacity was not significantly correlated to root density. Load bearing capacity was generally positively correlated to the penetration resistance but only significantly (p < 0.05) so in November 2016 (21–30 cm), March 2017 (21–30 cm and 31–40 cm).
During March 2017, when the soil was relatively wet, soil moisture content (SMC) was negatively correlated to the water infiltration rate (r = −0.89; p < 0.01). However, during November 2016, when soils were relatively dry, there was no significant correlation between SMC and the water infiltration rate (Table S2). Water infiltration was negatively correlated to the penetration resistance in November 2016 (p < 0.05 for 21–30 and 31–40 cm), but there was a significant positive correlation in March 2017 (p < 0.05 for 0–10 and 11–20 cm).

4. Discussion

4.1. Load Bearing Capacity

Load bearing capacity was generally higher for kurzrasen than for strip-grazing, but this was only statistically significant during July 2016, November 2016 and March 2017. Load bearing capacity is an important parameter that has a large impact on grassland utilization, as it affects the length of the grazing season (turn-out and turn-in dates) but also the potential for grazing during periods with high rainfall during the grazing season (such as in June 2016). In general, a load bearing capacity in excess of 0.7 MPa is assumed to be adequate to prevent sward damage during grazing [16]. The weeks around the measurements in November 2016 and particularly March 2017 were wet periods, during which, the difference in load bearing capacity affected whether this threshold value was achieved or not. Load bearing capacity may depend on a combination of factors, including soil moisture content, sward density, and root density [17], as outlined below.
Soil moisture content (SMC) showed a strong negative correlation with load bearing capacity (Figure 7a), both within and between measurement periods, which is in line with literature [18]. The high SMC in March and April (>50%) resulted in a low load bearing capacity (<0.5 MPa) during those periods. Whereas during the dry periods (<50% SMC) the load bearing capacity ranged from 0.8 to over 2 MPa. The negative correlation between load bearing capacity and soil moisture content is in line with other studies showing that a higher soil moisture content decreases the load bearing capacity of the soil due to decreased soil strength [18]. Under these conditions, grazing can result in soil compaction, followed by pugging at high moisture contents and poaching on saturated soils [17].
Soil moisture content tended to be lower for kurzrasen compared to strip-grazing (Figure 2). This could be related to higher levels of evaporation from the soil, due to increased wind speed at soil surface at low sward heights [19]. However, this is somewhat counterbalanced by the higher sward density for kurzrasen, limiting the exposure of bare soil to the air. At the same time, the lower grass growth rate for kurzrasen in comparison to strip-grazing may result in lower water usage and hence evapotranspiration. Indeed, evapotranspiration from grass has been shown to be positively correlated to sward height [20]. Also, Donkor et al. [21] found a lower soil moisture level for rotational grazing compared to continuous grazing as a result of higher evaporation and transpiration rates of the standing crop.
Load bearing capacity was positively correlated to the sward density (Figure 7b), which is in line with literature [17]. Dense swards allow less direct hoof/soil contact and offer a higher degree of protection. Sward density was higher for kurzrasen compared to strip-grazing. This increase in tiller density is the result of lower shading by large leaves in the kurzrasen sward [22]. Additionally, more frequent defoliation may affect the hormonal distribution, resulting in faster cell division and tiller formation [23]. Therefore, kurzrasen may be employed as a strategy to increase the load bearing capacity and therefore increase the number of days available for grazing and decrease sward damage as a result of treading.
Load bearing capacity showed no statistically significant correlation with root density (Table S2) and there were no statistically significant differences in root density between the two grazing systems (see also below).

4.2. Treading

The number of grazing hours and number of steps during grazing may affect the impact of grazing on sward damage during grazing at times with low load bearing capacity. In the kurzrasen system, both the time spent in pasture and the number of steps per hour were higher compared to strip-grazing. This is probably related to the low available herbage mass at kurzrasen, resulting in a lower intake rate per bite. It is unclear to what extent this higher level of treading for kurzrasen will counteract the positive effects of increased sward density on damage during grazing at higher soil moisture levels. Several studies have reported a negative impact of stocking density on soil damage during grazing [24,25,26,27]. However, in most studies (as in the current study) the effect of increased treading cannot be disentangled from the grazing system, i.e., higher stocking densities are often associated with lower sward height [17]. Also, for kurzrasen, the daily grazing area was 2 ha, whereas for strip-grazing, the daily available area was on average 0.18 ha. As a result, the actual stocking rate during grazing was more than 10 times higher for strip-grazing compared to kurzrasen, but for strip-grazing, the sward had rest-periods in between grazing sessions. Therefore, when soil load bearing capacity is low, strip-grazing potentially results in a lot of damage on a relatively small area, whereas with kurzrasen the sward damage is limited. In practice, this means that, regardless of differences in load bearing capacity associated with sward density, with strip-grazing, farmers will more readily choose to keep their livestock indoors to avoid excessive sward damage. Indeed, during 2016 and 2017, the strip-grazing groups were kept indoors during the grazing season due to low load bearing capacity on a number of occasions, whereas with kurzrasen this was never the case. However, kurzrasen systems often only have one access point into the paddock, which is used throughout the grazing season, and trampling around this area may therefore be more apparent. There was no statistically significant effect of system on the soil penetration resistance at 0–10 cm soil depth, indicating that there was no evidence of differences in soil compaction between the two systems.

4.3. Water Infiltration Rate

A high water infiltration rate is important for flood prevention, because soils can take up water during rain showers more rapidly, which reduces the peak loads of drainage water in ditches and rivers. This is particularly relevant in view of future climate change scenarios, in which the occurrence of extreme rainfall events is predicted to increase (KNMI, 2014). The range in water infiltration rate measured in the current experiment is in line with Deru et al. [28], who reported an average water infiltration rate of 32 mm min−1 on relatively dry production grassland soil and 6.2 mm min−1 on dryer semi-natural grassland soils.
At high soil moisture levels (i.e., April 2016, March and October 2017), the water infiltration rate was less than 4 mm min−1 (too low for measurement during the first and the latter month). At these times, we found no statistically significant differences between the two grazing systems. In March 2017, there was a negative correlation between water infiltration rate and soil dry matter content, indicating that during wet periods, the water infiltration was faster on dryer soils. During November 2016, when the soil was relatively dry, the water infiltration rate was over 40 mm min−1. Even though at this point the water infiltration rate was statistically significantly higher for strip-grazing compared to kurzrasen, it is questionable whether this difference is practically relevant. During this dry period, there was no statistically significant correlation between SMC and water infiltration rate, and a negative correlation between penetration resistance and water infiltration rate.

4.4. Herbage Growth

Herbage growth rates in 2016 were relatively low, which was related to the extremely wet conditions during the middle of June, followed by very dry conditions during September and October. Growing conditions were generally better in 2017, and the mean herbage growth rate in the pasture was on average 39 and 52 kg DM ha−1 d−1 during 2016 and 2017, respectively.
The herbage dry matter production rate on grazed pasture, excluding area temporarily used for silage production, was on average 13% and 24% lower for kurzrasen compared to strip-grazing in 2016 and 2017, respectively. This is in line with [9], who reported a 36% increase in herbage DM production for simulated rotational grazing (6 cuts per season) compared to kurzrasen (9 cuts per season). The yield reduction for kurzrasen can be related to the young leaf stage at time of grazing (leaf stage 1–1.5 and 1.5–3 leaves tiller−1 for kurzrasen and strip-grazing, respectively, Figure 5b), and the short post-grazing height (on average 4.5 and 6.1 cm for kurzrasen and strip-grazing, respectively) associated with the kurzrasen system, as outlined below.
A number of publications have shown that the highest herbage yields are achieved by grazing at the two to three leaf stadium (corresponding to approximately three-week regrowth period) to a residual grazing height of approximately 5 cm [29,30]. Just after grazing, at the start of the regrowth period there is relatively little photosynthetically active plant material (i.e., lamina), and growth is mainly dependent on sugar reserves in the stubble and roots. As soon as sufficient lamina material has developed, further growth is based on photosynthesis, and at this stage, sugar reserves can be replenished [31,32]. If swards are grazed too often (before the sugar reserves have been restored), this can result in decreased growth capacity and reduced root growth.
Similarly, a too low stubble height may result in low sugar reserves and reduced or at least delayed growing capacity. In contrast, when the regrowth length is too long, or the stubble too high, this will result in senescence of older plant material, and lower grass utilization [31,32]. However, the yield penalty for kurzrasen is smaller than could be expected, as a result of the morphological changes in the perennial ryegrass plants in response to these different systems, including (1) the proportion of free-leaf lamina, (2) the sward density and (3) the root density.
(1) In the kurzrasen system, the amount of lamina material per tiller (expressed as free-leaf lamina length per tiller (Figure 5c) was much smaller than the pre-grazing free-leaf lamina length of strip-grazing. However, the free-leaf lamina length for kurzrasen tended to be larger than the post-grazing free-leaf lamina length for strip-grazing. Furthermore, when the free-leaf lamina length is expressed as a proportion of the total tiller length, there is only a small difference between kurzrasen and pre-grazing strip-grazing, and the proportion of free-leaf lamina is significantly higher for kurzrasen compared to post-grazing strip-grazing. This might imply that the amount of photosynthetically active material just after defoliation is not limiting for the regrowth of the kurzrasen sward (but is even higher for kurzrasen compared to strip-grazing) and therefore the depletion of sugar reserves just after defoliation is smaller. At the same time, the kurzrasen tillers may not reach the stage in which the sugar reserves are actively replenished [31].
(2) Additionally, the kurzrasen system resulted in a much higher sward density, and the lower tiller productivity was partly compensated by an increase in the number of tillers, which is in line with [33], as discussed above.
(3) The root density at 10 and 20 cm soil depth tended to be lower for kurzrasen compared to strip-grazing. However, the differences tended to be small and only significant at 10 cm during April 2016. In general, the root density was high in comparison to measurements in the same region by [28]. Also, there was no evidence of a shift to more shallow soil layers for kurzrasen. This is in line with [34], who did not show a clear difference in root biomass at 0-10 cm soil depth when comparing kurzrasen to a rotational grazing system. Starz et al. [34] did report a slight shift in the proportion of roots in the top 5 cm from 0.99 for rotational grazing to 0.95 for kurzrasen. Generally, root mass shows a decline under high defoliation frequency and intensity [10], which could be related to the reduced availability of stored carbohydrates in the roots and stubble. For the kurzrasen system (in contrast to strip-grazing), the grass morphological measurements have shown that the herbage is never entirely dependent on stubble and root reserves, because there is always a relatively constant proportion of green lamina material present in the sward (Figure 5d), which, in combination with the higher sward density, may explain the lack of effect on root density. Indeed, [33] reported that the root biomass of grazed swards was larger under continuous grazing compared to rotational grazing, which was associated with a higher tiller density under continuous stocking. Moreover, the infrequent severe grass cuttings under rotational stocking lead to a standstill in root production of 25 to 45 days during the growing season as carbohydrate reserves and assimilates will in first instance predominantly be used to re-establish the shoot/root ratio [35].
In the current research we found no evidence of lower drought resistance under kurzrasen, i.e., the relative yield difference between the two systems did not increase during dry periods in September and October 2016 and April and May 2017 (Figure 4b). As discussed above, this may be related to the lower water requirement for growth at lower herbage production rates.

4.5. Herbage Quality

For kurzrasen, the herbage intake consists of young lamina material, whereas for strip-grazing, the average age of the plant material is higher and contains more sheath and stem material. The CP content is generally higher for lamina compared to sheath and stem material [36,37], whereas the water soluble carbohydrate (WSC), NDF and ADF content is generally lower [37,38]. Also, increased sward age results in a decrease in CP, whereas WSC, NDF and ADF show an increase with increasing sward age [31,37,39,40,41]. Chapman et al. [29] reported that the OM digestibility, CP and WSC content was higher for the newly emerged leaves, compared to older leaves, whereas NDF and ADF contents were lower. Therefore, the CP content, and digestibility is expected to be higher for kurzrasen compared to strip-grazing. Indeed, Starz et al. [9] reported higher net energy and CP content for simulated kurzrasen compared to rotational systems, whereas the reverse was found for NDF. In 2016, we found only a small difference in the nutritional value of the herbage for grazing between kurzrasen and strip-grazing, and differences were often in contrast with expectations: the CP content tended to be lower for kurzrasen and the ADF content was significantly higher for kurzrasen. This unexpected result was probably related to the sample collection method during 2016 (see material and methods), which was not representative of the actual plant parts (leaves) selected during grazing. Therefore, the sampling protocol was adjusted in 2017 (using hand scissors), and in 2017 we found a 13% increase in CP content for kurzrasen compared to strip-grazing, whereas the NDF and ADF content was significantly lower for kurzrasen compared to strip-grazing.
Additionally, the difference in botanical composition between the kurzrasen and strip-grazing fields may have affected the difference in nutritive value: the proportion of highly palatable grasses (perennial ryegrass and timothy) was lower for kurzrasen compared to strip-grazing. However, there is some evidence that the difference in nutritional value between highly palatable and less palatable grasses is less apparent at early plant growth stages [42]. As a result, the less favorable botanical composition of the kurzrasen fields, in which the grass is grazed at a very young stage of growth, is unlikely to have a large impact on nutritional value.
The current experiment was limited to two experimental years and the sample size was relatively small. While this is to a large extent the results of limitations associated with systems approach, it may have limited the power for statistical testing and the robustness of the responses.

5. Conclusions

  • In line with our hypotheses, kurzrasen showed a lower herbage dry matter production compared to strip-grazing. The yield penalty of using a shorter regrowth period under kurzrasen was limited due to the strong response in grass morphology, resulting in a dense and lamina-rich sward, even at very low stubble heights.
  • We found some evidence of a higher nutritional value of herbage under kurzrasen compared to strip-grazing and our results stress the importance of taking grass samples that are representative for the ingested herbage during grazing.
  • Sward density was higher for kurzrasen compared to strip-grazing, which had a positive impact on load bearing capacity.
  • There was a small decline in root density at 10 cm soil depth, but no evidence of a lower root density at 20 cm soil depth, and also, there was no evidence for a decrease in drought resistance under kurzrasen. This lack of response to the low stubble height and short regrowth length under kurzrasen may be related to the adjustments in herbage morphology.

Supplementary Materials

The following are available online at https://www.mdpi.com/2071-1050/11/22/6283/s1, Figure S1: Mean monthly temperature and precipitation in 2016 and 2017 compared to the long term average, Figure S2: The correlation between sward height before and after cutting, Figure S3: The penetration resistance (MPa) for the kurzrasen and strip-grazing systems during 2016 and 2017, Figure S4: Water infiltration rate (mm minute−1) for the kurzrasen (KR) and strip-grazing (SG) systems during 2016 and 2017, Table S1: Mean percentage of desirable grasses and dicots in the sward in April and December 2016 and October 2017 for kurzrasen and strip-grazing treatments, Table S2a: Correlation matrix showing the r and p-values of the correlations between sward and soil characteristics during the measuring periods in 2016. Table S2b: Correlation matrix showing the r and p-values of the correlations between sward and soil characteristics during the measuring periods in 2017.

Author Contributions

Conceptualization, R.S., B.P. and N.v.E.; Formal analysis, N.H.; Funding acquisition, B.P. and N.v.E.; Investigation, N.H. and K.v.H.; Methodology, N.H., G.H., K.v.R., K.v.H. and N.v.E.; Writing—original draft, N.H.; Writing—review & editing, G.H., R.S., B.P., K.v.R., K.v.H. and N.v.E.

Funding

This research was part of the project “Proeftuin Veenweide” and the public private cooperation program “Fodder production and Soil management” via the topsector Agri & Food (TKI-AF-15284 and TKI-AF-15102) (BO-31.03-010-001, BO-31.03-008-007). We received financial support from ZuivelNL, the province Zuid-Holland, the Dutch ministry of Economic Affairs, the Dutch Ministry of Agriculture, Nature and Food safety, the Dutch Melkveefonds and LTO Noord Fondsen.

Conflicts of Interest

The authors declare no conflict of interest. The funders had a role in the design of the study, but not in the collection, analyses, or interpretation of data; in the writing of the manuscript, or in the decision to publish the results.

References

  1. Boogaard, B.K.; Oosting, S.J.; Bock, B.B.; Wiskerke, J.S.C. The sociocultural sustainability of livestock farming: An inquiry into social perceptions of dairy farming. Animal 2011, 5, 1458–1466. [Google Scholar] [CrossRef] [PubMed]
  2. Reijs, J.W.; Daatselaar, C.H.G.; Helming, J.F.M.; Jager, J.; Beldman, A.C.G. Grazing dairy cows in north-west Europe. LEI Rep. 2013, 1, 1–124. [Google Scholar]
  3. CBS. Weidegang Van Melkvee 1997–2015; CBS: New York, NY, USA, 2018. [Google Scholar]
  4. CBS. Grotere Melkveebedrijven en Meer Melk; CBS: New York, NY, USA, 2017. [Google Scholar]
  5. van den Pol, A.; Aarts, H.; De Caesteker, E.; De Vliegher, A.; Elgersma, A.; Reheul, D.; Reijneveld, J.A.; Vaes, R. Grassland and forages in high output dairy farming systems. In Grassland and Forages in High Output Dairy Farming Systems; Wageningen Acad. Publ.: Wageningen, The Netherlands, 2015. [Google Scholar]
  6. Blokland, P.W.; van den Pol-van Dasselaar, A.; Rougoor, C.; van der Schans, F.; Sebek, L. Maatregelen om Weidegang te Bevorderen: Inventarisatie en Analyse; Wageningen Economic Research: The Hague, The Netherlands, 2017. [Google Scholar]
  7. Visscher, J.; Radersma, S.; van den Pol, A. Innovaties in Beweidingssystemen; Wageningen UR Livestock Research: Wageningen, The Netherlands, 2011. [Google Scholar]
  8. Holshof, G.; Zom, R.L.G.; van Eekeren, N. Amazing grazing: Effect of cutting height and defoliation frequency on grass production and feeding value. In Sustainable Meat and Milk Production from Grasslands, Proceedings of the 27th General Meeting of the European Grassland Federation, Cork, Ireland, 17–21 June 2018; Teagasc, Animal & Grassland Research and Innovation Centre: Moorepark, Ireland, 2018; pp. 237–239. [Google Scholar]
  9. Starz, W.; Kreuzer, J.; Steinwidder, A.; Pfister, R.; Rohrer, H. Ernte-und Qualitätserträge einer simulierten Kurzrasen-und Koppelweide bei trockenheitsgefährdetem Dauergrünland. In Proceedings of the 4th International Conference on Organic Agriculture Sciences (ICOAS), Budapest, Hungary, 9–13 October 2013. [Google Scholar]
  10. Dawson, L.A.; Grayston, S.J.; Paterson, E. Effects of grazing on the roots and rhizosphere of grasses. In Grassland Ecophysiology and Grazing Ecology; Lemaire, G., Hodgson, J., de Moraes, A., Nabinger, C., Carvalho, P.C.d., Eds.; CABI: Wallingford, UK, 2000; pp. 61–84. [Google Scholar]
  11. Ernst, P.; le Du, Y.L.P.; Carlier, L. Animal and sward production under rotational and continuous grazing management-a critical appraisal. In Animal and Sward Production under Rotational and Continuous Grazing Management-A Critical Appraisal; Wageningen, Centre for Agricultural Publishing and Documentation: Wageningen, The Netherlands, 1980; pp. 119–126. [Google Scholar]
  12. Sprangers, J.; Arp, W.J. Toetsingsparameters dijkgrasland. In IBN-Rapport; IBN-DLO: Wageningen, The Netherlands, 1999. [Google Scholar]
  13. Klootwijk, C.W.; Holshof, G.; Van den Pol-van Dasselaar, A.; van Helvoort, K.L.; Engel, B.; de Boer, I.J.; van Middelaar, C.E. The effect of intensive grazing systems on the rising plate meter calibration for perennial ryegrass pastures. J. Dairy Sci. 2019, 102, 10439–10450. [Google Scholar] [CrossRef] [PubMed]
  14. Nedap, Nedap CowControl-Know Your Cow, Control Your Herd, Improve Your Dairy. Available online: https://www.nedap-livestockmanagement.com/dairy-farming/solutions/nedap-cowcontrol/ (accessed on 20 September 2019).
  15. Core Team, R. R: A Language and Environment for Statistical Computing; R Foundation for Statistical Computing: Vienna, Austria, 2015. [Google Scholar]
  16. Beuving, J.; Oostindie, K.; Vellinga, T. Vertrappingsverliezen Door Onvoldoende Draagkracht Van Veengrasland; Staring Centrum: Wageningen, The Netherlands, 1989. [Google Scholar]
  17. Bilotta, G.S.; Brazier, R.E.; Haygarth, P.M. The Impacts of Grazing Animals on the Quality of Soils, Vegetation, and Surface Waters in Intensively Managed Grasslands. In Advances in Agronomy; Elsevier: Amsterdam, The Netherlands, 2007; Volume 94, pp. 237–280. [Google Scholar]
  18. Angers, D.A.; Caron, J. Plant-induced changes in soil structure: Processes and feedbacks. Biogeochemistry 1998, 42, 55–72. [Google Scholar] [CrossRef]
  19. Veldhuis, M.P.; Howison, R.A.; Fokkema, R.W.; Tielens, E.; Olff, H. A novel mechanism for grazing lawn formation: Large herbivore-induced modification of the plant–soil water balance. J. Ecol. 2014, 102, 1506–1517. [Google Scholar] [CrossRef]
  20. Makkink, G.F. Vijf Jaren Lysimeteronderzoek: Een Hydrologische Studie; Pudoc: Ilocos Sur, Philippines, 1962. [Google Scholar]
  21. Donkor, N.T.; Gedir, J.V.; Hudson, R.J.; Bork, E.W.; Chanasyk, D.S.; Naeth, M.A. Impacts of grazing systems on soil compaction and pasture production in Alberta. Can. J. Soil Sci. 2002, 82, 1–8. [Google Scholar] [CrossRef] [Green Version]
  22. Chapman, D.F.; Clark, D.A.; Land, C.A.; Dymock, N. Leaf and tiller growth of Lolium perenne and Agrostis spp. and leaf appearance rates of Trifolium repens in set-stocked and rotationally grazed hill pastures. N. Z. J. Agric. Res. 1983, 26, 159–168. [Google Scholar] [CrossRef]
  23. McNaughton, S.J. Grazing as an optimization process: Grass-ungulate relationships in the Serengeti. Am. Nat. 1979, 113, 691–703. [Google Scholar] [CrossRef]
  24. Bryant, H.T.; Blaser, R.E.; Peterson, J.R. Effect of Trampling by Cattle on Bluegrass Yield and Soil Compaction of a Meadowville Loam 1. Agron. J. 1972, 64, 331–334. [Google Scholar] [CrossRef]
  25. Langlands, J.P.; Bennett, I.L. Stocking intensity and pastoral production: I. Changes in the soil and vegetation of a sown pasture grazed by sheep at different stocking rates. J. Agric. Sci. 1973, 81, 193–204. [Google Scholar] [CrossRef]
  26. Mulholland, B.; Fullen, M.A. Cattle trampling and soil compaction on loamy sands. Soil Use Manag. 1991, 7, 189–193. [Google Scholar] [CrossRef]
  27. Willatt, S.T.; Pullar, D.M. Changes in soil physical properties under grazed pastures. Soil Res. 1984, 22, 343–348. [Google Scholar] [CrossRef]
  28. Deru, J.G.; Bloem, J.; de Goede, R.; Keidel, H.; Kloen, H.; Rutgers, M.; van den Akker, J.; Brussaard, L.; van Eekeren, N. Soil ecology and ecosystem services of dairy and semi-natural grasslands on peat. Appl. Soil Ecol. 2018, 125, 26–34. [Google Scholar] [CrossRef]
  29. Chapman, D.F.; Tharmaraj, J.; Agnusdei, M.; Hill, J. Regrowth dynamics and grazing decision rules: Further analysis for dairy production systems based on perennial ryegrass (Lolium perenne L.) pastures. Grass Forage Sci. 2012, 67, 77–95. [Google Scholar] [CrossRef]
  30. Lee, J.M.; Donaghy, D.J.; Roche, J.R. Effect of Defoliation Severity on Regrowth and Nutritive Value of Perennial Ryegrass Dominant Swards. Agron. J. 2008, 100, 308. [Google Scholar] [CrossRef]
  31. Fulkerson, W.J.; Donaghy, D.J. Plant-soluble carbohydrate reserves and senescence-key criteria for developing an effective grazing management system for ryegrass-based pastures: A review. Anim. Prod. Sci. 2001, 41, 261–275. [Google Scholar] [CrossRef]
  32. Donaghy, D.J.; Fulkerson, W.J. The importance of water-soluble carbohydrate reserves on regrowth and root growth of Lolium perenne (L). Grass Forage Sci. 1997, 52, 401–407. [Google Scholar] [CrossRef]
  33. Lantinga, E.A. Relaties tussen zodedichtheid en produktiviteit van grasland. Gebundelde Verslagen Nederlandse Vereniging van Weide- en Voederbouw 1987, 27, 25–32. [Google Scholar]
  34. Starz, W.; Steinwidder, A.; Pfister, R.; Rohrer, H. Einfluss von Koppel-und Kurzrasenweide auf die Wurzelmassen im Vegetationsverlauf. Österr. Fachtag. Für Biol. Landwirtsch. 2016, 65–68. [Google Scholar]
  35. Crider, F. Root-Growth Stoppage Resulting from Defoliation of Grass; US Department of Agriculture: Washington, DC, USA, 1955.
  36. Grindlay, D.J.C. Towards an explanation of crop nitrogen demand based on the optimization of leaf nitrogen per unit leaf area. J. Agric. Sci. 1997, 128, 377–396. [Google Scholar] [CrossRef]
  37. Hoekstra, N.J.; Struik, P.C.; Lantinga, E.A.; Schulte, R.P.O. Chemical composition of lamina and sheath of Lolium perenne as affected by herbage management. Njas-Wagening. J. Life Sci. 2007, 55, 55–73. [Google Scholar] [CrossRef] [Green Version]
  38. Smith, K.F.; Culvenor, R.A.; Humphreys, M.O.; Simpson, R.J. Growth and carbon partitioning in perennial ryegrass (Lolium perenne) cultivars selected for high water-soluble carbohydrate concentrations. J. Agric. Sci. 2002, 138, 375–385. [Google Scholar] [CrossRef]
  39. Wilman, D.; Daly, M.; Koocheki, A.; Lwoga, A.B. The effect of interval between harvests and nitrogen application on the proportion and digestibility of cell wall, cellulose, hemicellulose and lignin and on the proportion of lignified tissue in leaf cross-section in two perennial ryegrass varieties. J. Agric. Sci. 1977, 89, 53–63. [Google Scholar] [CrossRef]
  40. Wilson, J.R. Cell wall characteristics in relation to forage digestion by ruminants. J. Agric. Sci. 1994, 122, 173–182. [Google Scholar] [CrossRef]
  41. Nowakowski, T.Z. Effects of nitrogen fertilizers on total nitrogen, soluble nitrogen and soluble carbohydrate contents of grass. J. Agric. Sci. 1962, 59, 387–392. [Google Scholar] [CrossRef]
  42. Distel, R.A.; Didoné, N.G.; Moretto, A.S. Variations in chemical composition associated with tissue aging in palatable and unpalatable grasses native to central Argentina. J. Arid Environ. 2005, 62, 351–357. [Google Scholar] [CrossRef]
Figure 1. The load bearing capacity (MPa) for the kurzrasen and strip-grazing systems during 2016 and 2017. Error bar = 2 x standard error (SE), n = 4. Significant differences or trends between the grazing systems are denoted by * (p < 0.05) or (p < 0.1).
Sustainability 11 06283 g001
Figure 2. The soil moisture content (% of wet soil weight) for the kurzrasen and strip-grazing systems during 2016 and 2017. Error bar = 2 x standard error (SE), n = 4.
Sustainability 11 06283 g002
Figure 3. Root tip density (number dm−2) at (a) 10 and (b) 20 cm soil depth and (c) the proportion of the total number of root tips found at 10 cm soil depth for the kurzrasen and strip-grazing systems during 2016 and 2017. Error bar = 2SE, n = 4. Significant differences between systems are indicated by * (p < 0.05).
Sustainability 11 06283 g003
Figure 4. Mean (a) weekly pre- and post-grazing sward height and (b) herbage dry matter growth rate (kg DM ha−1 day−1) of the grazed area throughout the grazing season for kurzrasen (KR) and strip-grazing (SG) systems in 2016 and 2017 (n = 2, Error bars = 1 standard deviation (SD).
Sustainability 11 06283 g004
Figure 5. Morphological measurements of perennial ryegrass tillers in the kurzrasen ( Sustainability 11 06283 i001) and strip-grazing pre-grazing ( Sustainability 11 06283 i002) and post-grazing ( Sustainability 11 06283 i003
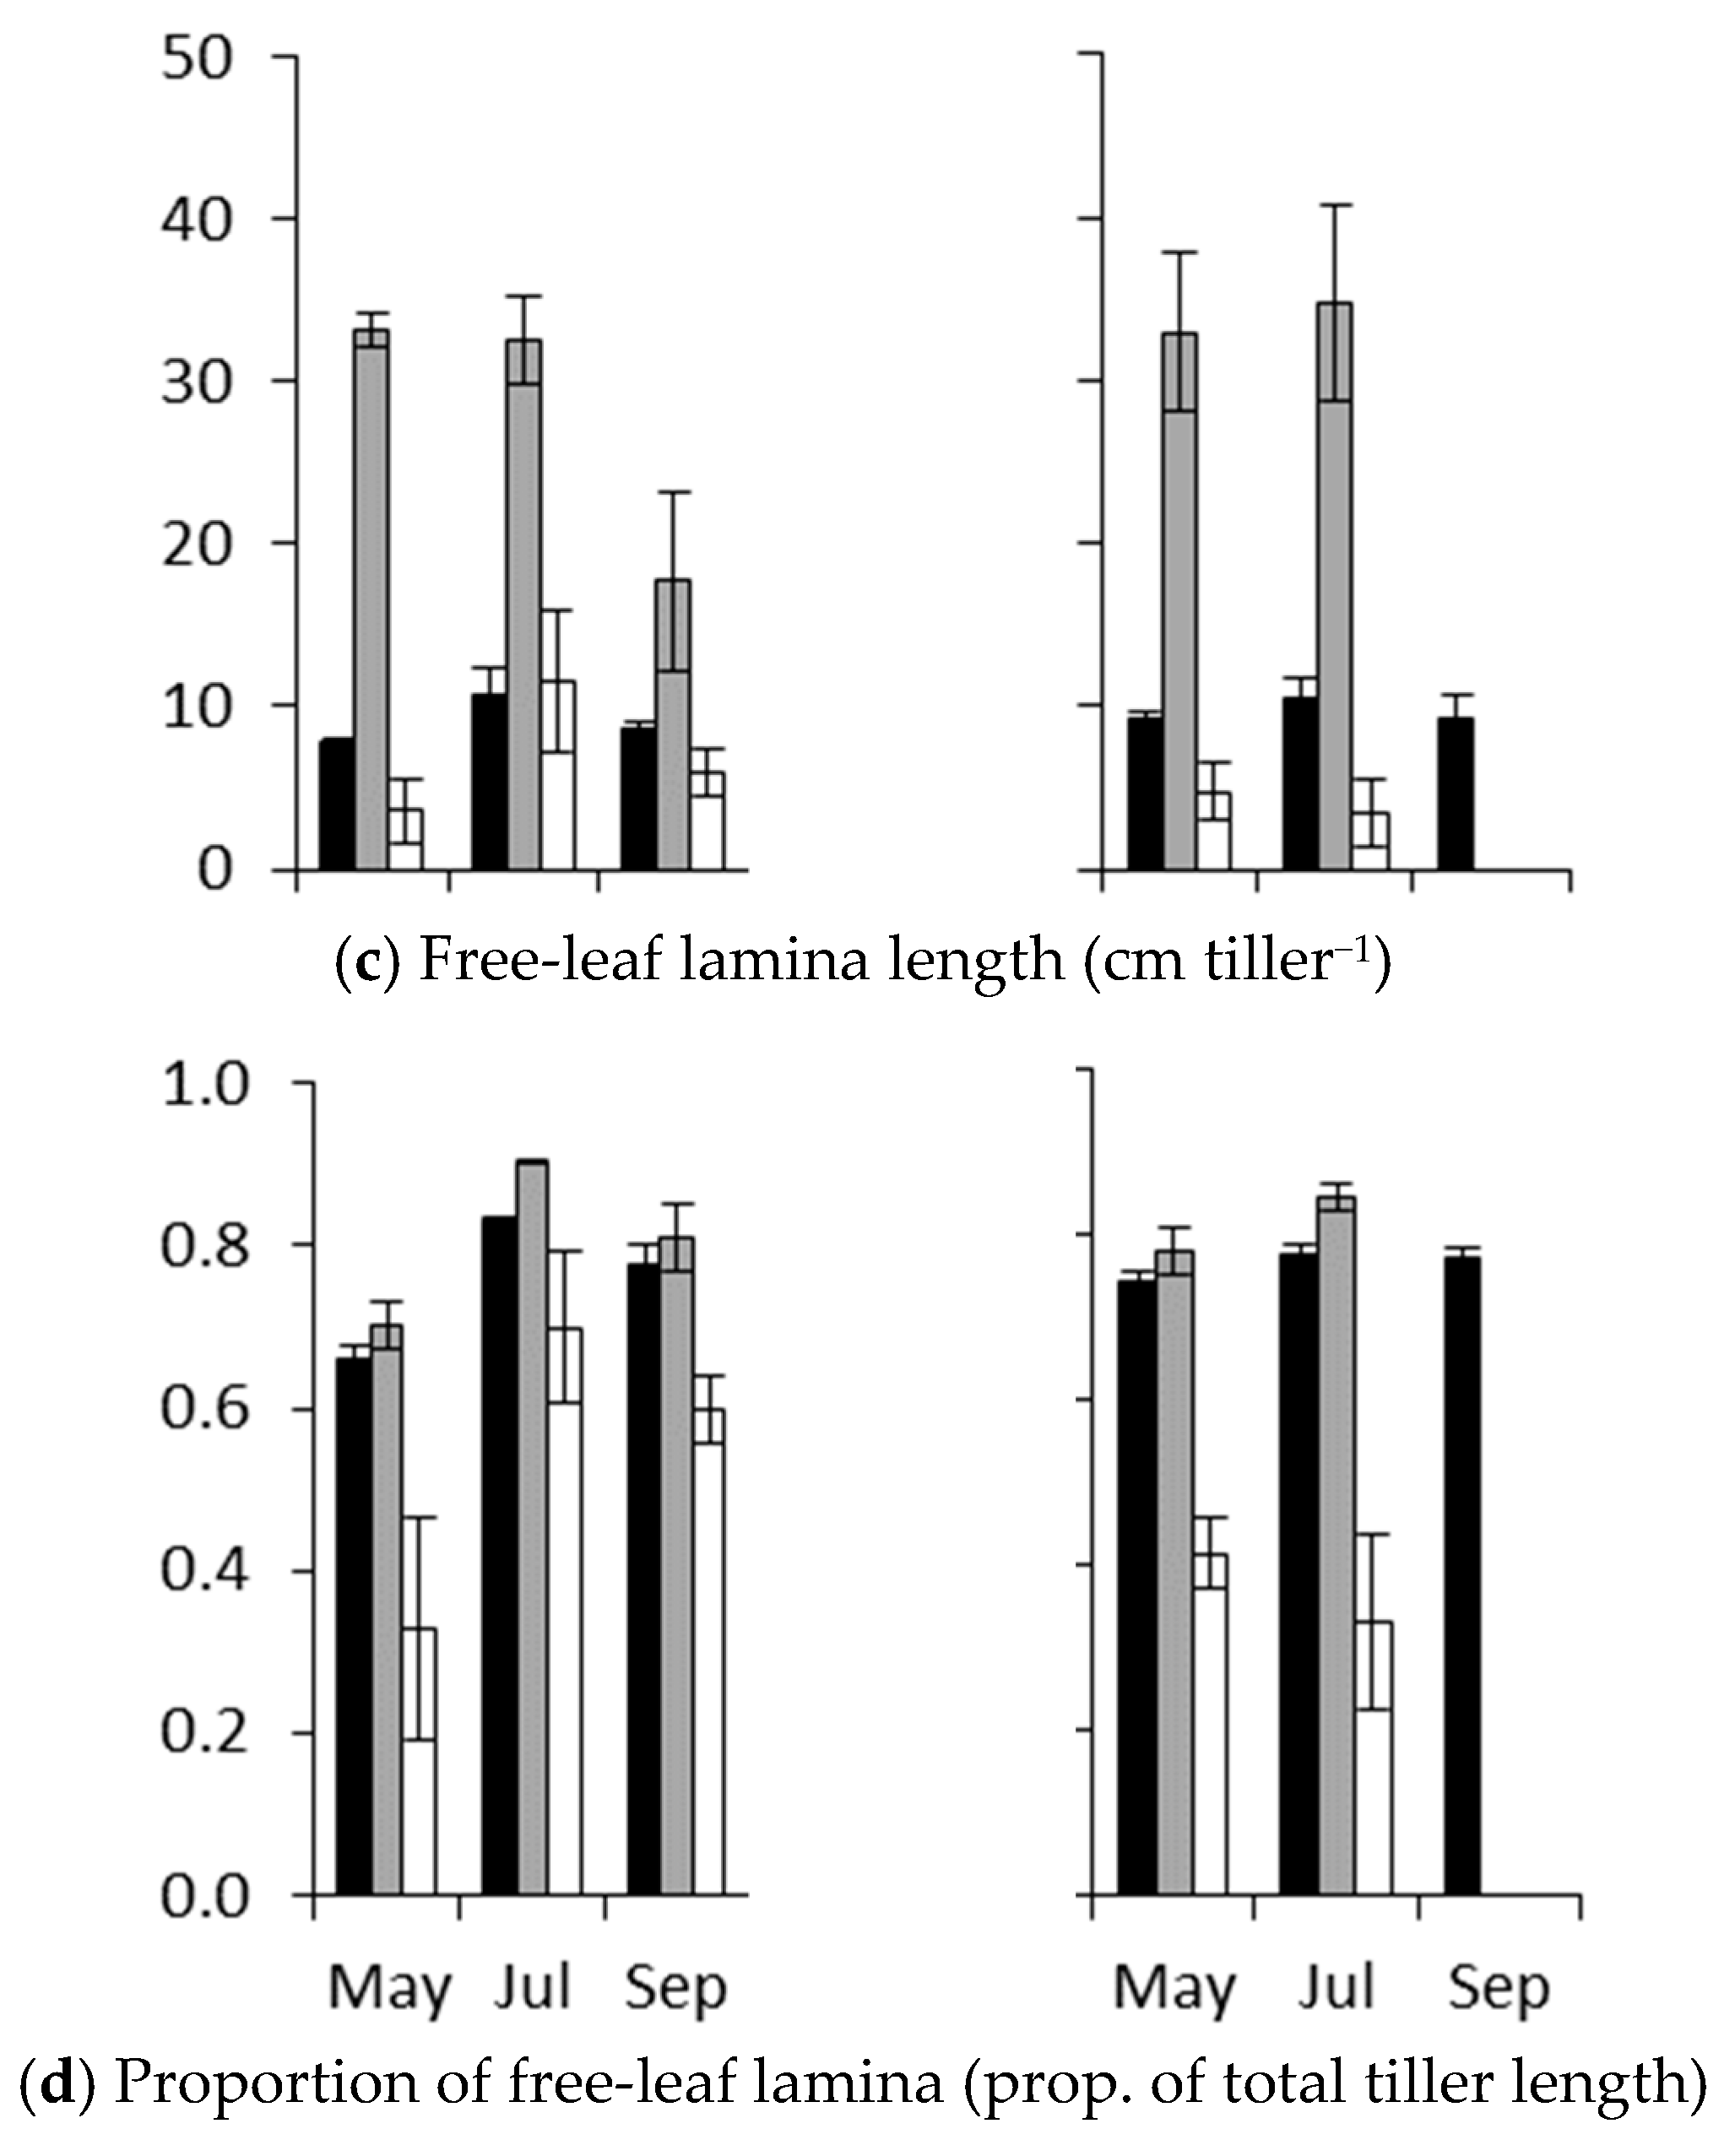
) systems (n = 2, error bars = 2SE). (a) The total number of leaves per tiller, (b) Number of ungrazed leaves per tiller, (c) The total free-leaf lamina length and (d) The proportion of free-leaf lamina (proportion of total tiller length).
Sustainability 11 06283 g005aSustainability 11 06283 g005b
Figure 6. Mean proportional sward cover (sward density) as measured with the point quadrat method for the kurzrasen and strip-grazing systems during 2016 and 2017. Error bars = 2SE, n = 4. Significant differences between the grazing systems are denoted by * = p < 0.05; ** = p < 0.01; *** = p < 0.001.
Sustainability 11 06283 g006
Figure 7. Correlations between load bearing capacity and (a) soil moisture content and (b) sward density (proportion sward cover) during March/April, May, July, September and October/November, during 2016 and 2017. Regression lines indicate significant (p < 0.05) correlations or trends (p < 0.1). Correlation coefficients (r) and p values are presented in the table (p < 0.1; * = p < 0.05; ** = p < 0.01); n.a. is not applicable.
Sustainability 11 06283 g007
Table 1. Mean herbage grass growth (kg DM ha−1 d−1) 1, cumulative herbage growth (kg DM ha−1) and herbage chemical composition (g kg−1 DM) for kurzrasen and strip-grazing grazed swards during 2016 and 2017 (n = 2, SD in brackets).
20162017
KRSGp-ValueKRSGp-Value 2
Mean herbage growth rate33(0.8)44(0.3)**46(0.1)59(0.1)***
Cum. herbage growth pasture 37398(389)8837(61)0.0710,425(125)12,834(125)**
Herbage chemical composition (g kg−1 DM) 4
Crude protein186(2.6)192(5.8)ns257(6.3)228(0.8)*
VEM 860(11)988(0.9)**1028(3.6)1011(1.3)*
DVE86(1.6)97(1.6)*114(1.8)104(0.2)*
OM digestibility (% OM)75(0.7)81(0.1)*85(0.3)84(0.1)0.08
Sugar121(0.3)140(8.3)ns123(7.7)125(0.9)ns
Ash111(0.2)90(1.2)**94(2.4)92(0.6)ns
NDF483(4.1)494(3.2)ns463(2.0)487(1.0)**
ADF235(1.7)252(0.4)*208(0.5)236(0.7)**
ADL25(0.6)20(0.5)*20(0.5)19(0.0)ns
1 The mean herbage growth rate based on weekly sward height measurements (underneath cages for kurzrasen), from 8 May to 21 October in 2016 and from 27 March to 26 October in 2017 on the grazed area. See materials and methods for details. 2 p-value for comparison of grazing systems within year. * = p < 0.05; ** = p < 0.01; *** = p < 0.001; ns = not significant; 3 Potential cumulative herbage growth on the grazed area, assuming that the whole area is only used for grazing. This includes herbage available at the start of the grazing season. 4 VEM = feed unit milk; DVE = true protein digested in the small intestine; OM = organic matter; NDF = neutral detergent fiber; ADF = acid detergent fiber; ADL = acid detergent lignin.

