1. Introduction
Carbon materials play a crucial role in sorbents and heterogeneous catalysis [
1,
2,
3,
4]. A supported heterogeneous catalyst consists of a support on which an active phase has been dispersed and optionally some promoters have been added. The support can play a prime role in determining catalytic activity and selectivity. It can do so by influencing the electronic structure of the active phase by changing its density of states [
5,
6,
7] or its dispersion [
8]. In addition, support acidity may affect the product distribution by affecting the orientation of molecule adsorption [
9]. Moreover the physical properties of the support (e.g., pore size) may influence the diffusion of reactant and product molecules to and from the active sites [
10].
Activated carbon (AC) is the workhorse among the carbon based catalyst supports [
11,
12,
13]. Activated carbon supports contain layers of graphene with curved sections and pronounced cross-linking. These carbons have micropores and, depending on the precursor used to make it, may also have mesopores and macropores [
14]. Activated carbon presents several advantages as a support for catalysts, such as low synthesis cost, high specific surface area, resistance to acidic and alkaline environments, easy control of textural properties (pore volume and pore size distribution) and thermal stability. On the other hand, activated carbon has low mechanical strength and, because it is mostly microporous, may impose mass transfer limitations [
15]. Other carbon materials, such as carbon nanofibers, have larger pores than microporous activated carbon and consequently are less associated with mass transfer limitations.
Carbon nanofibers (CNF) supports contain organized graphene sheets in their structure and have the beneficial properties of both activated carbon and graphite. Carbon nanofibers have desirable characteristics for use as catalyst support, such as high specific surface area, purity, inertness and, are mesoporous thus allowing easy diffusion of reactant and product molecules [
16]. Carbon nanofibers have been used as catalyst support for different reactions, such as cinnamaldehyde hydrogenation [
9,
17] and deoxygenation of triglycerides [
18,
19,
20].
Another promising carbon-based material for use as catalyst support is carbon-covered alumina (CCA). Alumina (aluminum oxide) already is a widely used material as catalyst support because of its mechanical and textural properties; however it has some drawbacks, mainly its strong interaction with metals which can result in a loss of the active (metal) phase. To overcome this drawback, alumina can be covered with a thin carbon layer to result in CCA. As a consequence CCA combines the mechanical and textural properties of alumina with the surface chemistry of carbon [
21]. The first time CCA was used as catalyst support it was synthesized via the pyrolysis of cyclohexane or ethene over the γ-Al
2O
3 surface [
15]. This material was used as support for cobalt sulfide and tested in the thiophene hydrodesulfurization reaction [
15]. Although X-ray photoelectron spectroscopy results showed that alumina was not fully covered by carbon, the catalyst supported on CCA was three times more active than the catalyst supported on γ-Al
2O
3 [
15], demonstrating that CCA is a promising material in the catalysis field.
Although AC, CNF and CCA are effective supports for various catalysts and reactions, these three carbon-based materials have never been directly compared in the same reaction conditions and with the same active phase, as far as we know. In this paper, we report on an evaluation of the effects of these three different carbon-based supports (activated carbon, carbon nanofibers and carbon-covered alumina) on the structure and deoxygenation performance of tungsten carbide. Tungsten carbide is an active catalyst for reactions that involve the transfer of hydrogen [
22,
23], as is the case in fatty acid deoxygenation reactions, and it is considered a potential replacement for the scarce and expensive noble metal. Here, we characterized the catalysts by means of N
2 sorption, X-ray diffraction, CO chemisorption as well as temperature-programmed desorption of NH
3, and we used the deoxygenation of stearic acid to evaluate catalyst performance. We analyzed the effect of the support on tungsten carbide activity and selectivity in stearic acid deoxygenation by correlating catalyst performance with structure. The stearic acid is a representative model molecule of triglycerides/vegetable oil present in biomass [
24,
25].
2. Materials and Methods
2.1. Synthesis of Supports
Carbon nanofibers (CNF) were synthesized using a reduced 5 wt % Ni/SiO
2 growth catalyst (5 g) and a mixture of hydrogen (102 mL·min
−1), nitrogen (450 mL·min
−1) and carbon monoxide (266 mL·min
−1) at 550 °C and 3.8 bar for 24 h, as previously reported [
26]. After synthesis, the CNF were refluxed in 400 mL 1M KOH for 1 h to remove the SiO
2, followed by decanting and washing of the residue with 200 mL 1M KOH. This treatment was repeated three times. After the final reflux, the material was washed with demi water. Subsequently, the solid was treated by refluxing it in 400 mL 65% HNO
3 for 1.5 h to remove exposed nickel and to add oxygen-containing groups on the surface of the CNF. Finally, the CNF were washed with demi water to a neutral pH of the washing water.
Carbon-covered alumina (CCA) was synthesized as follows. A sucrose solution was added to alumina (BASF) via incipient wetness impregnation (weight sucrose/alumina = 0.624). A calcination step was carried out under He flow at 700 °C for 2 h to form two (theoretical) monolayers of carbon covering the alumina. The procedure was repeated to add another (theoretical) carbon monolayer (weight sucrose/alumina = 0.380) over the previous two layers.
2.2. Catalyst Synthesis
W
2C catalysts (15 wt %) were synthesized via incipient wetness impregnation of (NH
4)
6H
2W
12O
40·xH
2O (Sigma-Aldrich) solution on the supports—AC (Activated charcoal Norit®, Sigma-Aldrich), CNF and CCA. After each impregnation (total of three), the materials were dried at 120 °C for 1 h in static air. When the whole solution was impregnated, the catalysts were activated under argon flow from 25 °C to 900 °C (
β = 5 °C·min
−1) for 6 h. To allow a direct comparison with earlier works we kept the synthesis conditions the same as in [
19] even though these conditions can be improved with respect to holding times and gas use.
2.3. Catalyst Characterization
X-Ray diffraction (XRD) was used to explore the crystalline structures of the sample by using a Rigaku Miniflex instrument with copper radiation (CuKα). The diffraction angle was varied from 10° to 90°, with steps of 1 degree·min−1 and counting at 2 s·step−1.
Nitrogen physisorption was used to assess the textural properties of the catalysts. Nitrogen adsorption/desorption isotherms were recorded at liquid nitrogen temperature using a Micromeritics TriStar. Before the measurement, samples were pretreated under a vacuum at 200 °C for 20 h (Micromeritics VacPrep 061).
Chemisorbed CO was measured in situ to quantify potential active sites. After synthesis, we flushed the catalyst samples with 50 mL·min−1 helium at 30 °C for 30 min. CO-pulse chemisorption measurements were performed using a custom-made multipurpose machine by pulsing calibrated volumes of a 20% (v/v) CO/He gas mixture over the catalyst. Mass spectrometry (Pfeiffer Vacuum, model D-35614 Asslar) was used to assess the CO uptake.
Temperature-programmed desorption (TPD) of CO was performed after the CO chemisorption to explore the nature of the active sites. Samples were heated from 30 °C to 1000 °C under He flow (100 mL·min−1 and β = 15 °C·min−1) and the ion signal of m/z = 28 was followed in a mass spectrometer (Pfeiffer Vacuum, model D-35614 Asslar).
Transmission electron microscopy (TEM) was used to analyze particle size and particle size distribution. We mounted the samples on a 200 mesh copper grid covered with a pure carbon film, by dusting them onto the surface of the grid. TEM was performed in a JEOL JEM2100 transmission electron microscope operated at 200 kV, and images (4k × 4k) were taken with a Gatan US4000 camera.
Temperature-programmed desorption (TPD) of NH3 was performed to explore the acidity of catalysts. The total acid sites of catalysts were quantified by adsorption of a 4% (v/v) NH3/He gas mixture at room temperature, performed in a custom-made machine, where the ion signals m/z = 17 was followed in a mass spectrometer (Pfeiffer Vacuum, model D-35614 Asslar). After purging the synthesized carbides with He (60 mL·min−1), 4% (v/v) NH3/He (60 mL·min−1) gas mixture was added to the system resulting in a negative peak (A1) in the ion signal m/z = 17, corresponding to chemisorbed NH3 + physisorbed NH3 + NH3 in the system dead volume. After the ion signal m/z = 17 returned to the baseline, He was flushed into the system to remove the physisorbed NH3 from the catalyst surface and the NH3 present in the system dead volume. A 4% (v/v) NH3/He (60 mL·min−1) gas mixture was, flushed again into the system resulting in another negative peak (A2) in the ion signal m/z = 17, representing the physisorbed NH3 and the NH3 present in the system dead volume. Therefore, the amount of chemisorbed NH3 on the catalysts was calculated via the subtraction of the areas A1–A2.
To explore the efficiency of the carbon cover in CCA, we carried out Diffuse Reflectance Infrared Fourier Transform Spectroscopy (DRIFTS) in an infrared spectrometer (Nicolet NEXUS 470 FT-IR) equipped with diffuse reflectance accessories and heating chamber (MCT-A detector, cooled with liquid nitrogen and with ZnSe windows). Prior to analysis, samples were heated to 500 °C for 1 h under He flow and cooled to room temperature. Samples were then saturated with CO2, the chamber was cleaned with He to remove non-adsorbed CO2, and the spectrum was taken in the range of 4000 cm−1 to 500 cm−1 with a resolution of 4 cm−1 and 150 scans.
2.4. Hydrodeoxygenation Reaction
Reactions were performed in a 100 mL stainless steel Parr autoclave reactor (4590 Micro Bench Top Reactors). The reactor was filled with 2 g of stearic acid (Sigma-Aldrich, ≥95%, FCC, FG), 1 g of tetradecane (internal standard, Sigma-Aldrich, ≥99%), 0.25 g of catalyst and 50 mL of dodecane as solvent (Sigma-Aldrich, ReagentPlus®, ≥99%). After purging with argon, stirring at 800 rpm was started and the reactor was heated to 350 °C. At this temperature, the total pressure was 10 bar. Subsequently, 30 bar H2 was added to the system, reaching a final pressure of around 40 bar. Samples of 1 mL were taken during the 6-h reaction after 0, 20, 40, 60, 120, 180, 240, 300 and 360 min.
Gas chromatography (GC) was used to analyze the reaction mixture (Shimadzu 2014, equipped with CP-FFAP column and photoionization detector). We used the following column temperature program: 50 °C for 1 min, heating to 170 °C (β = 7 °C·min−1), dwell time 1 min, ramp to 240 °C (β = 4 °C·min−1), dwell time 15 min. Prior to GC, we diluted the samples in CH3Cl:MeOH (2:1 v/v). Trimethylsulphonium hydroxide (Sigma-Aldrich, ~0.25 M in methanol, for GC derivatization) was added to methylate free acids. The injected volume was 1 µL for all analysis.
3. Results and Discussion
Table 1 displays textural properties of the pure supports (activated carbon—AC, carbon-covered alumina—CCA and carbon nanofibers—CNF) and of the three supported W
2C catalysts as inferred from nitrogen physisorption.
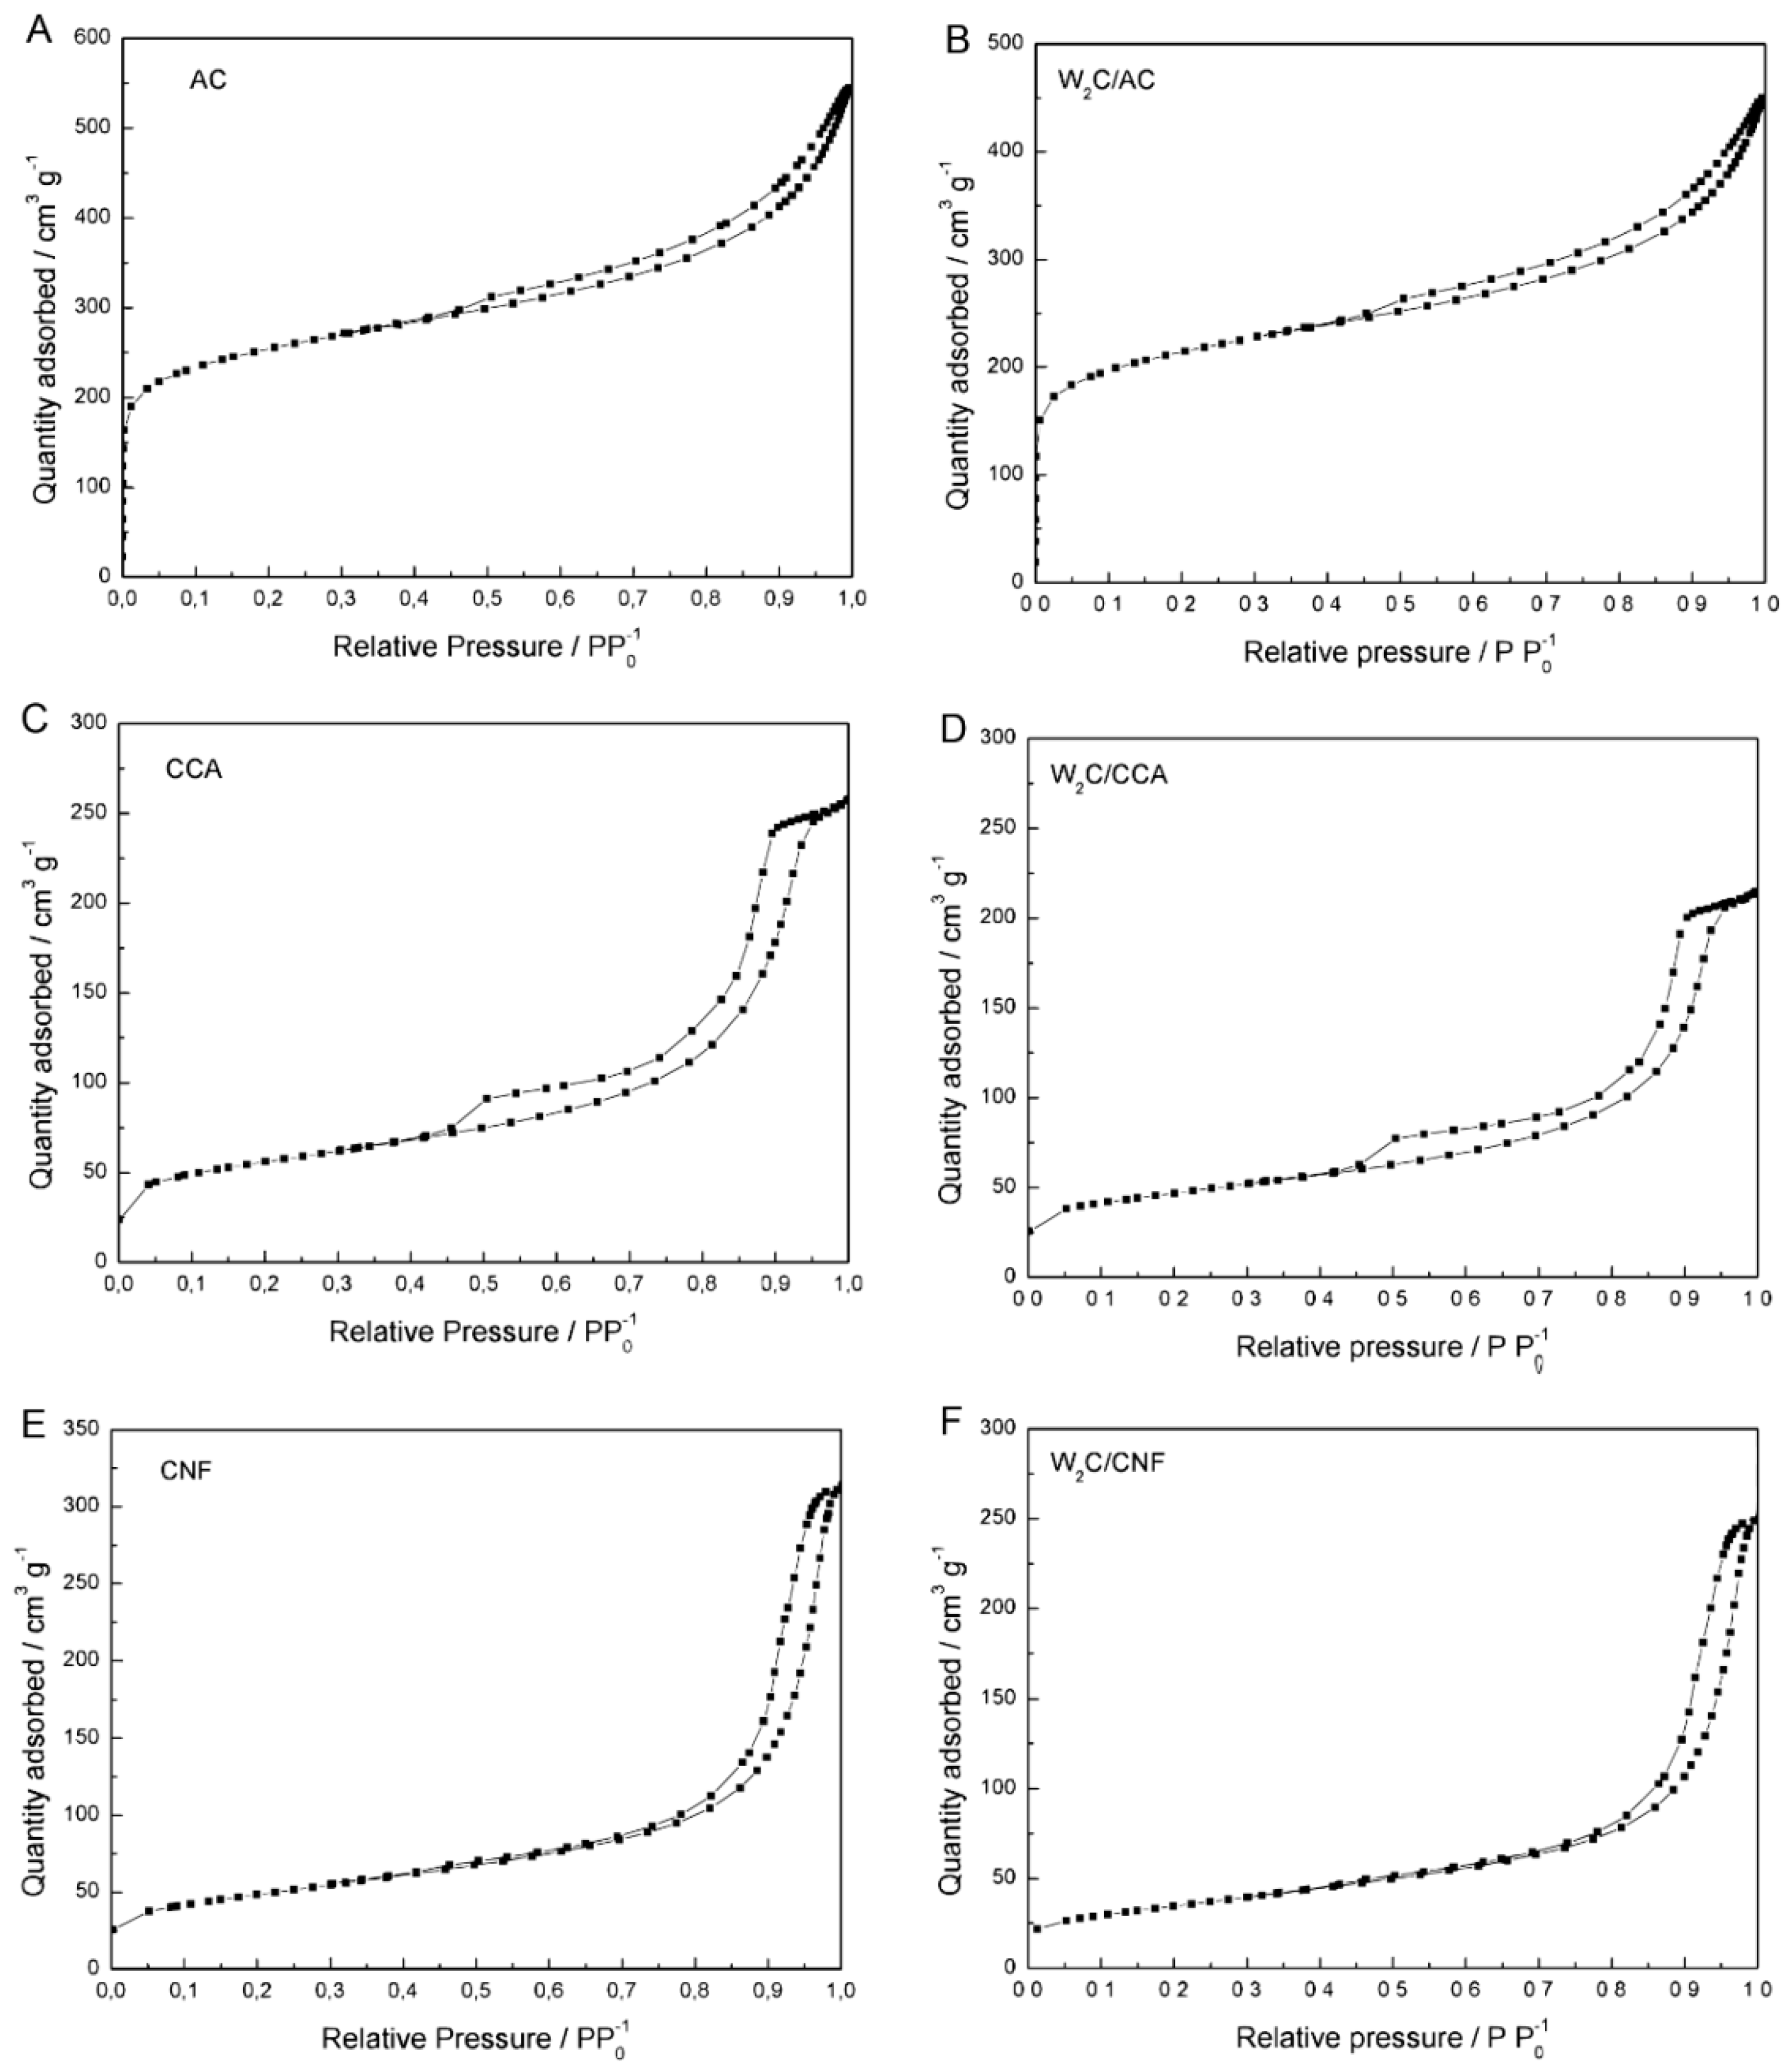
Figure A1 in
Appendix A shows nitrogen adsorption/desorption isotherms for the pure supports and the supported W
2C catalysts.
AC presented a higher specific surface area (823 m2·g−1) compared with CCA (193 m2·g−1) and CNF (171 m2·g−1). AC also showed a higher micropore area and volume (394 m2·g−1 and 200 × 10−9 m3·g−1) than the other supports CCA (44 m2·g−1 and 20 × 10−9 m3·g−1) and CNF (20 m2·g−1 and 9 × 10⁻⁹ m3·g−1). On the other hand, CNF had a larger pore size than AC and CCA (CNF: 15.1 nm, AC: 8.7 nm and CCA: 9.3 nm). These results indicate that the supports had significant differences in textural properties, especially regarding surface area and pore size.
The specific Brunauer-Emmett-Teller (BET) surface area of W2C/AC and W2C/CCA was around 15% lower than for the pure supports. Since these catalysts were synthesized with a 15 wt % loading, a decrease of up to 15% of the surface area can be attributed to the carbide addition to the support. Thus, W2C/AC and W2C/CCA presented similar textural surface areas as the respective pure supports.
On the other hand, the specific surface area, micropore area and micropore volume values of W2C/CNF (124 m2·g−1, 7 m2·g−1 and 3 × 10⁻⁹ m3·g−1) are smaller than for pure CNF (171 m2·g−1, 20 m2·g−1 and 9 × 10⁻⁹ m3·g−1), even when considering that 15% of active phase had been added to the support. These results suggest that some micropores of the CNF were blocked during W2C/CNF synthesis. However, since total pore volume and pore average size of W2C/CNF (370 × 10−9 m3·g−1 and 15.1 nm) were similar to those of the pure CNF (450 × 10−9 m3·g−1 and 15.1 nm), taking a margin of 15% into account, we conclude that although micropores might be blocked during W2C/CNF synthesis, larger pores in the support were still present in the catalyst structure.
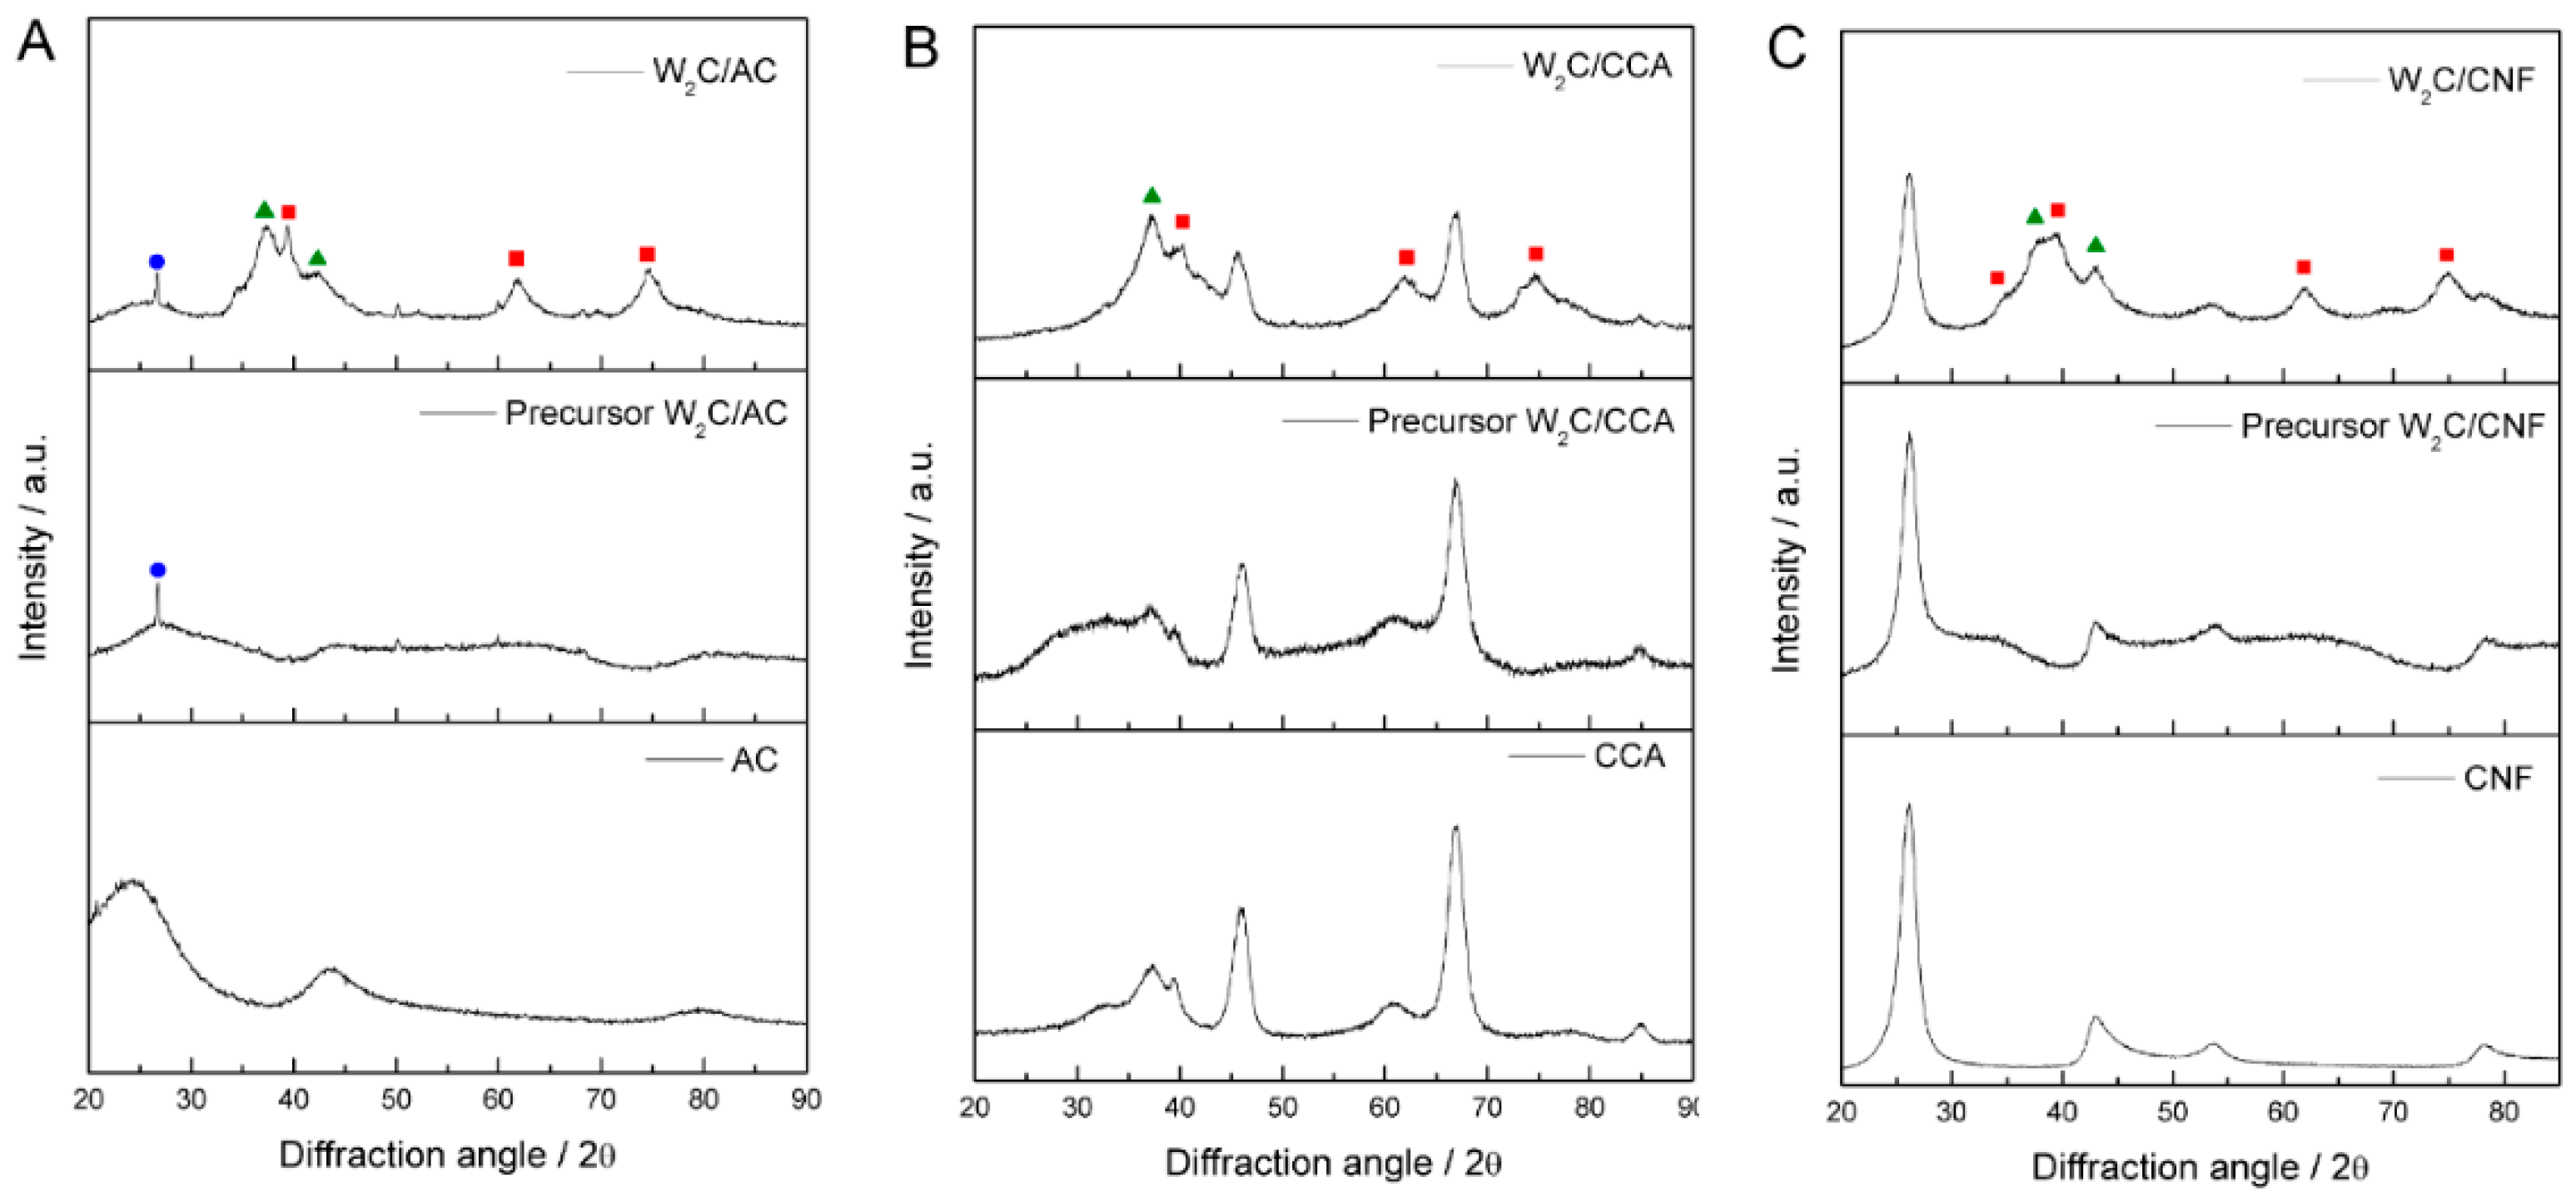
To investigate the crystalline structure of the catalysts, we used X-ray diffraction (XRD).
Figure 1A–C) presents the diffractograms of W
2C supported on AC, CCA and CNF, with the respective precursors and pure supports.
The diffractograms of W2C supported on AC, CNF and CCA show peaks at 2θ values of 36.8° and 42.7°, which correspond to the oxy-carbide W2(C,O) phase (PDF#22-0959), indicated by the green triangles, as well as peaks at a 2θ of 39.6°, 61.7° and 72.7°, which correspond to the W2C phase (PDF#20-1315), indicated by the red squares. Since the catalysts were passivated with 0.5% (v/v) O2/N2 (50 mL·min−1) at 25 °C for 24 h before XRD analysis to avoid their complete oxidation when exposed to air, we attribute the presence of the oxy-carbide phase to partial oxidation of catalyst during the passivation treatment.
The diffractograms of W2C/AC and its precursor present a small peak at 2θ value of 26°, which is unexplained. It could be a contamination (SiO2) or a recrystallization of carbon species, though that is unlikely at these temperatures.
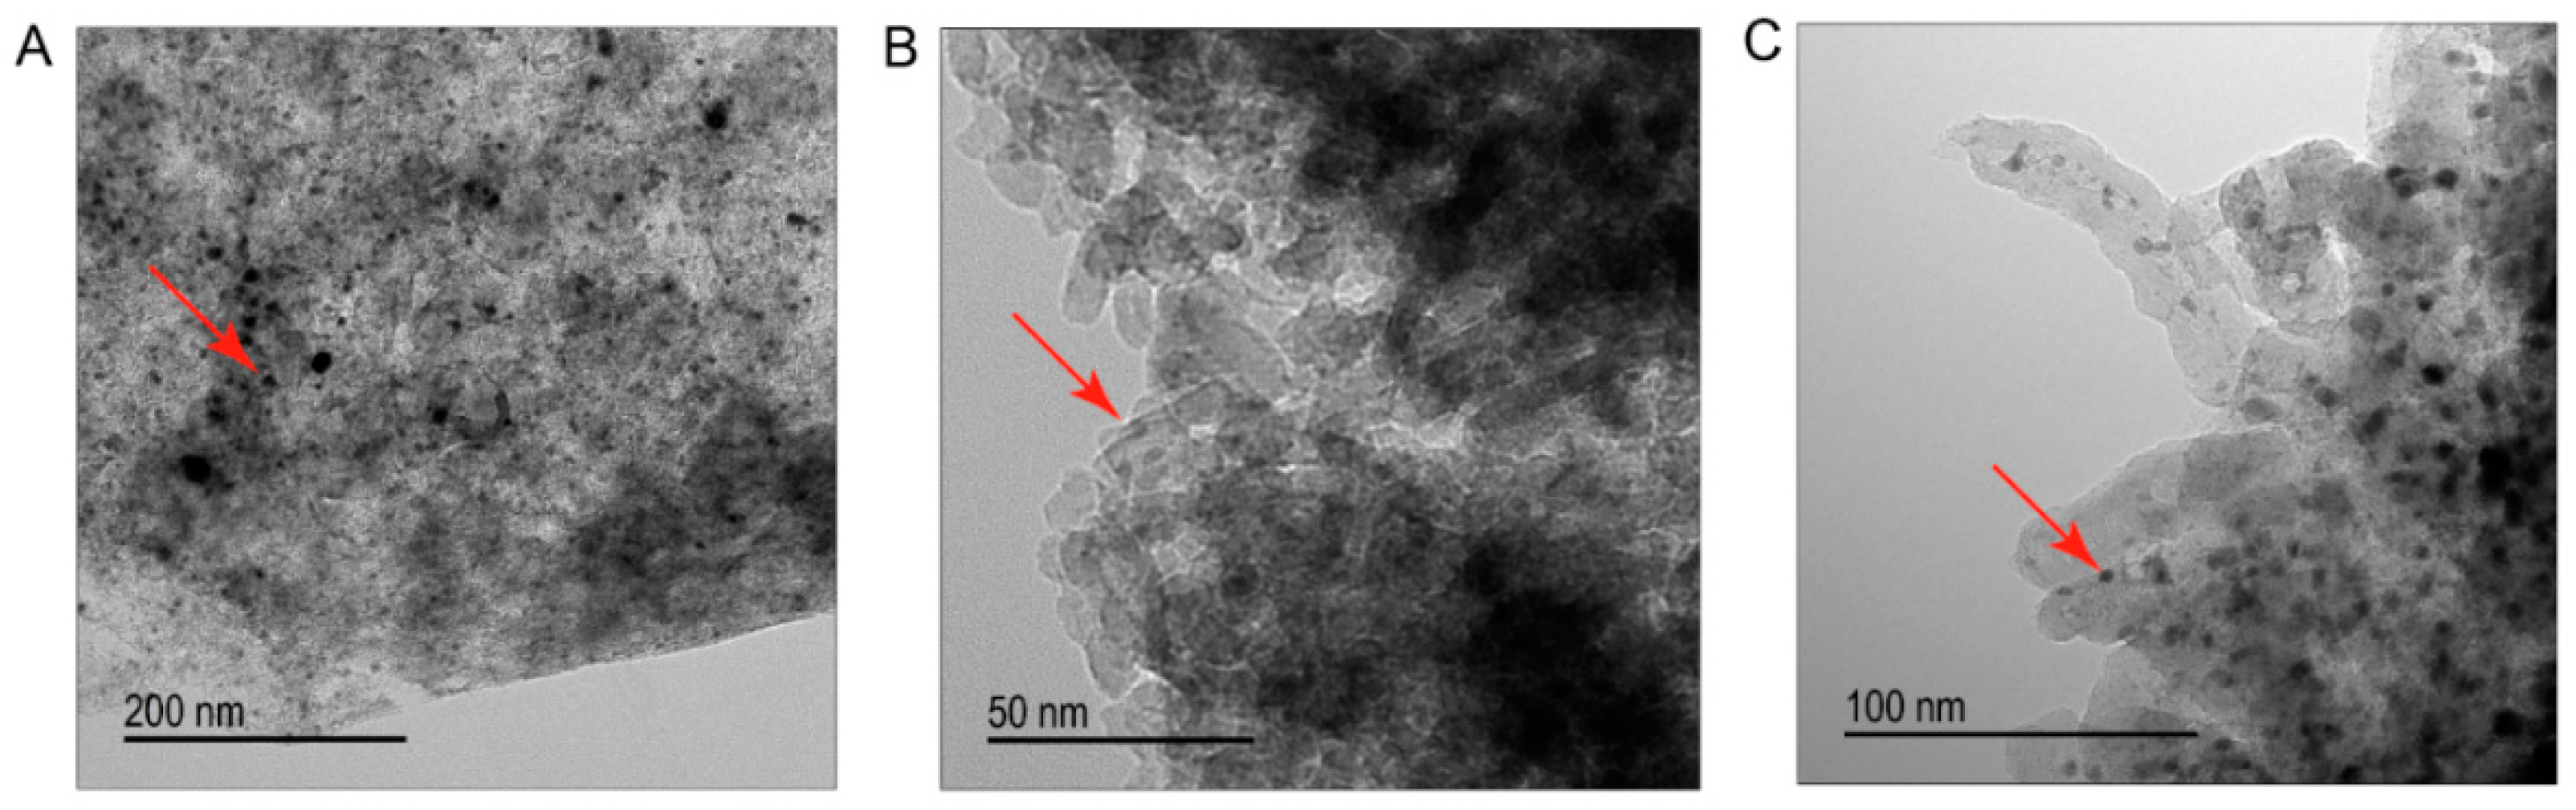
To analyze the particle size of the carbide, high-resolution transmission electron microscopy (HR-TEM) was performed.
Figure 2 displays representative HR-TEM images of tungsten carbide supported on AC, CCA and CNF. Black spots represent the active phase carbide (indicated with the red arrows) and the dark grey area is the support.
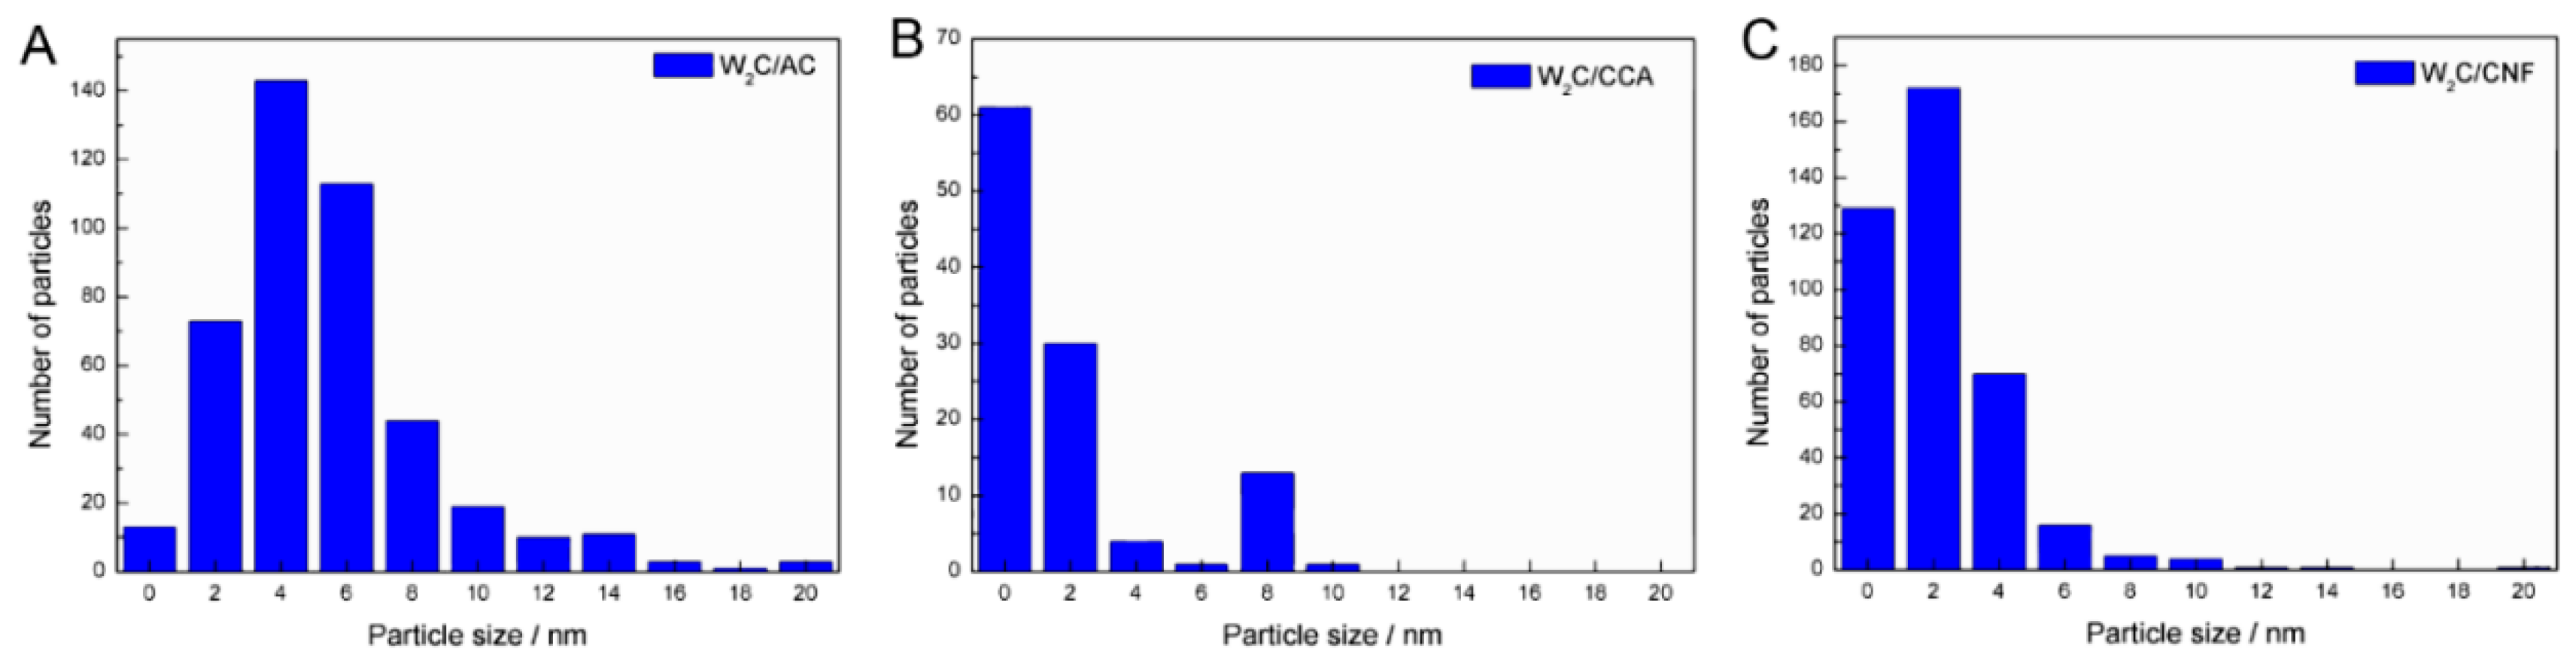
We estimated the average particle size based on 250 to 400 particles for each catalyst.
Table 2 shows the average particle sizes and
Figure 3 displays the particle size distributions.
The average particle size of W
2C/AC, W
2C/CCA and W
2C/CNF was 6, 2 and 3 nm, respectively. Although the W
2C/AC catalyst presented a higher particle size average than W
2C/CCA and W
2C/CNF,
Figure 3 shows that the largest particles of W
2C/CCA and W
2C/CNF catalysts have a diameter of 10 nm, while the diameter of the largest particles of W
2C/AC is 20 nm. The presence of a few larger particles (>10 nm) in the W
2C/AC catalyst accounts for its higher average particle size. Since large particles present a high volume-to-surface ratio, those particles likely did not make a significant contribution to the overall weight-based activity. Furthermore, most particles of the three catalysts had an average diameter of less than 6 nm. We therefore concluded that differences in average particle size of the catalysts were not a significant factor.
To enable a fair comparison between the catalytic performance of W
2C/AC, W
2C/CNF and W
2C/CCA, we used CO chemisorption to quantify potential active sites.
Table 3 displays the CO chemisorption results for the three catalysts. CO uptake for tungsten carbide catalysts follows the order W
2C/CCA (80 μmol·g
−1) > W
2C/AC (60 μmol·g
−1) > W
2C/CNF (34 μmol·g
−1). The CO uptake value is related to the number of accessible sites that can interact with CO molecules, which means that the catalyst that presents the highest CO uptake value may have more accessible sites available for reaction according to Lee et al. [
27].
CO uptake for the AC, CCA and CNF supports was 0, 0 and 1 μmol·g−1, respectively. This result indicates that the CO uptake values of supported catalysts are exclusively related to the active phase.
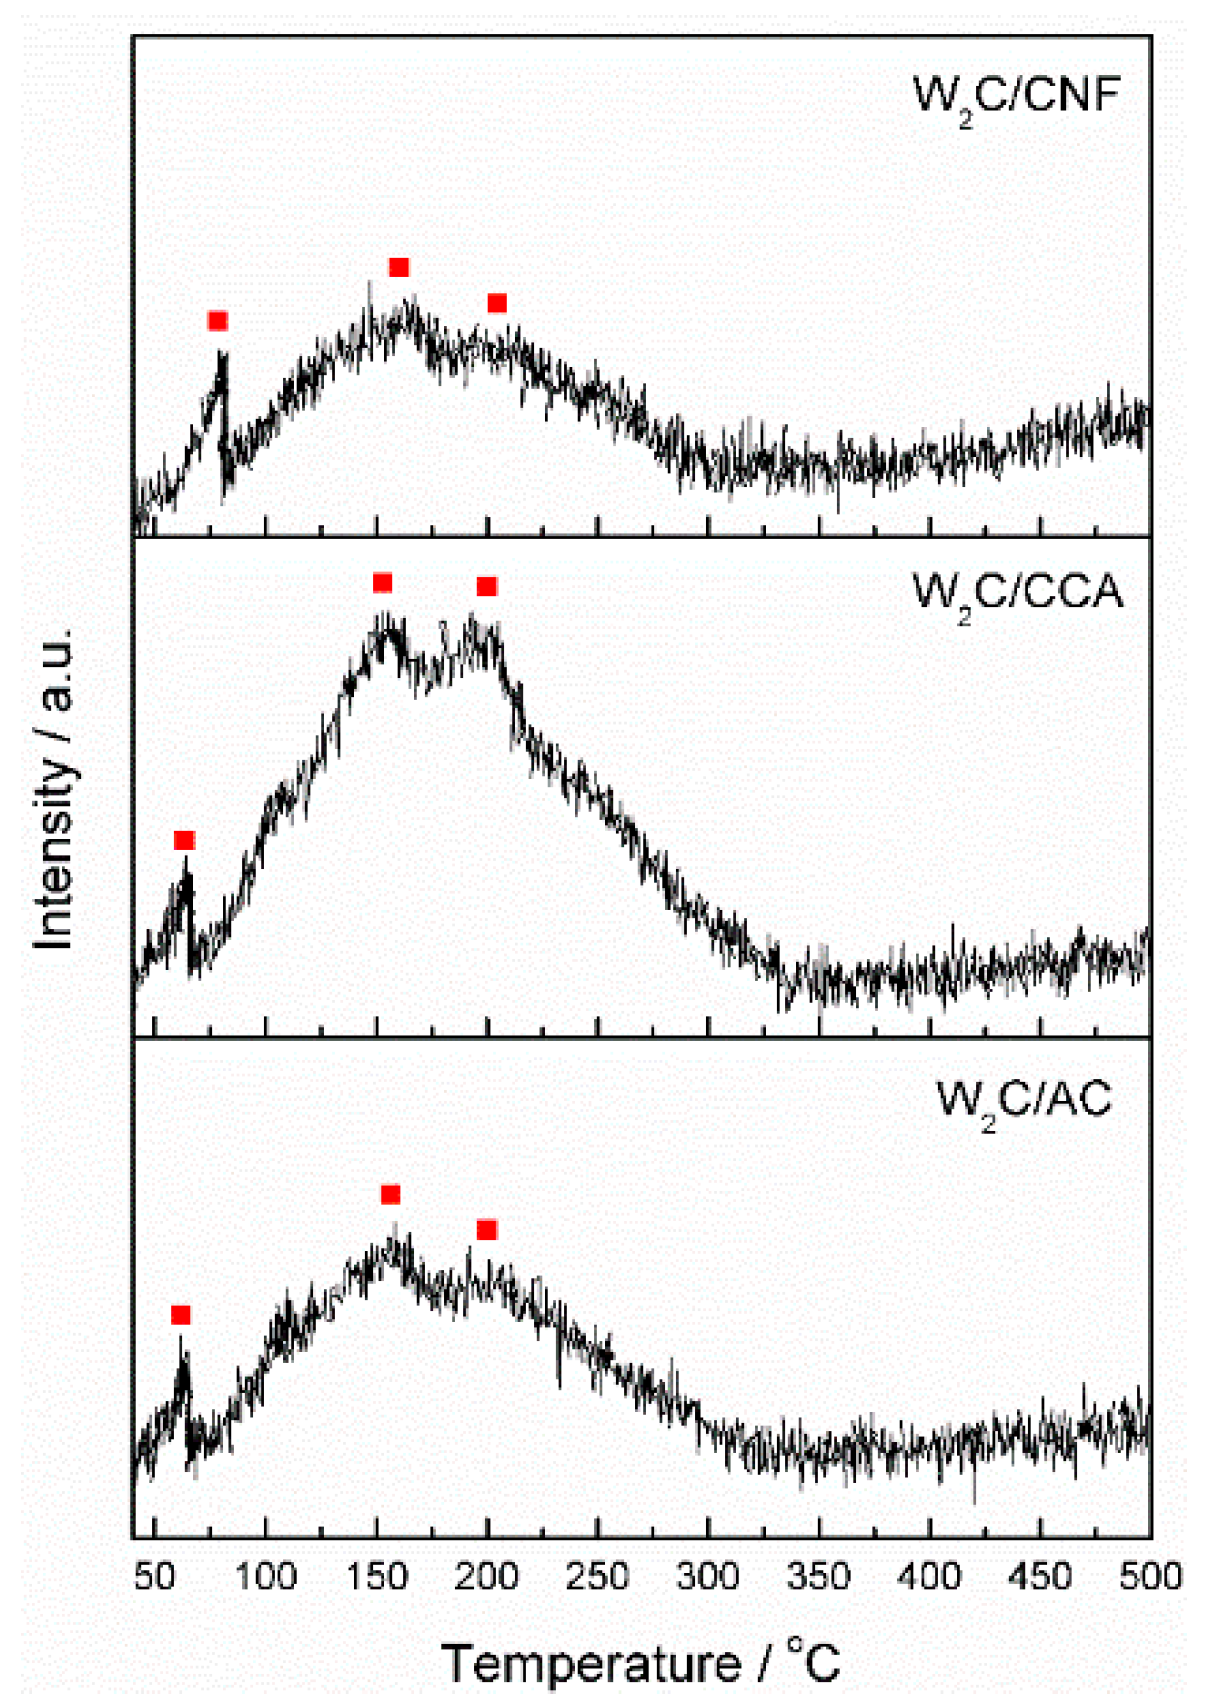
Although CO chemisorption provides information about the density of potential active sites, it does not inform about the nature of these sites. We therefore performed CO TPD analysis, which enabled us to compare the nature of the active sites through the CO-binding strength. Active sites of a different nature bind CO with a different strength, which is indicated by the temperature of the peaks in the CO TPD profile. Stronger bonds result in higher temperatures of CO desorption.
Figure 4 displays the CO TPD results of the supported tungsten carbide catalysts, each showing three peaks at 90, 150 and 200 °C, indicated by the red squares in the figure. These results suggest that although the catalysts are supported by different materials (AC, CCA and CNF), the nature of their active sites is the same.
CO TPD analysis was also performed on the pure supports from 25 to 1000 °C (not shown). We observed a significant increase on the amount of desorbed CO at temperatures higher than 500 °C, indicating that the surface groups are released from the support at this temperature. Thus, we expect that no surfaces groups remain attached to the support after it is exposed to 900 °C for 6 h (during catalyst synthesis).
NH
3 TPD was performed to analyze the acidity of the catalysts.
Table 4 displays the density of the catalysts’ acidic sites. W
2C/CCA had the highest density of acidic sites (217 μmol·g
−1) compared with W
2C/AC and W
2C/CNF (44 and 46 μmol·g
−1, respectively).
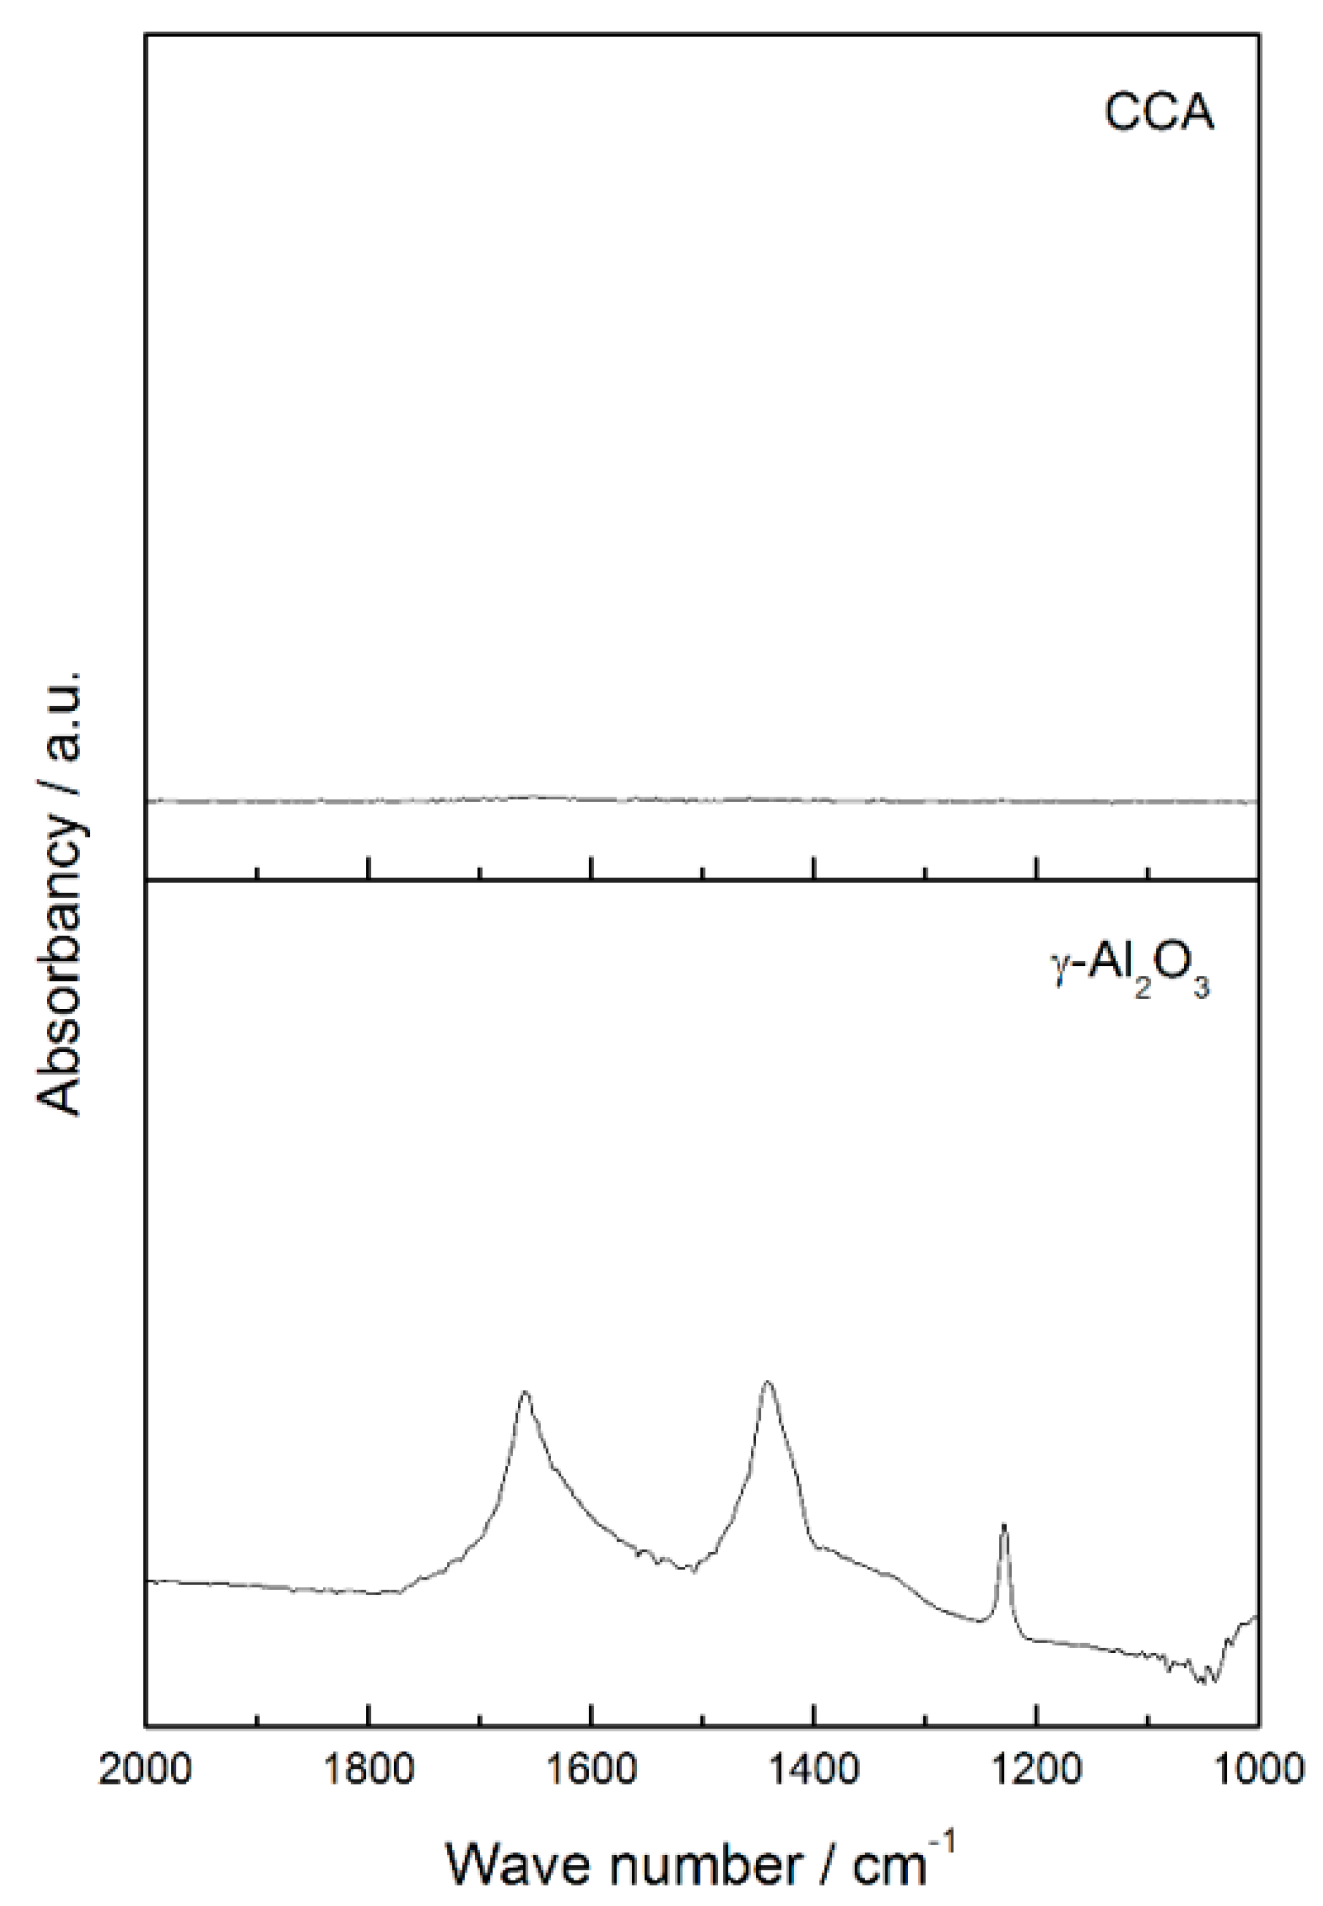
The higher acidity of tungsten carbide supported on carbon-covered alumina may be attributed to the acidity of alumina. Although the alumina was completely covered by carbon, as shown by CO
2 Diffuse Reflectance Infrared Fourier Transform Spectroscopy (DRIFTS) analysis (
Figure A2), the higher amount of desorbed NH
3 (
Table 4) suggests that the porosity of carbon enables the alumina to be available for interaction with external molecules, such as ammonia during NH
3 TPD.
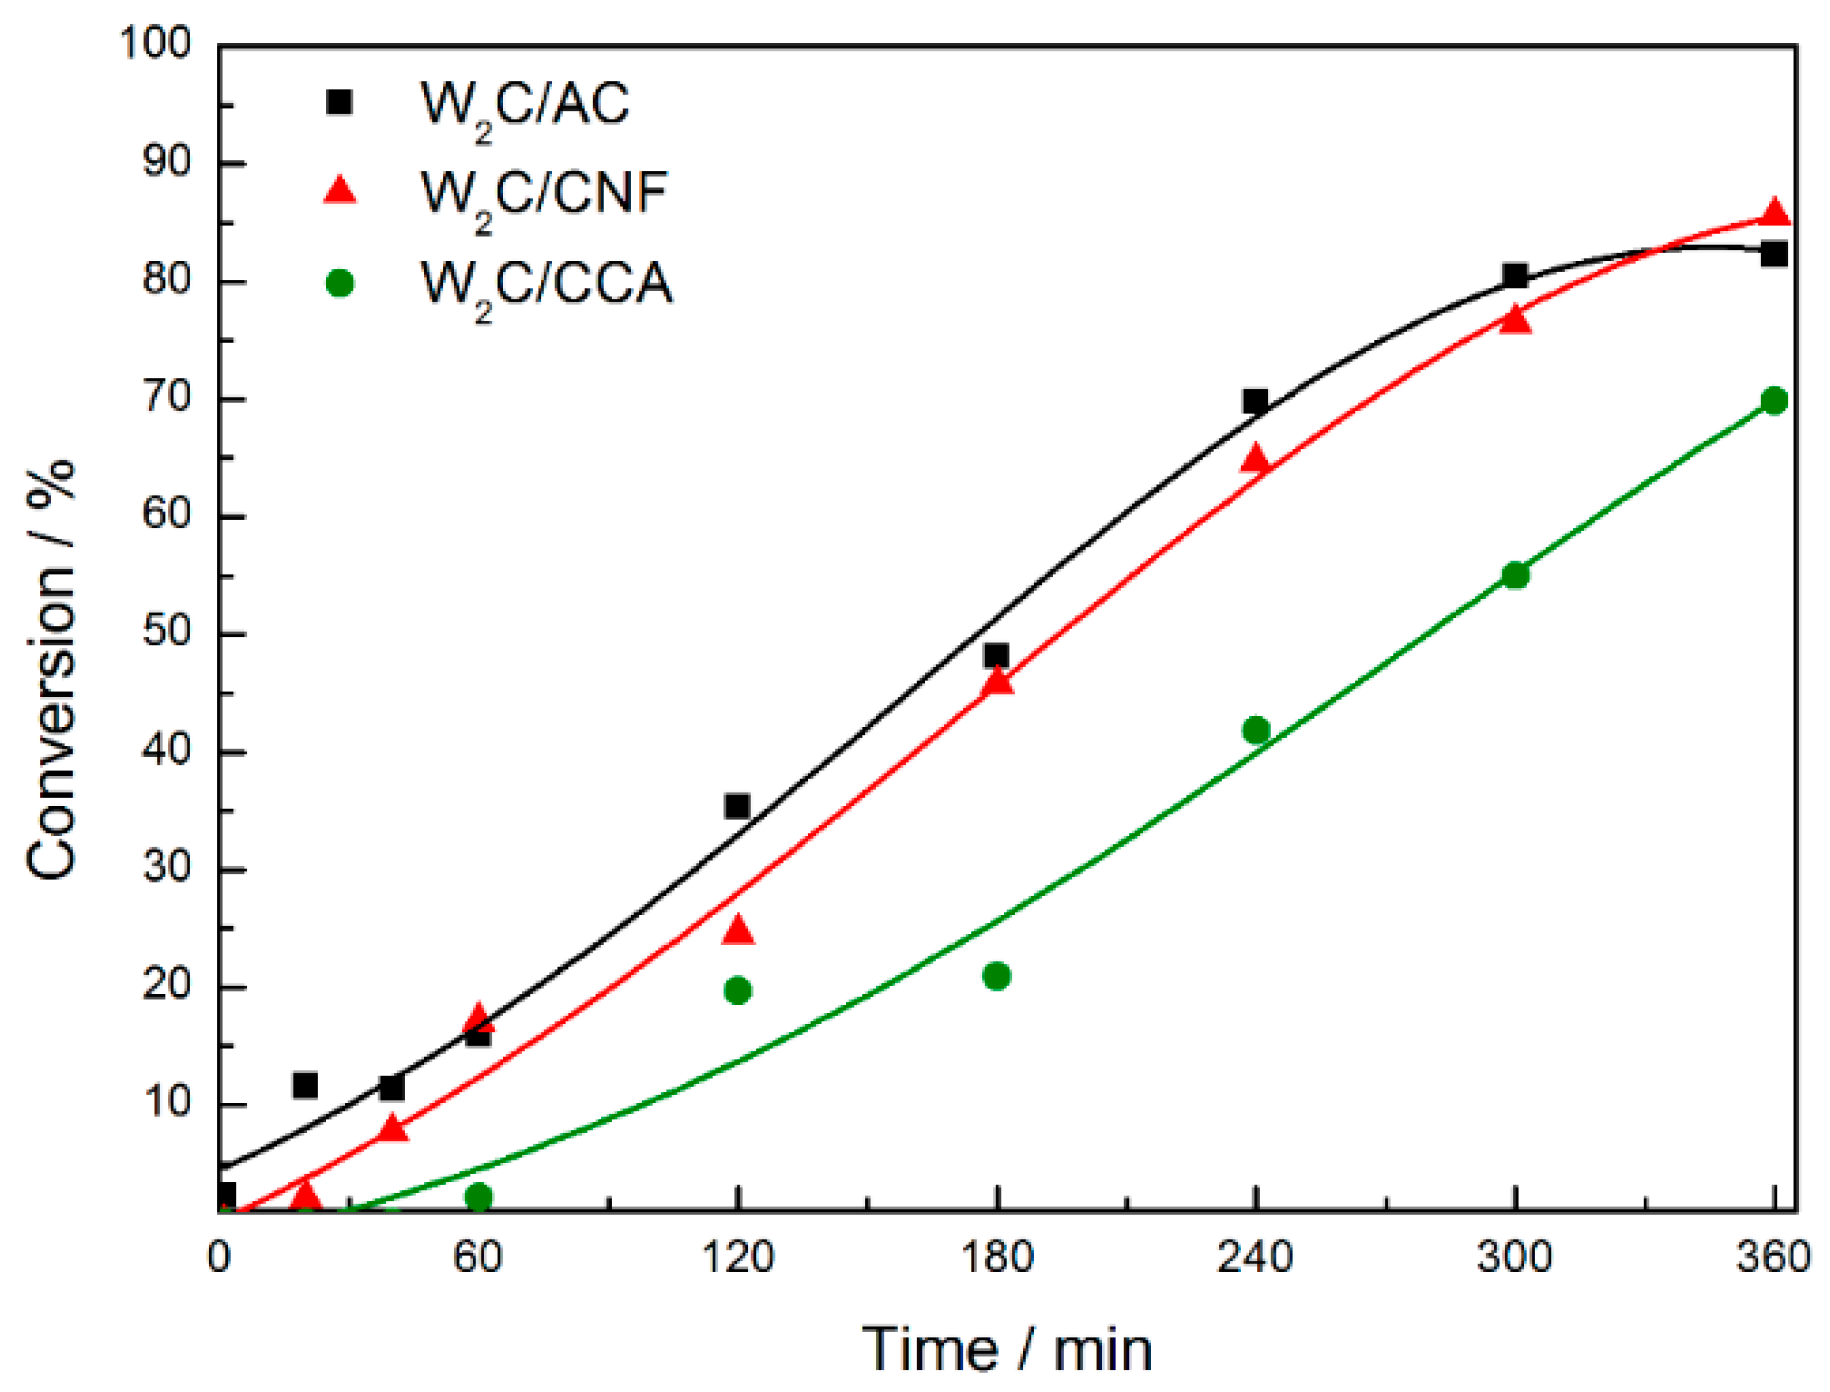
Stearic acid hydrodeoxygenation was performed over supported tungsten carbide catalysts at 350 °C and 30 bar H
2.
Figure 5 displays the stearic acid conversion over time.
W2C supported on CCA presented the lowest stearic acid conversion relative to W2C supported on AC and CNF (although W2C/CCA showed the highest CO uptake value). We propose that this result can be explained by the textural properties. The combination of a lower surface area (161 m2·g−1) with a smaller pore size (9.4 nm) of the CCA-supported catalyst limits the access of stearic acid to active sites, resulting in a lower stearic acid conversion.
The conversion over the W
2C/AC and W
2C/CNF catalysts was similar and reached the maximum value of 85% at 360 min. W
2C/AC presented a higher CO uptake value (61 μmol·g
−1), higher specific surface area (696 m
2·g
−1) and smaller pore size (8.3 nm) than W
2C/CNF (34 μmol·g
−1, 124 m
2·g
−1 and 15.1 nm, respectively). While the higher specific surface area favors the interaction of stearic acid molecules with the catalyst surface, the smaller pore size may limit it. Thus, a balance between pore size and surface area may explain that the stearic acid conversion over the W
2C/AC and W
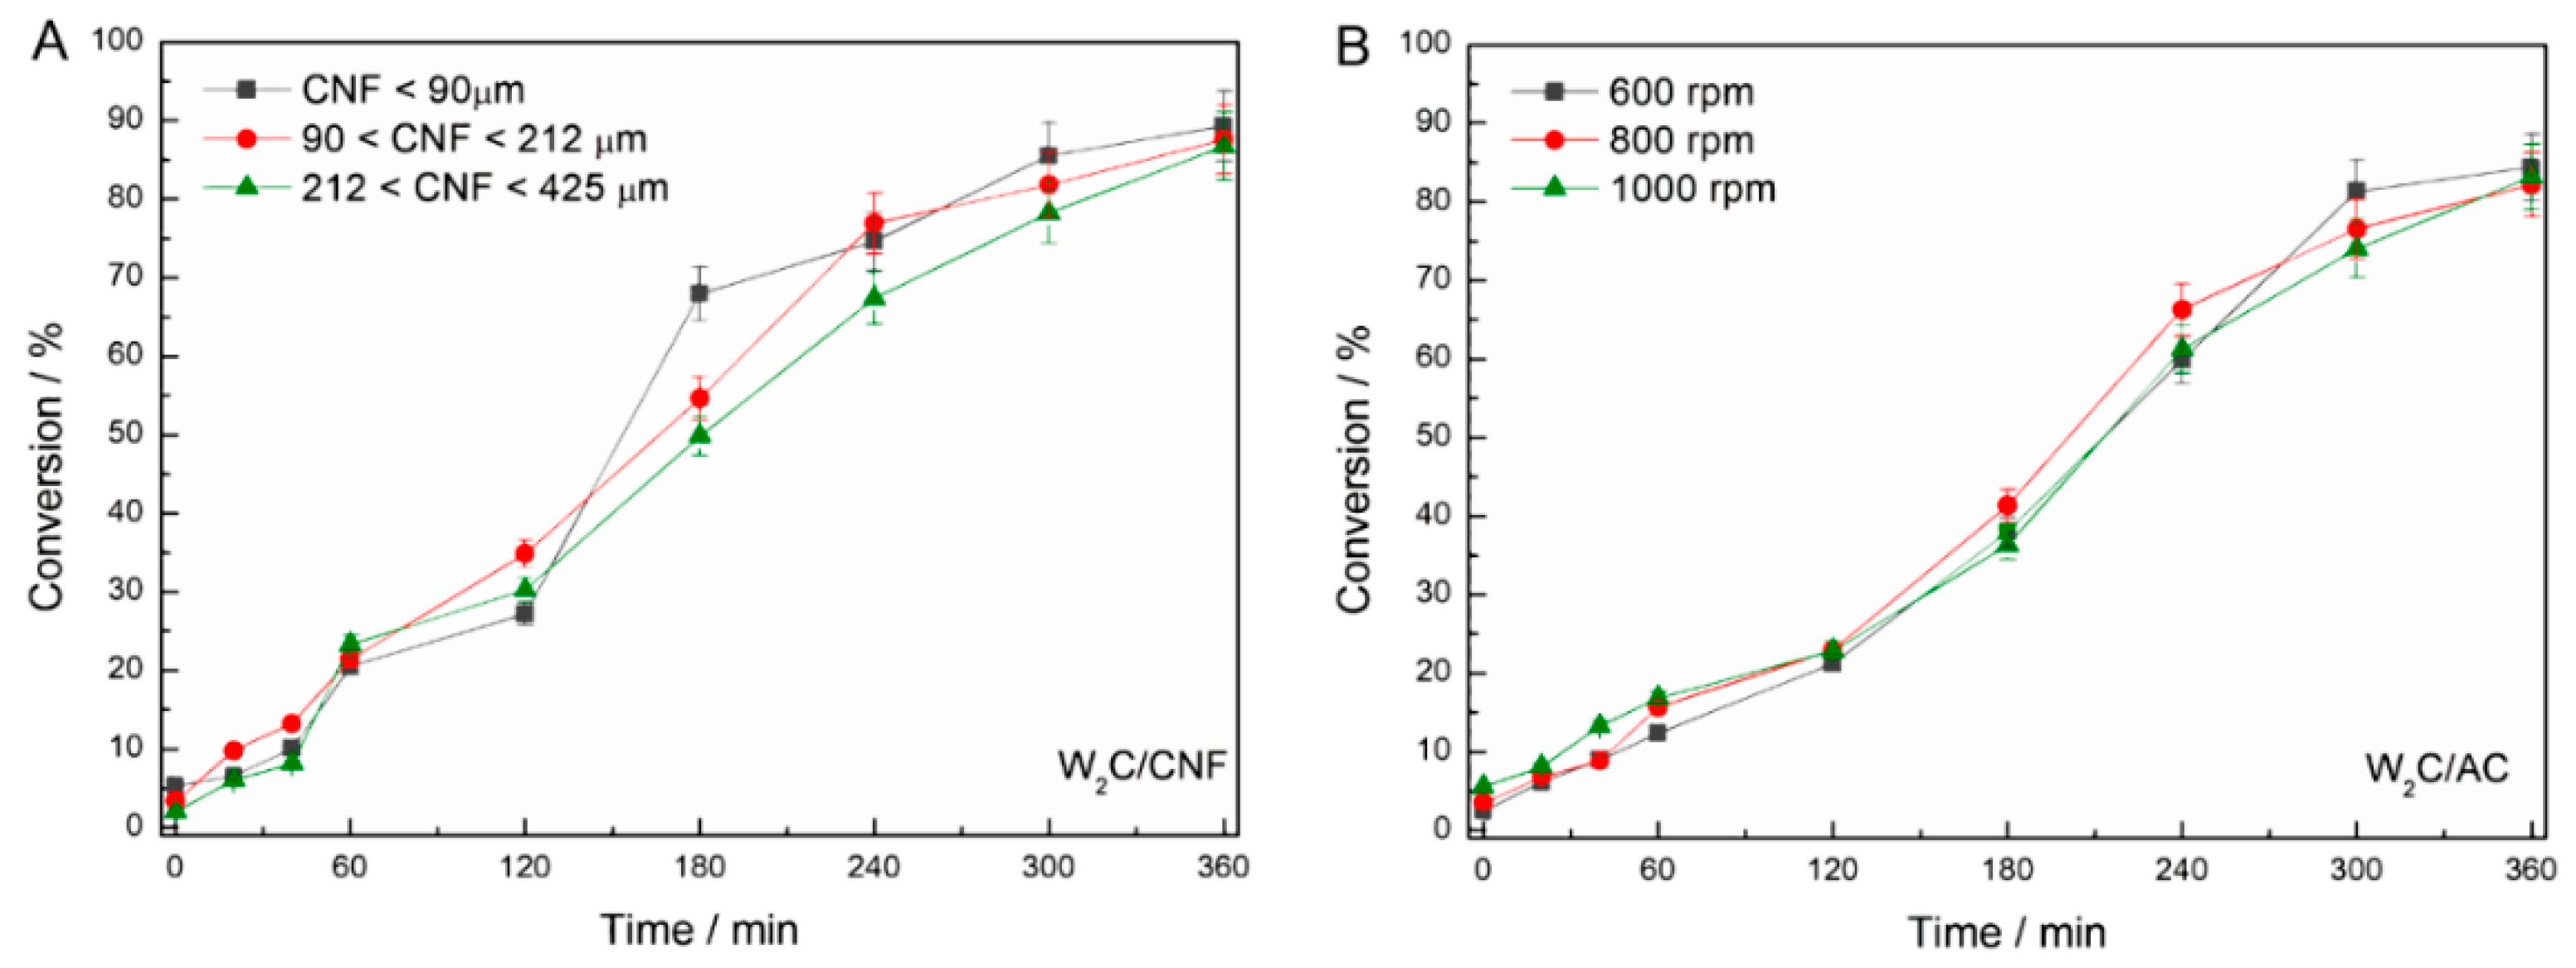
2C/CNF catalysts was similar. Note that the reaction is not limited by mass transfer limitations (see
Figure A3).
To investigate the intrinsic activity of the catalysts, the turnover frequency (TOF) was calculated based on initial reaction rate (see equation in
Appendix A).
Table 5 lists the results. The TOF of the described carbides was 1–3 s
−1. Therefore, all three catalysts presented a similar TOF for stearic acid HDO (hydrodeoxygenation) reaction at 350 °C and 30 bar H
2, which indicates that the catalysts have the same intrinsic activity. This result is in accordance with the CO TPD profiles (
Figure 5), which shows that the nature of the active sites on the three catalysts was the same. The TOF of noble metals and sulfides are up to one order of magnitude lower than that of the carbides [
28,
29]. Thus, the intrinsic activity of tungsten carbides studied in this work is similar or even higher compared to others catalysts previously reported in the literature.
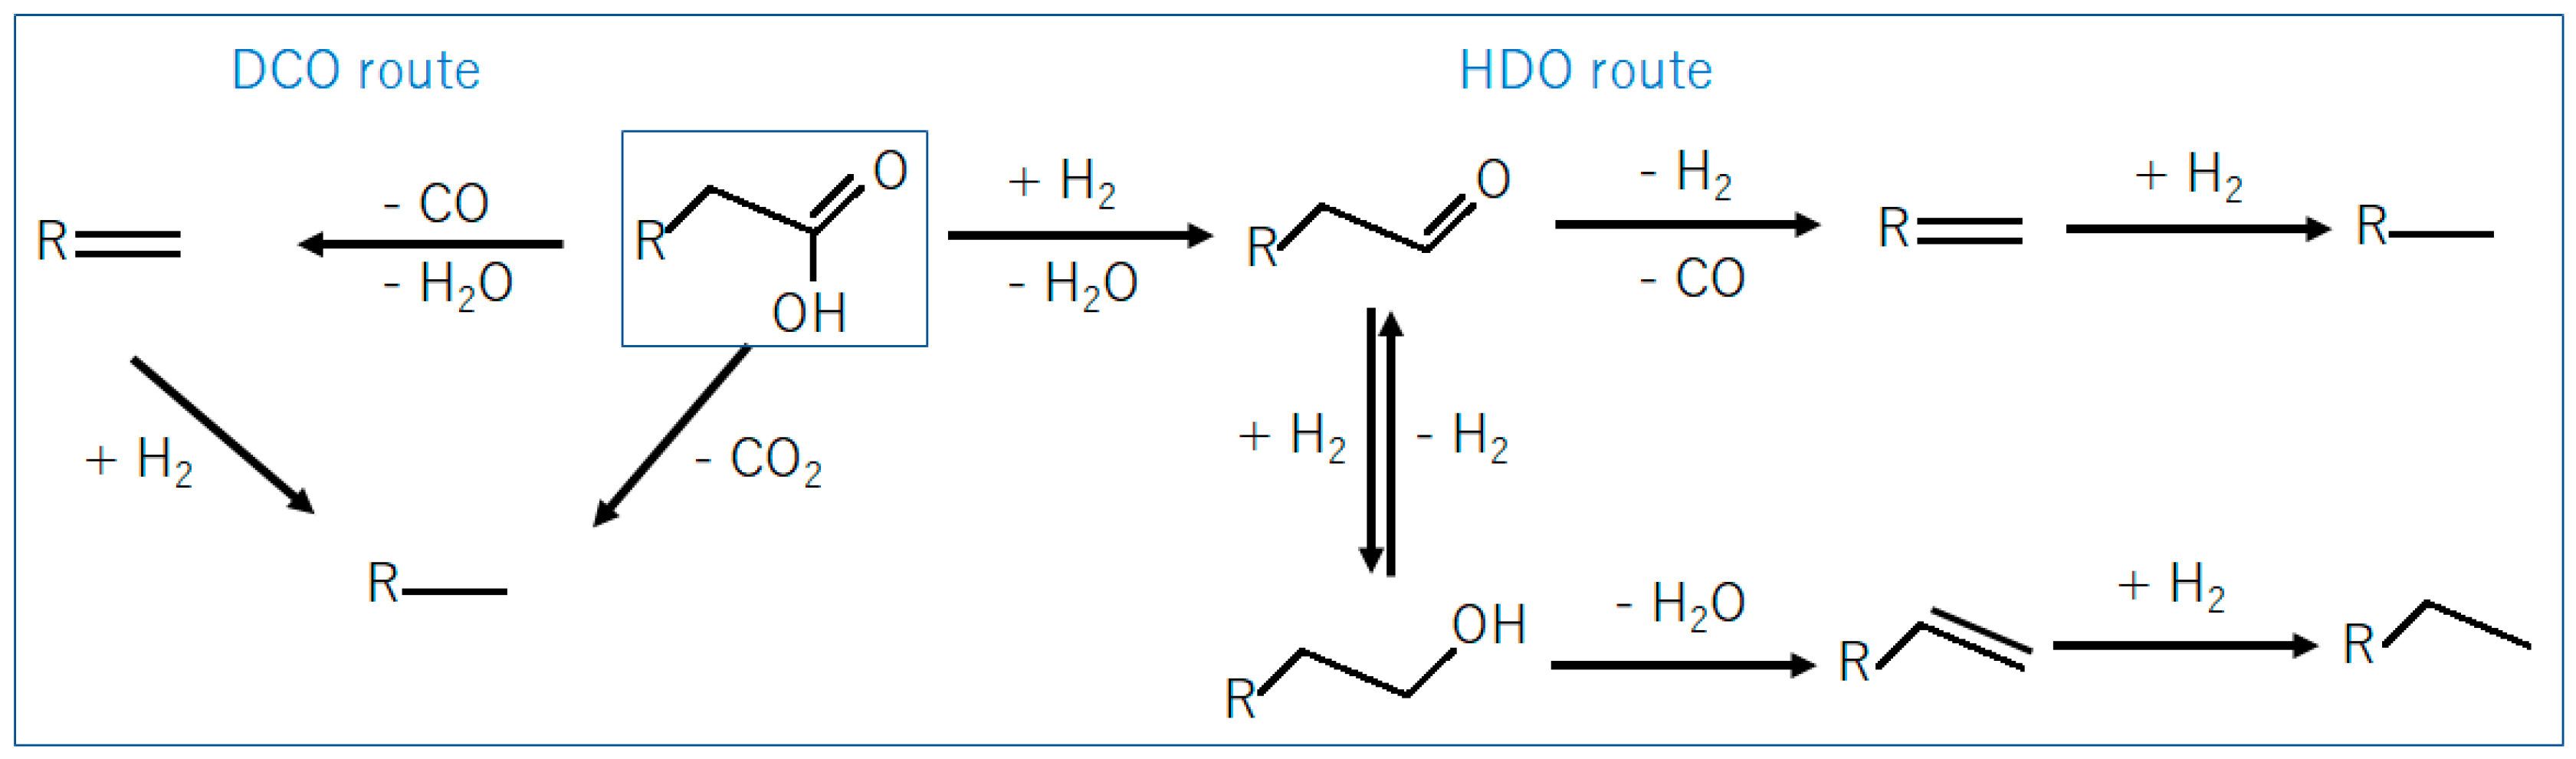
Stearic acid deoxygenation can occur via different pathways [
18,
23], as summarized in
Figure 6. In the DCO (decarbonylation/decarboxylation) pathway, oxygen is removed as CO
2 (decarboxylation) or as CO and H
2O (decarbonylation) followed by hydrogenation resulting in heptadecane as final product. In the HDO pathway, oxygen is removed as H
2O producing aldehyde as the first intermediate. The aldehyde is further dehydrated and hydrogenated resulting in octadecane as final product [
30]. A third reaction pathway, called HDCO (hydrogenation followed by decarbonylation), can be considered when the aldehyde (formed via hydrogenation of stearic acid) is decarbonylated, resulting in heptadecane as final product.
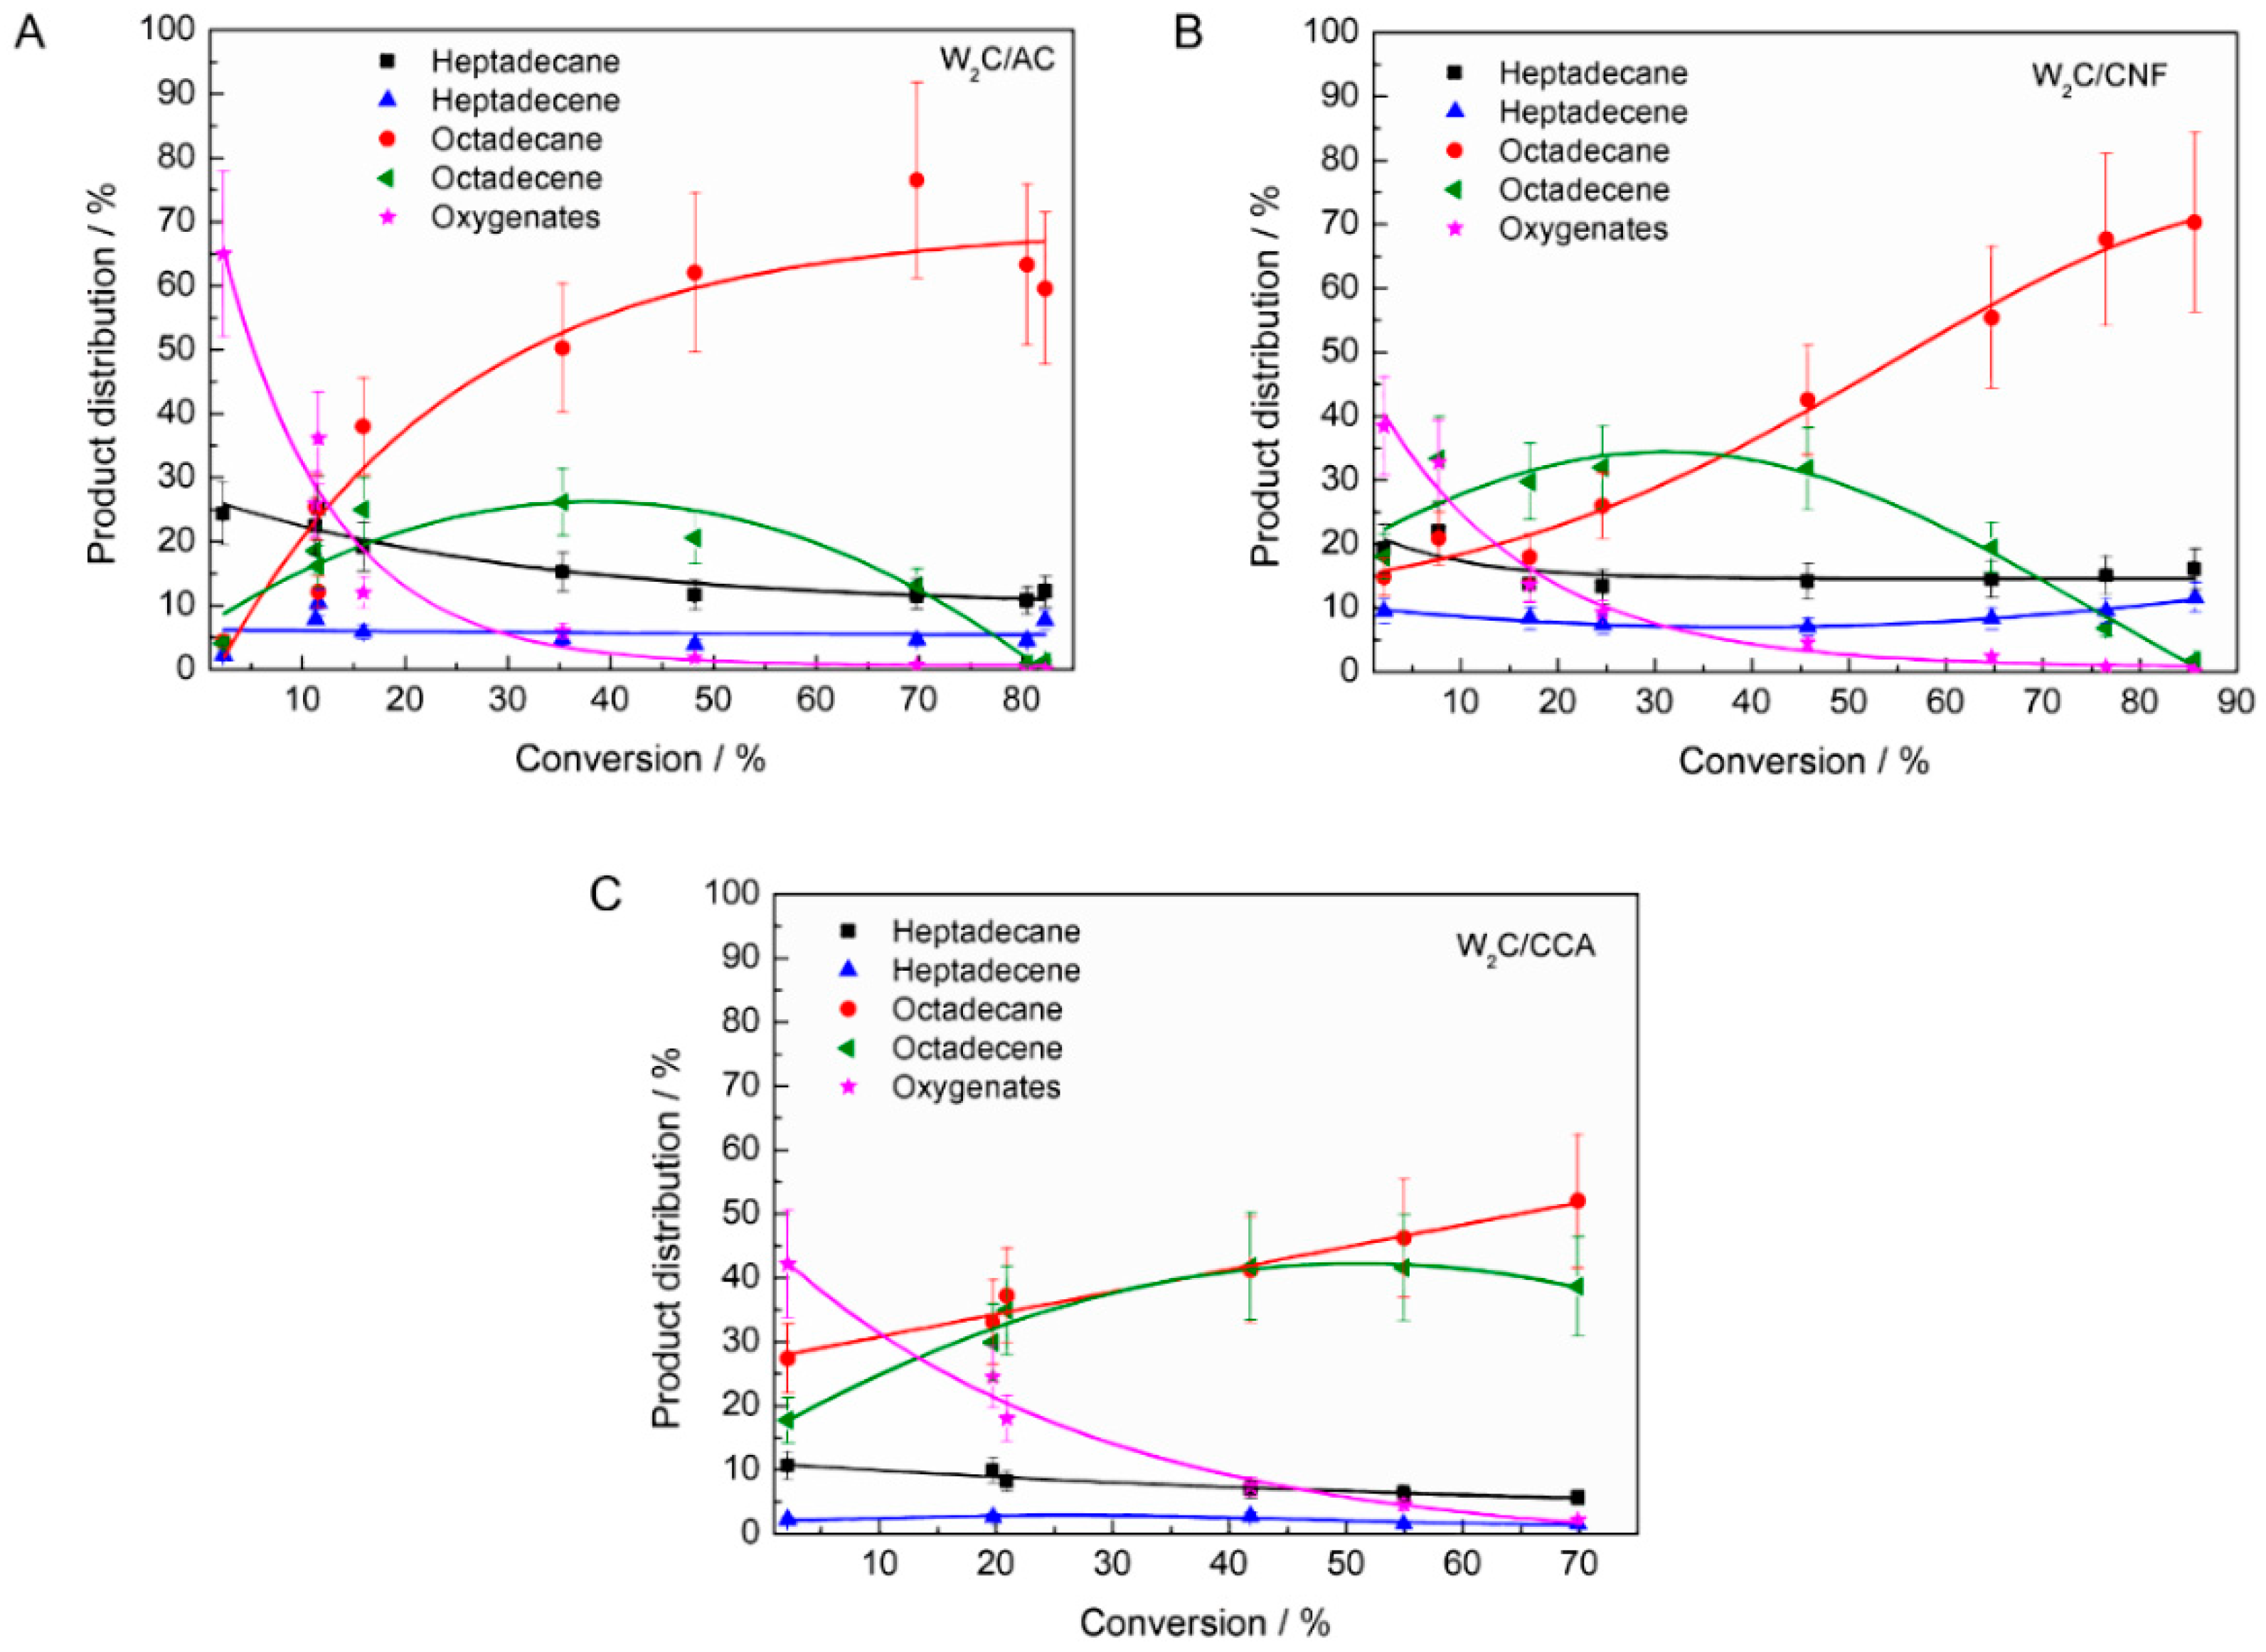
To explore the influence of the supports’ pore size and acidity on the product distribution in stearic acid HDO, the product distribution is plotted as function of conversion (
Figure 7).
Figure 7 shows a number of differences between the performance of the catalysts, such as the following, which we will discuss subsequently:
The selectivity towards oxygenates was higher over W2C/AC compared with W2C/CNF and W2C/CCA at low conversion rates (<5%).
The ratio of octadecene (C18-unsat) to octadecane (C18-sat) was higher over W2C/CCA than over W2C/CNF and W2C/AC. Only for W2C/CNF at lower conversion rates (<30%), the selectivity towards octadecene surpassed that of octadecane.
The selectivity towards oxygenates was higher over W2C/AC than over W2C/CNF and W2C/CCA at low conversion (<5%).
Oxygenates (octadecanal and octadecanol) were the primary products over all three catalysts, which matches observations by other researchers [
31]. However, at conversion below 5%, oxygenates represented 70% (mol) of all products over the W
2C/AC catalyst while they represented only 40% (mol) over the W
2C/CNF and W
2C/CCA catalysts.
According to Kim et al. [
32], a carbon-based support with a large pore size facilitates the transport of reactants during hydrodeoxygenation. In addition, Schaidle et al. [
31] concluded via experimental and theoretical calculations that acid catalysts favor dehydration of oxygenates in the hydrodeoxygenation reaction.
Figure 8 summarizes the effect of pore size (A) and acidity (B) on the oxygenates selectivity at 3% conversion of stearic acid HDO.
Clearly, neither the pore size nor the acidity related directly to the selectivity. Therefore, we believe that the combination of acidity and porosity determined the performance of the catalysts. However, the exact contribution of each parameter currently remains an enigma.
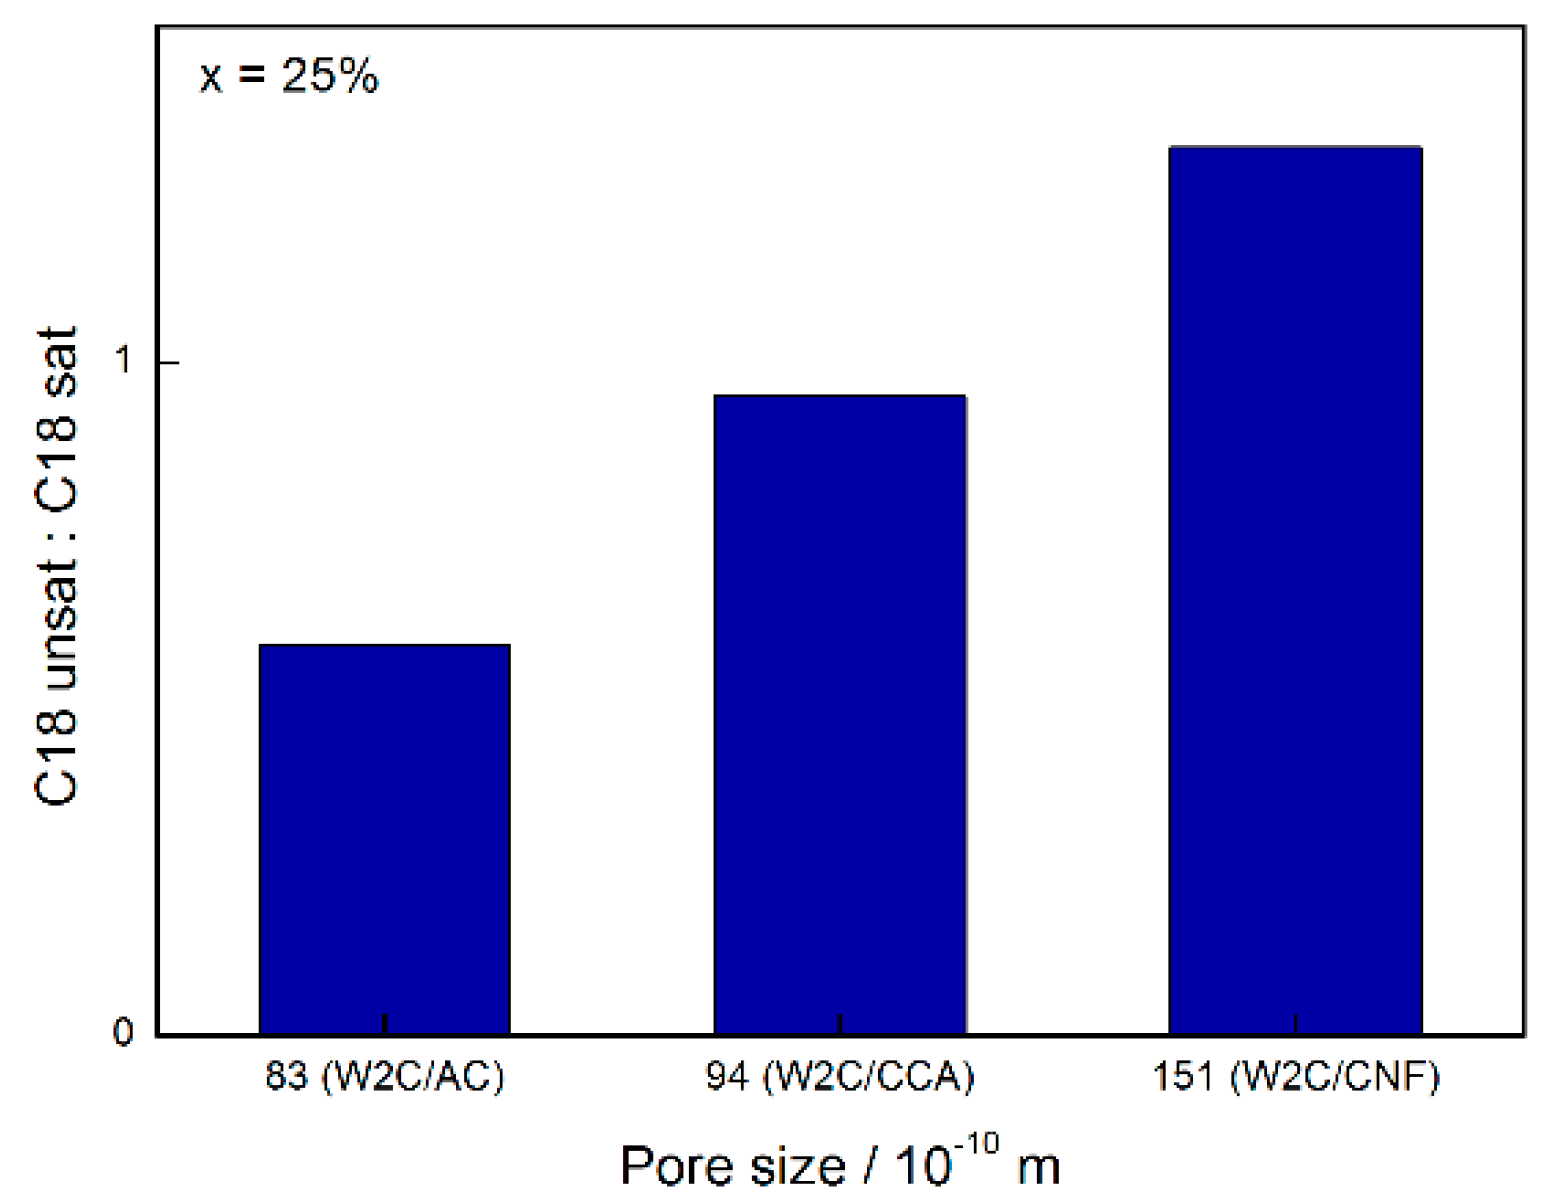
The ratio C18-unsat: C18-sat was higher over W2C/CCA than over W2C/CNF and W2C/AC. Only for W2C/CNF at lower conversion rates (<30%), the selectivity towards C18-unsat surpassed that of C18-sat.
At conversions below 30%, W2C/CNF produced compounds resulting in a C18-unsat:C18-sat ratio greater than 1 while W2C/AC and W2C/CCA produced compounds resulting in a C18-unsat:C18-sat ratio of less than 1. Higher amounts of the unsaturated octadecene were initially formed over the support with the greatest mesopore volume (CNF), which were subsequently hydrogenated to octadecane. This suggests that the conversion of octadecene into octadecane was slower over the catalyst supported on CNF than over the catalysts supported on AC and CCA.
Figure 9 summarizes the influence of pore size on the C18-unsat:C18-sat selectivity for 25% conversion.
At higher conversions, i.e. above 50%, the C18-unsat:C18-sat ratio over the W
2C/CCA catalyst was higher than over the W
2C/AC and W
2C/CNF catalysts. According to Schaidle et al. [
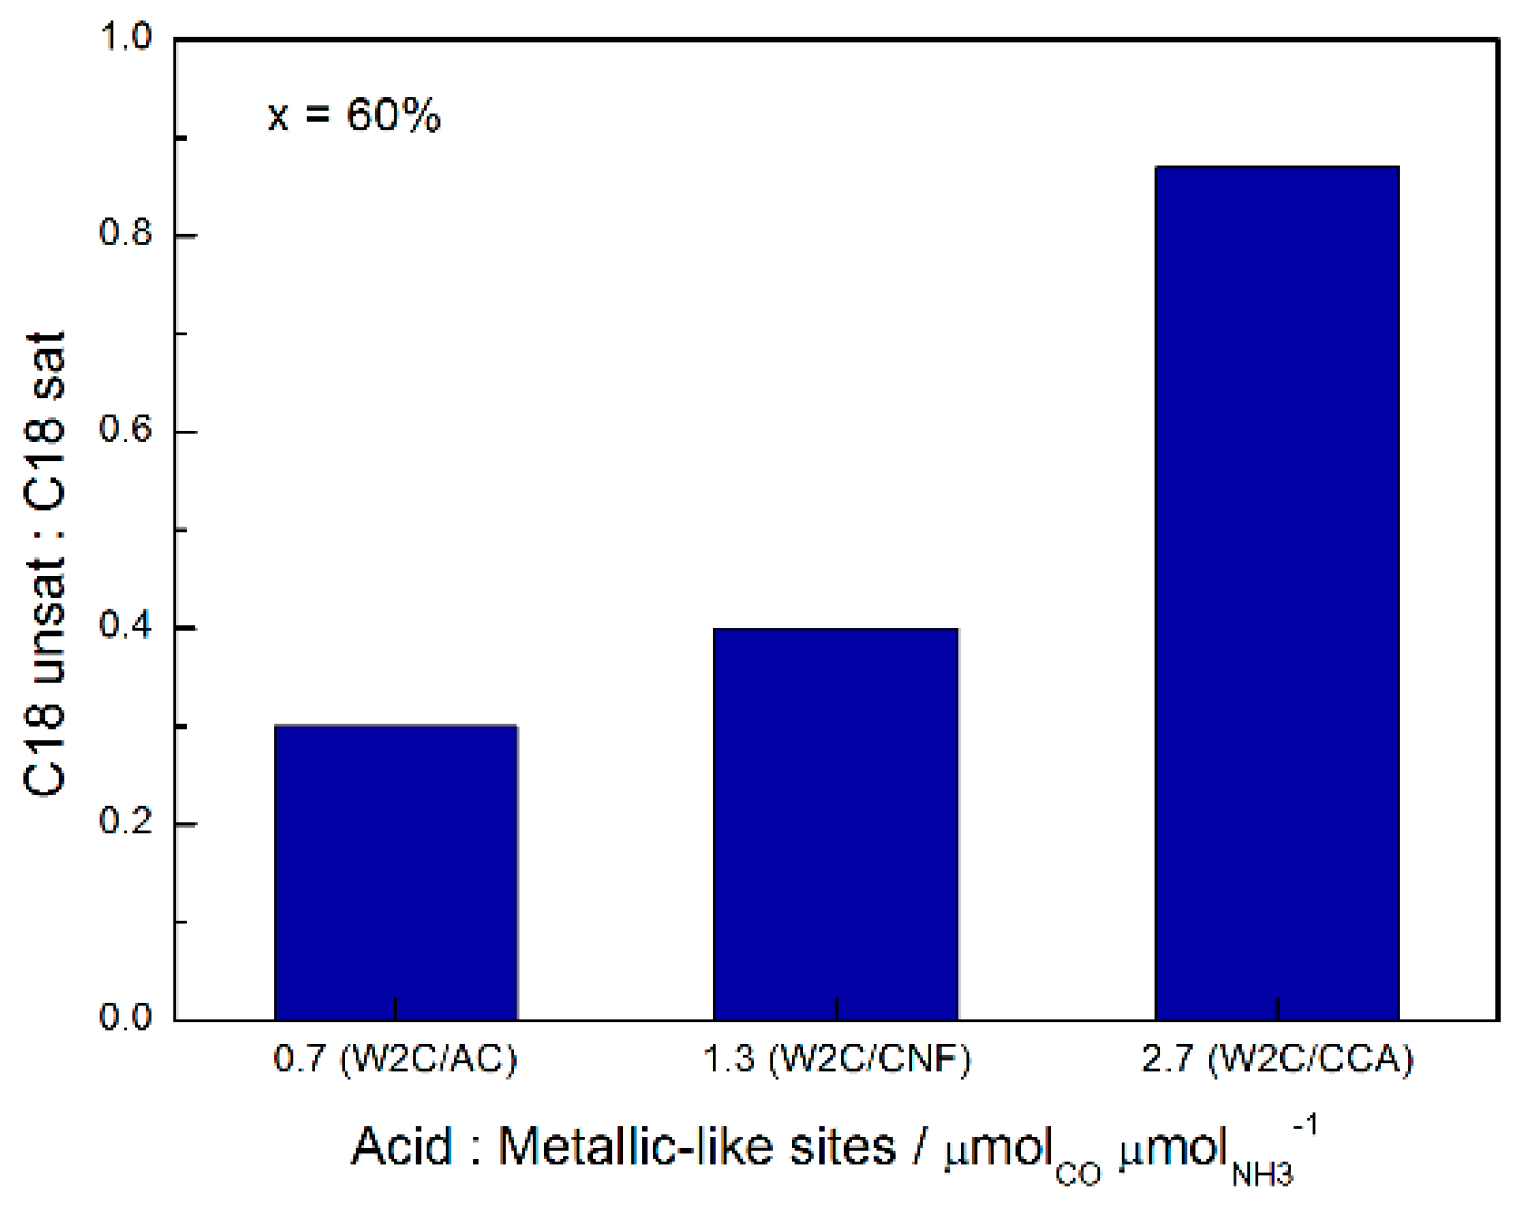
31], the relative extents of hydrogenation and dehydration of oxygenates (aldehyde and alcohol) is related to the ratio between metallic and acidic sites on the carbide surface. Since C18-unsat is produced via dehydration of oxygenates and C18-sat is produced via hydrogenation of C18-unsat, it is expected that catalysts with a higher ratio of acid to metallic sites favor C18-unsat production and catalysts with a lower acid:metallic site ratio favor C18-sat production.
The combination of CO chemisorption (metallic sites) and NH3 TPD (acid sites) analysis indicates that the W2C/CCA catalyst had a higher ratio of acid:metallic sites (2.7) than the W2C/AC (0.7) and W2C/CNF (1.3) catalysts. This explains why the W2C/CCA catalyst had the highest C18-unsat:C18-sat ratio (0.87) relative to W2C/AC (0.3) and W2C/CNF (0.4) for conversions above 50%.
Figure 10 summarizes the effect of acidity on the C18-unsat:C18-sat rate at 60% conversion of stearic acid HDO.
In addition to the pore size and acidity, the particle size could also be pointed to as responsible for differences in the selectivity. However, previous studies [
19] have shown that W
2C/CNF with bigger particles produced more C17 compounds (heptadecane/heptadecene) than W
2C/CNF with smaller particles. In this paper, W
2C/AC was the catalyst with the biggest average particle size (although the difference was not significant), but
Figure 7A did not show a higher production of C17 over this catalyst. Therefore, we confirm that W
2C particle size distribution did not affect the performance of catalysts.


