 Andrea Kodde
 Eefje Engels1
 Annemarie Oosting
 Kees van Limpt
 Eline M. van der Beek
 Jaap Keijer
- 1Danone Nutricia Research, Utrecht, Netherlands
- 2Department of Pediatrics, University Medical Center Groningen – University of Groningen, Groningen, Netherlands
- 3Human and Animal Physiology, Wageningen University, Wageningen, Netherlands
White adipose tissue (WAT) distribution and WAT mitochondrial function contribute to total body metabolic health throughout life. Nutritional interventions starting in the postweaning period may impact later life WAT health and function. We therefore assessed changes in mitochondrial density and function markers in WAT depots of young mice. Inguinal (ING), epididymal (EPI) and retroperitoneal (RP) WAT of 21, 42 and 98 days old C57BL/6j mice was collected. Mitochondrial density [citrate synthase (CS), mtDNA] and function [subunits of oxidative phosphorylation complexes (OXPHOS)] markers were analyzed, together with gene expression of browning markers (Ucp1, Cidea). mRNA of ING WAT of 21 and 98 old mice was sequenced to further investigate functional changes of the mitochondria and alterations in cell populations. CS levels decreased significantly over time in all depots. ING showed most pronounced changes, including significantly decreased levels of OXPHOS complex I, II, and III subunits and gene expression of Ucp1 (PN21-42 and PN42-98) and Cidea (PN42-98). White adipocyte markers were higher at PN98 in ING WAT. Analyses of RNA sequence data showed that the mitochondrial functional profile changed over time from “growth-supporting” mitochondria focused on ATP production (and dissipation), to more steady-state mitochondria with more diverse functions and higher biosynthesis. Mitochondrial density and energy metabolism markers declined in all three depots over time after weaning. This was most pronounced in ING WAT and associated with reduced browning markers, increased whitening and an altered metabolism. In particular the PN21-42 period may provide a time window to study mitochondrial adaptation and effects of nutritional exposures relevant for later life metabolic health.
Introduction
Obesity prevalence is high in adults and considerably increased nowadays in children and adolescents (Ng et al., 2014). Childhood obesity increases the risk for early onset metabolic diseases, like type 2 diabetes mellitus (T2D) and cardiovascular disease (Reilly and Kelly, 2011). An important link between obesity and metabolic diseases is the metabolic function of the white adipose tissue (WAT), i.e., WAT health (Hammarstedt et al., 2012).
Mitochondrial density in adulthood appears to be strongly correlated to WAT health as shown by a reduced WAT mitochondrial density in obesity (Wilson-Fritch et al., 2004) and T2D (Choo et al., 2006). Nutrition may regulate WAT function as feeding a high fat diet reduced WAT mitochondrial density (Sutherland et al., 2008), a process that is already initiated after 5 days of western style diet (WSD) (Derous et al., 2015), while caloric restriction and diets enriched in poly-unsaturated fatty acids increased WAT mitochondrial density, oxidative capacity and biogenesis (Flachs et al., 2005; Nisoli et al., 2005). Dependent on their location in the body, WAT depots differ in their impact on metabolic health (Yang et al., 2008; Bjorndal et al., 2011). Visceral WAT is located in the abdominal cavity and visceral WAT mass is inversely correlated to total body insulin sensitivity and as such considered a risk factor for development of the metabolic syndrome (Pouliot et al., 1992; Ross et al., 2002). In contrast, subcutaneous WAT is located directly under the skin and is shown to have a higher oxidative capacity compared to the visceral depots in mice (Schottl et al., 2015).
Experimental evidence suggests that growth and distribution of WAT as well as mitochondrial density of WAT depots can be programmed by early life environmental factors. For example, maternal obesity, over-nutrition or undernutrition during pregnancy can all drive increased visceral adiposity and an adapted mitochondrial density in rodent offspring (Bruce et al., 2009; Jousse et al., 2014; Claycombe et al., 2016; Lecoutre et al., 2016). In addition, mild caloric restriction or a high fat diet exposure in the lactation period also programmed adult adiposity and metabolic health of pups (Mitra et al., 2009; Palou et al., 2010). Those studies show that suboptimal nutrient conditions in early life can have long-term metabolic consequences. Programming of the oxidative and storage capacity of WAT, which develops from the third trimester of gestation until adolescence (Spalding et al., 2008), may be an underlying mechanism.
The postnatal development of WAT includes differentiation from progenitor cells to fully developed adipocytes containing lipid droplets, a process starting before birth in subcutaneous depots and after birth in visceral depots (Han et al., 2011; Wang et al., 2013). After weaning WAT depots continue to grow and adipocytes increase in size (hypertrophy) and number (hyperplasia) in a depot specific manner (DiGirolamo et al., 1998). Furthermore, WAT depots develop postnatally from a white phenotype at PN10 to a brown phenotype at PN20 where the majority of the adipocytes are multilocular and express UCP1, after which these cells disappear again and are replaced by unilocular adipocytes which only express UCP1 upon cold-induction (Xue et al., 2007; Lasar et al., 2013; Birnbacher et al., 2018).
Many nutritional intervention studies, including postnatal programming studies, i.e., studies with a nutritional intervention in early life with the aim to improve adult metabolic health (Baars et al., 2016; Kodde et al., 2017; Bouwman et al., 2018; Fernandez-Calleja et al., 2018), take the postweaning period (around PN21) as starting point. Comprehensive and extended comparison of postweaning changes of markers for mitochondrial function and WAT browning in different WAT depots is crucial for the interpretation of those studies. Therefore, we here investigate early life changes in markers for mitochondrial density, function and browning in the developing WAT depots with the aim to substantiate and extend, in terms of number of markers and WAT depots analyzed, available research. To this end we collected inguinal (ING), epididymal (EPI) and retroperitoneal (RP) WAT, of 21, 42, and 98 days old mice, housed under standardized experimental conditions (ambient temperature) and comprehensively measured markers of mitochondrial density, function and browning as well as the effect of a WSD on these markers. In addition, we newly examined changes within mitochondrial functional profile by analyzing transcription of all established mitochondrial proteins and categorize them to function.
Materials and Methods
Study Design
Mice were kept at the animal facility of Intravacc (Bilthoven, Netherlands) under a 12 h light – 12 h dark cycle (lights on at 06:00 h). Room temperature and humidity were kept at constant level (21 ± 2°C and 50 ± 5%, respectively). This housing temperature was chosen to adhere to the most common temperature used for animal experiments. C57BL/6jOlaHsd breeders were purchased from Harlan (Envigo since 2015, Horst, Netherlands), acclimatized for 2 weeks, time mated and fed a American Institute of Nutrition-93G synthetic diet (AIN93G) (Reeves et al., 1993) during breeding, pregnancy and lactation. Within 2 days after birth, litters were culled to four males and two females and randomly assigned to a dam. At postnatal day 21 (PN21) female mice were killed, while male mice were weaned, housed in littermate-pairs and continued on AIN93G until PN42. From PN42 until sacrifice at PN98 mice were fed AIN93M (Reeves et al., 1993) or WSD (containing 39 en% fat; diet composition in Table 1). Food and water were available ad libitum during the entire experimental period. A very limited amount of food was supplied the night before dissection to ensure that the animals were in a fasted state (approximately 8 h). Body weight and food intake were measured twice a week. At different time points (PN21, PN42, and PN98) mice were sacrificed to assess the development of WAT depots and the effect of the WSD challenge, resulting in the following experimental groups (i) PN21 (n = 8), (ii) PN42 (n = 8), (iii) PN98-AIN (n = 11), and (iv) PN98-WSD (n = 11; Figure 1A). At dissection mice were anesthetized (isoflurane/N2O/O2), terminated by bleeding (eye extraction) and ING, EPI, and RP WAT were collected, weighted, snap frozen and stored at -80°C.
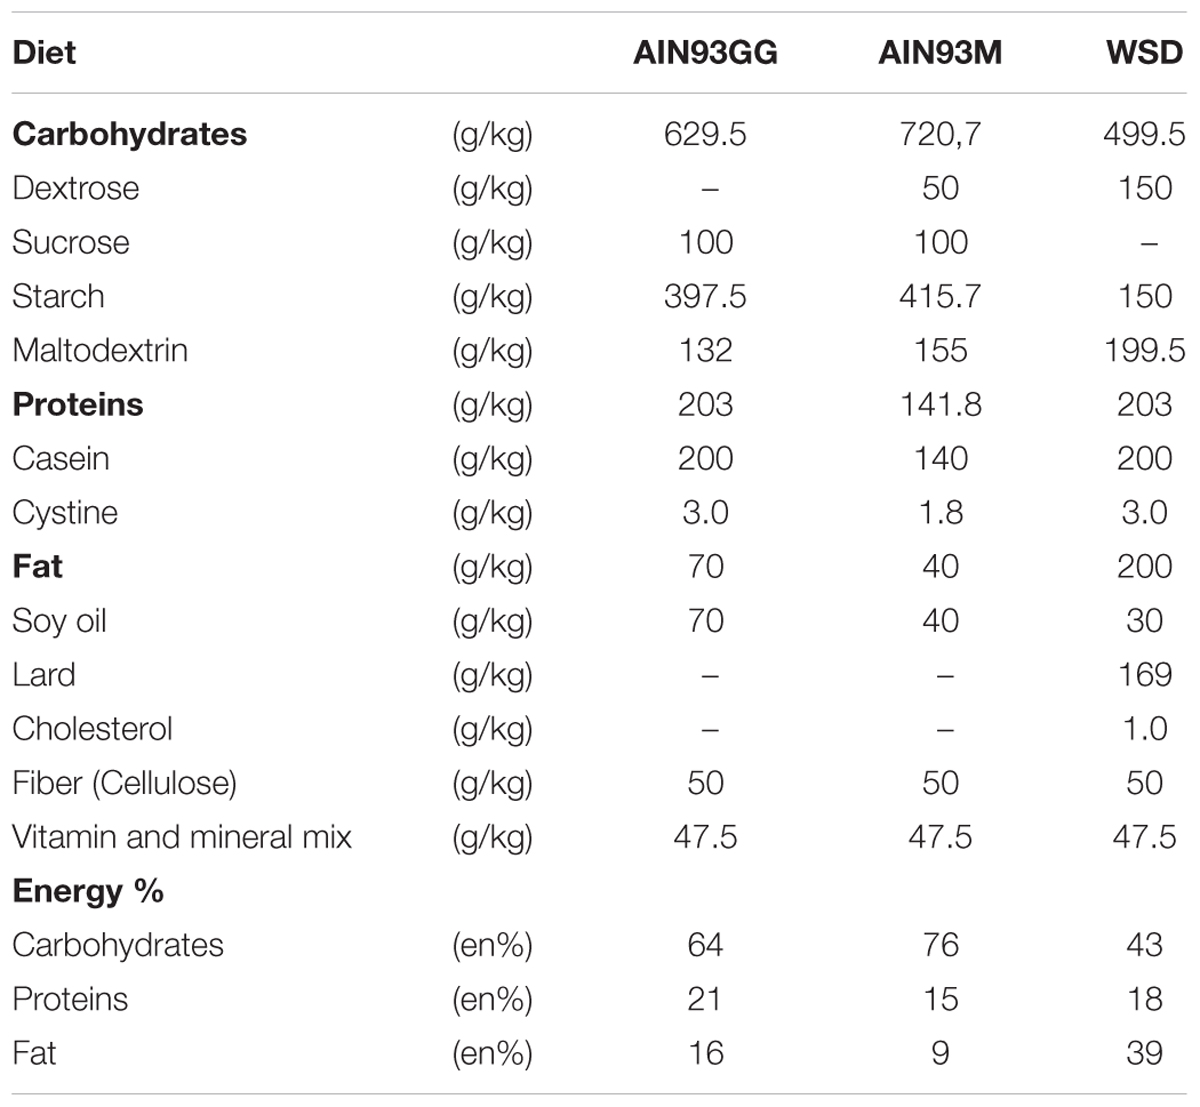
Table 1. Diet composition.
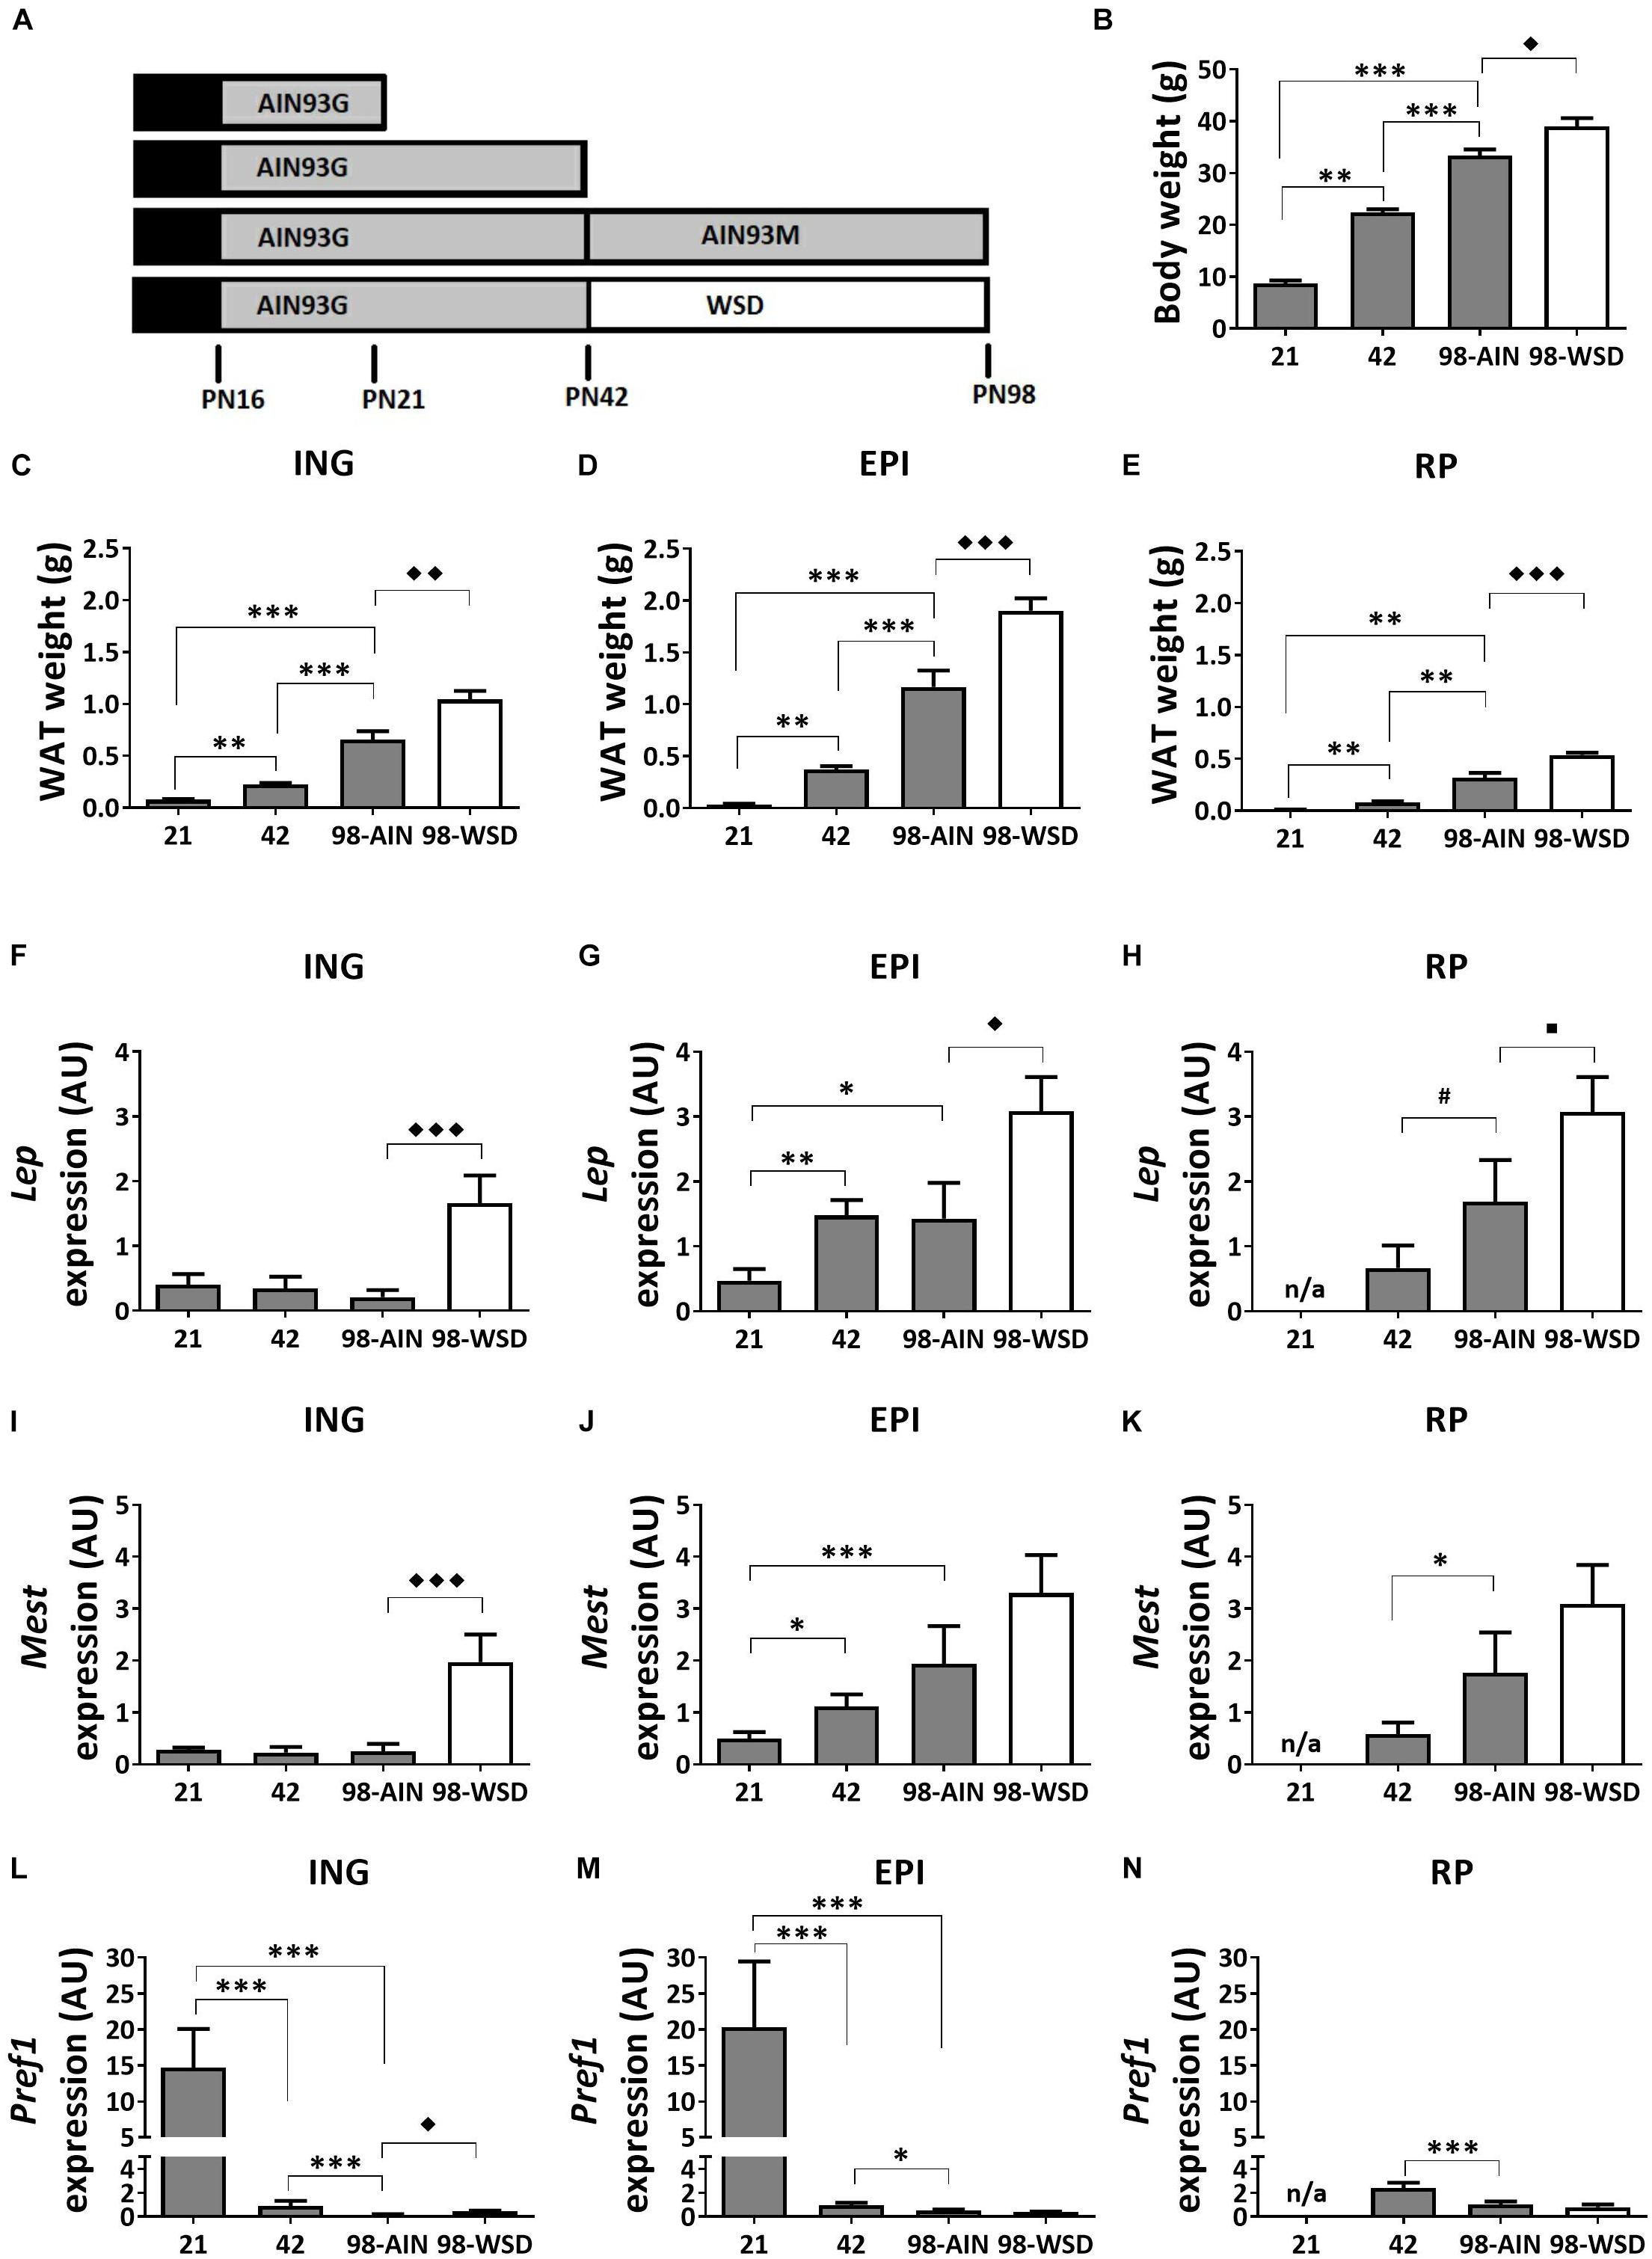
Figure 1. Study design, development of body weight, WAT weight and gene expression of adiposity markers between PN21 and PN98. (A) Study design with at PN16 start of weaning to full weaning at PN21; (B) body weight; weight of (C) ING WAT, (D) EPI WAT, (E) RP WAT; Lep expression in (F) ING WAT, (G) EPI WAT, (H) RP WAT; Mest expression in (I) ING WAT, (J) EPI WAT, (K) RP WAT; Pref1 expression in (L) ING WAT, (M) EPI WAT, and (N) RP WAT. PN, postnatal day; AIN, AIN-93G diet from PN16-42 and AIN-93M from PN42-98 (gray); WSD, western style diet (white); n/a, data not available. Data expressed as mean + SEM. WAT weight: n = 8 for PN 21 and PN42, n = 11 for PN98; gene expression: n = 8 for PN 21 and PN42, n = 11 for PN98, no data available for RP WAT at PN21. Time and WSD effects were analyzed separately; time effect: ∗p < 0.05; ∗∗p < 0.01; ∗∗∗p < 0.001; #0.05 < p < 0.1; WSD effect: ◆p < 0.05; ◆◆p < 0.01; ◆◆◆p < 0.001; WSD effect: ■0.05 < p < 0.1.
Sample Homogenization
The EPI, ING, and RP WAT depots were homogenized with a Cellcrusher (Cellcrusher, Cork, Ireland) and aliquots of the resulting homogenized powder where made to enable separate analyses. EPI and RP WAT at PN21 were too small to make aliquots and were therefore only used for RNA extractions and enzyme activity measurements, respectively. In addition, RP WAT of PN42 was too small to analyze mitochondrial DNA levels.
Gene Expression
RNA of EPI, ING and RP WAT was isolated using Trizol (Thermo Fisher Scientific, Landsmeer, Netherlands) followed by purification with a RNeasy Mini Kit (Qiagen Benelux b.v., Zwijndrecht, Netherlands) including a DNase treatment with a RNase-free DNase Set (Qiagen Benelux b.v.) as previously described (Vanhoutvin et al., 2009). RNA quantity and chemical purity were assessed with the Nanodrop 2000 (Thermo Fisher Scienctific) and integrity with the Agilent 2100 Bioanalyzer (Agilent, Santa Clara, CA, United States). iScriptcDNA synthesis kit (Bio-Rad, Veenendaal, Netherlands) was used according to manufacturer instructions. 6.25 ng cDNA was used as input for each Q-PCR reaction. SYBR Select Master Mix (Life Technologies Europe, Bleiswijk, Netherlands) was used according to manufacturer instructions and qPCR was performed with a QuantStudio 6 Flex Real-Time PCR System (Life Technologies Europe). mRNA expression of cell death-inducing DNA fragmentation factor, alpha subunit-like effector A (Cidea), Leptin (Lep), mesoderm specific transcript (Mest, also known as Peg1), delta-like 1 homolog (Dlk1, better known as Pref1, which will be used here) and uncoupling protein 1 (Ucp1) were analyzed relative to mean expression of two reference genes, hypoxanthine guanine phosphoribosyl transferase (Hprt) and zinc finger, AN1-type domain 6 (Zfand6). For a complete list of primers used see Table 2. Normalization of qPCR data was performed using the qbase+ (Biogazelle, Genth, Belgium) based on the method of relative normalization as described (Hellemans et al., 2007; Kodde et al., 2017). Reference genes Hprt1 and Zfand6 were selected based on transcriptome data and stability checked by Q-PCR analyses. Primers for Ucp1 were purchased from Biorad, all other primers from Biolegio (Biolegio, Nijmegen, Netherlands).
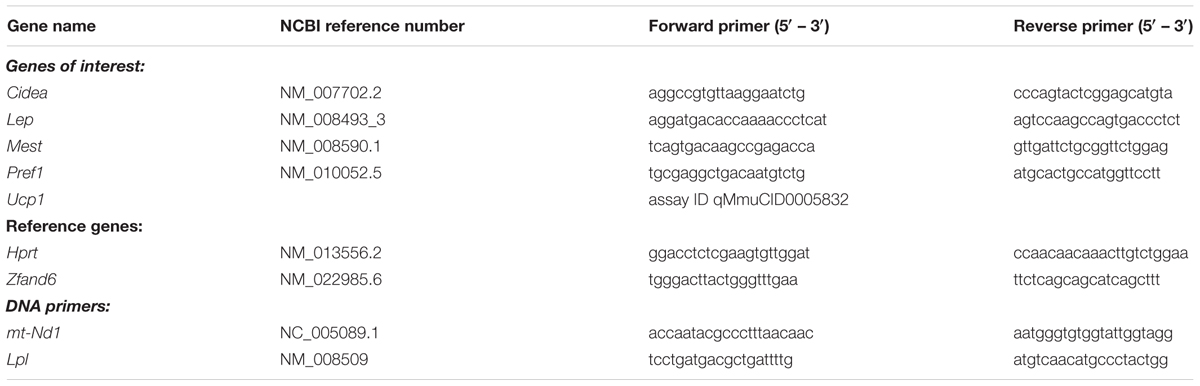
Table 2. Primer sequences.
Enzyme Activity
Citrate synthase (CS) and hydroxyacyl-Coenzyme A dehydrogenase (HADH) activities were measured as described (Shepherd and Garland, 1969; Kodde et al., 2017).
OXPHOS and UCP1 Protein Levels
Protein levels of five subunits (NDUFB8, SDHB, UQCRC2, MTCOI, ATP5A1) representing the five oxidative phosphorylation (OXPHOS) complexes (I–V, respectively) were measured with western blot (Meex et al., 2010; Kodde et al., 2017). Briefly, 15 μg of total protein per sample was used for SDS-PAGE, transfer to a PVDF membrane was done using the TransBlot Turbo (Biorad). Blots were blocked with 5% Protifar (Nutricia, Zoetermeer, Netherlands), incubated with Mito-Profile Total OXPHOS rodent western blot antibody cocktail (Abcam, Cambridge, United Kingdom) as primary antibody and ECL anti mouse IgG (Thermo Fisher Scienctific) as a secondary antibody. OXPHOS protein levels, detected with Supersignal West Dura (Thermo Fisher Sceintific), were related to total protein levels as analyzed by Coomassie brilliant blue staining. Protein levels were detected with the Chemidoc XRS and analyzed by Quantity One (Biorad). The same procedure was used for detection of UCP1 protein levels, except that 5% BSA was used as blocking agent, rabbit anti mouse UCP1 (Abcam, Cambridge, United Kingdom) was used as primary antibody, goat anti rabbit IgG (Santa Cruz, Dallas, United States) as secondary antibody and Supersignal West Femto (Thermo Fisher Scientific) was used for signal detection. A representative Western blot stained for the OXPHOS and for UCP1 proteins and the corresponding Coomassie brilliant blue stained blots are shown in Supplementary Figures 3, 4, respectively.
Mitochondrial DNA Density
Mitochondrial copy number was assessed by the ratio (ΔCt) between nuclear DNA (abundance of lipoprotein lipase (Lpl) DNA) and mitochondrial DNA (abundance of mitochondrial gene NADH dehydrogenase 1 (mt-Nd1) DNA) (Kaaman et al., 2007). Briefly, total DNA was isolated with the QIAamp DNA micro kit (Qiagen Benelux), following instructions of the manufacturer. DNA quantity was determined with Quant-iT Picogreen dsDNA assay kit (Thermo Fisher Scientific). 10 ng input DNA was used for each qPCR reaction. Primers sequences are shown in Table 2.
mRNA Sequencing
RNA samples of ING depots from PN21 and PN98 (n = 4 per time point) were used for mRNA sequencing analysis (NXT-Dx, Gent, Belgium). After RNA quantification (Rediplate 96 Ribogreen RNA Quantitation kit, Life Technologies), RNA libraries were prepared (NEBNext Ultra Directional RNA library Prep Kit for Illumina, New England Biolabs INC., Ipswich, United Kingdom), intact poly(A)+ RNA was isolated (NEBNext Poly(A) mRNA Magnetic isolation Module, New England Biolabs INC., Ipswich, United Kingdom) and cDNA libraries were sequenced (paired end, 100 base pairs) on an Illumina HiSeq sequencer (Illumina Netherlands, Eindhoven, Netherlands). FASTQ sequences were generated using the Illumina Casava pipeline 1.8.2. Quality of the data was assessed using the Illumina Chasitity filter and quality of the reads using the FASTQC quality control tool version 0.10.0. Subsequently, data were mapped on the mouse reference genome mm10 using STAR Aligner 2.3.0 and analyzed with Cufflinks v2.1.1 on Gencode annotation v15. mRNA sequence data have been deposited at the NCBI Gene expression omnibus (GSE116313).
Data Analyses mRNA Sequence Data
Data analysis included contrast analysis (R package Limma) between PN21 and PN98, omitting transcripts whit a FPKM (fragments per kilobase million) of zero in at least one of the samples and including transcripts with an average FPKM > 2 at PN21 or PN98. Principal Component Analysis (PCA) was performed to visualize the samples and results are reported in Supplementary Figure 1. Transcripts with a p-value below 0.05 were used for Ingenuity Pathway Analysis (Qiagen Bioinformatics, Aarhus, Denmark) and targeted analysis as described below.
The data set was examined for changes in brown and white (pre)adipocyte markers derived from Gesta et al. (2007) to get insight in the change in cell population in ING WAT between PN21 and 98.
To further explore changes in mitochondrial function, a list of genes encoding proteins with strong support of mitochondrial localization was derived from Mitocarta (Mouse MitoCarta 2.0, Broad institute), checked for their regulation in the data set, annotated with Nextprot (SIB Swiss institute for bioinformatics) and sorted per function category. When more than one transcript per gene was present in the data set, the transcript with the lowest p-value was used. Some of the genes are listed as non-mitochondrial (11 of 327) in the results table, because these are annotated in Nextprot having a ribosomal, extracellular matrix or cell membrane localization rather than a mitochondrial localization.
Next to this, a list of genes known to be involved in mitophagy was examined in the same data set, to get a better understanding of underlying mechanisms for WAT whitening.
Statistical Analysis
SPSS 19.0 (SPSS Benelux, Gorinchem, Netherlands) was used for statistical analyses. Gaussian distribution was tested with Levene’s test for equality of error variances in all parameters. Differences over time (per depot) were analyzed using Univariate ANOVA. Depot differences over time were analyzed using a two-way ANOVA (Brown-Forsyte) with time and depot as factors. A t-test was used to analyze the effect of the WSD. Data that did not show a Gaussian distribution was analyzed by Kruskall-Wallis for time differences and Mann-Whitney for the adult diet effect. qPCR data is presented as mean relative expression (scaled to average expression) + SEM and all other data is displayed as mean + SEM. Differences were considered significant at p < 0.05 and tendency was reported when 0.05 < p < 0.1. Correlations were analyzed with Pearson’s test.
Results
Body Weight, WAT Weight and Markers of Adiposity
Body weight increased significantly between weaning (PN21) and young adulthood (PN98) (p < 0.001) (Figure 1B), as did the weight of ING, EPI and RP WAT (p < 0.01; Figures 1C–E). In accordance with increased WAT weight, gene expression levels of adiposity (Lep) and adipocyte expansion (Mest) markers increased over time in EPI WAT (p < 0.05 for Lep and p < 0.001 for Mest) and RP WAT (p = 0.06 for Lep and p < 0.05 for Mest), but not ING WAT (Figures 1F–K). Mest and Lep expression levels were increased in ING WAT upon WSD exposure (p < 0.001 for both parameters; Figures 1F,I). Lep expression levels were also moderately increased in EPI and RP WAT upon WSD (p < 0.05 for EPI and p = 0.08 for RP WAT; Figures 1G,H), whereas Mest expression levels were unaffected upon WSD in EPI and RP WAT (Figures 1J,K).
Pref1 expression levels, a pre-adipocyte number marker, decreased in all depots over time (p < 0.001) and most pronounced from PN21 to 42 (Figures 1L–N). In contrast, Pref1 expression levels were in EPI and RP WAT not affected by the WSD, but levels were slightly elevated in ING WAT (p < 0.01).
Markers of Mitochondrial Density
Mitochondrial density measured by citrate synthase (CS) levels, assayed as activity, decreased over time in all WAT depots (p < 0.01; Figures 2A–C). Between PN21 and PN42 CS levels decreased substantially (-56%) in ING WAT (p < 0.05). CS levels were not affected by the WSD in any depot (Figures 2A–C). Activity-based levels of hydroxyacyl-Coenzyme A dehydrogenase (HADH), a mitochondrial enzyme involved in β-oxidation, decreased over time in ING and EPI WAT (p < 0.001; Figures 2G,H), but not in RP WAT (Figure 2I). However, HADH activity tended to decrease in RP WAT upon WSD exposure (p = 0.07; Figures 2G–I). When mitochondrial density was measured as mtDNA copy number no significant decrease over time or upon WSD was found (Figures 2D–F).
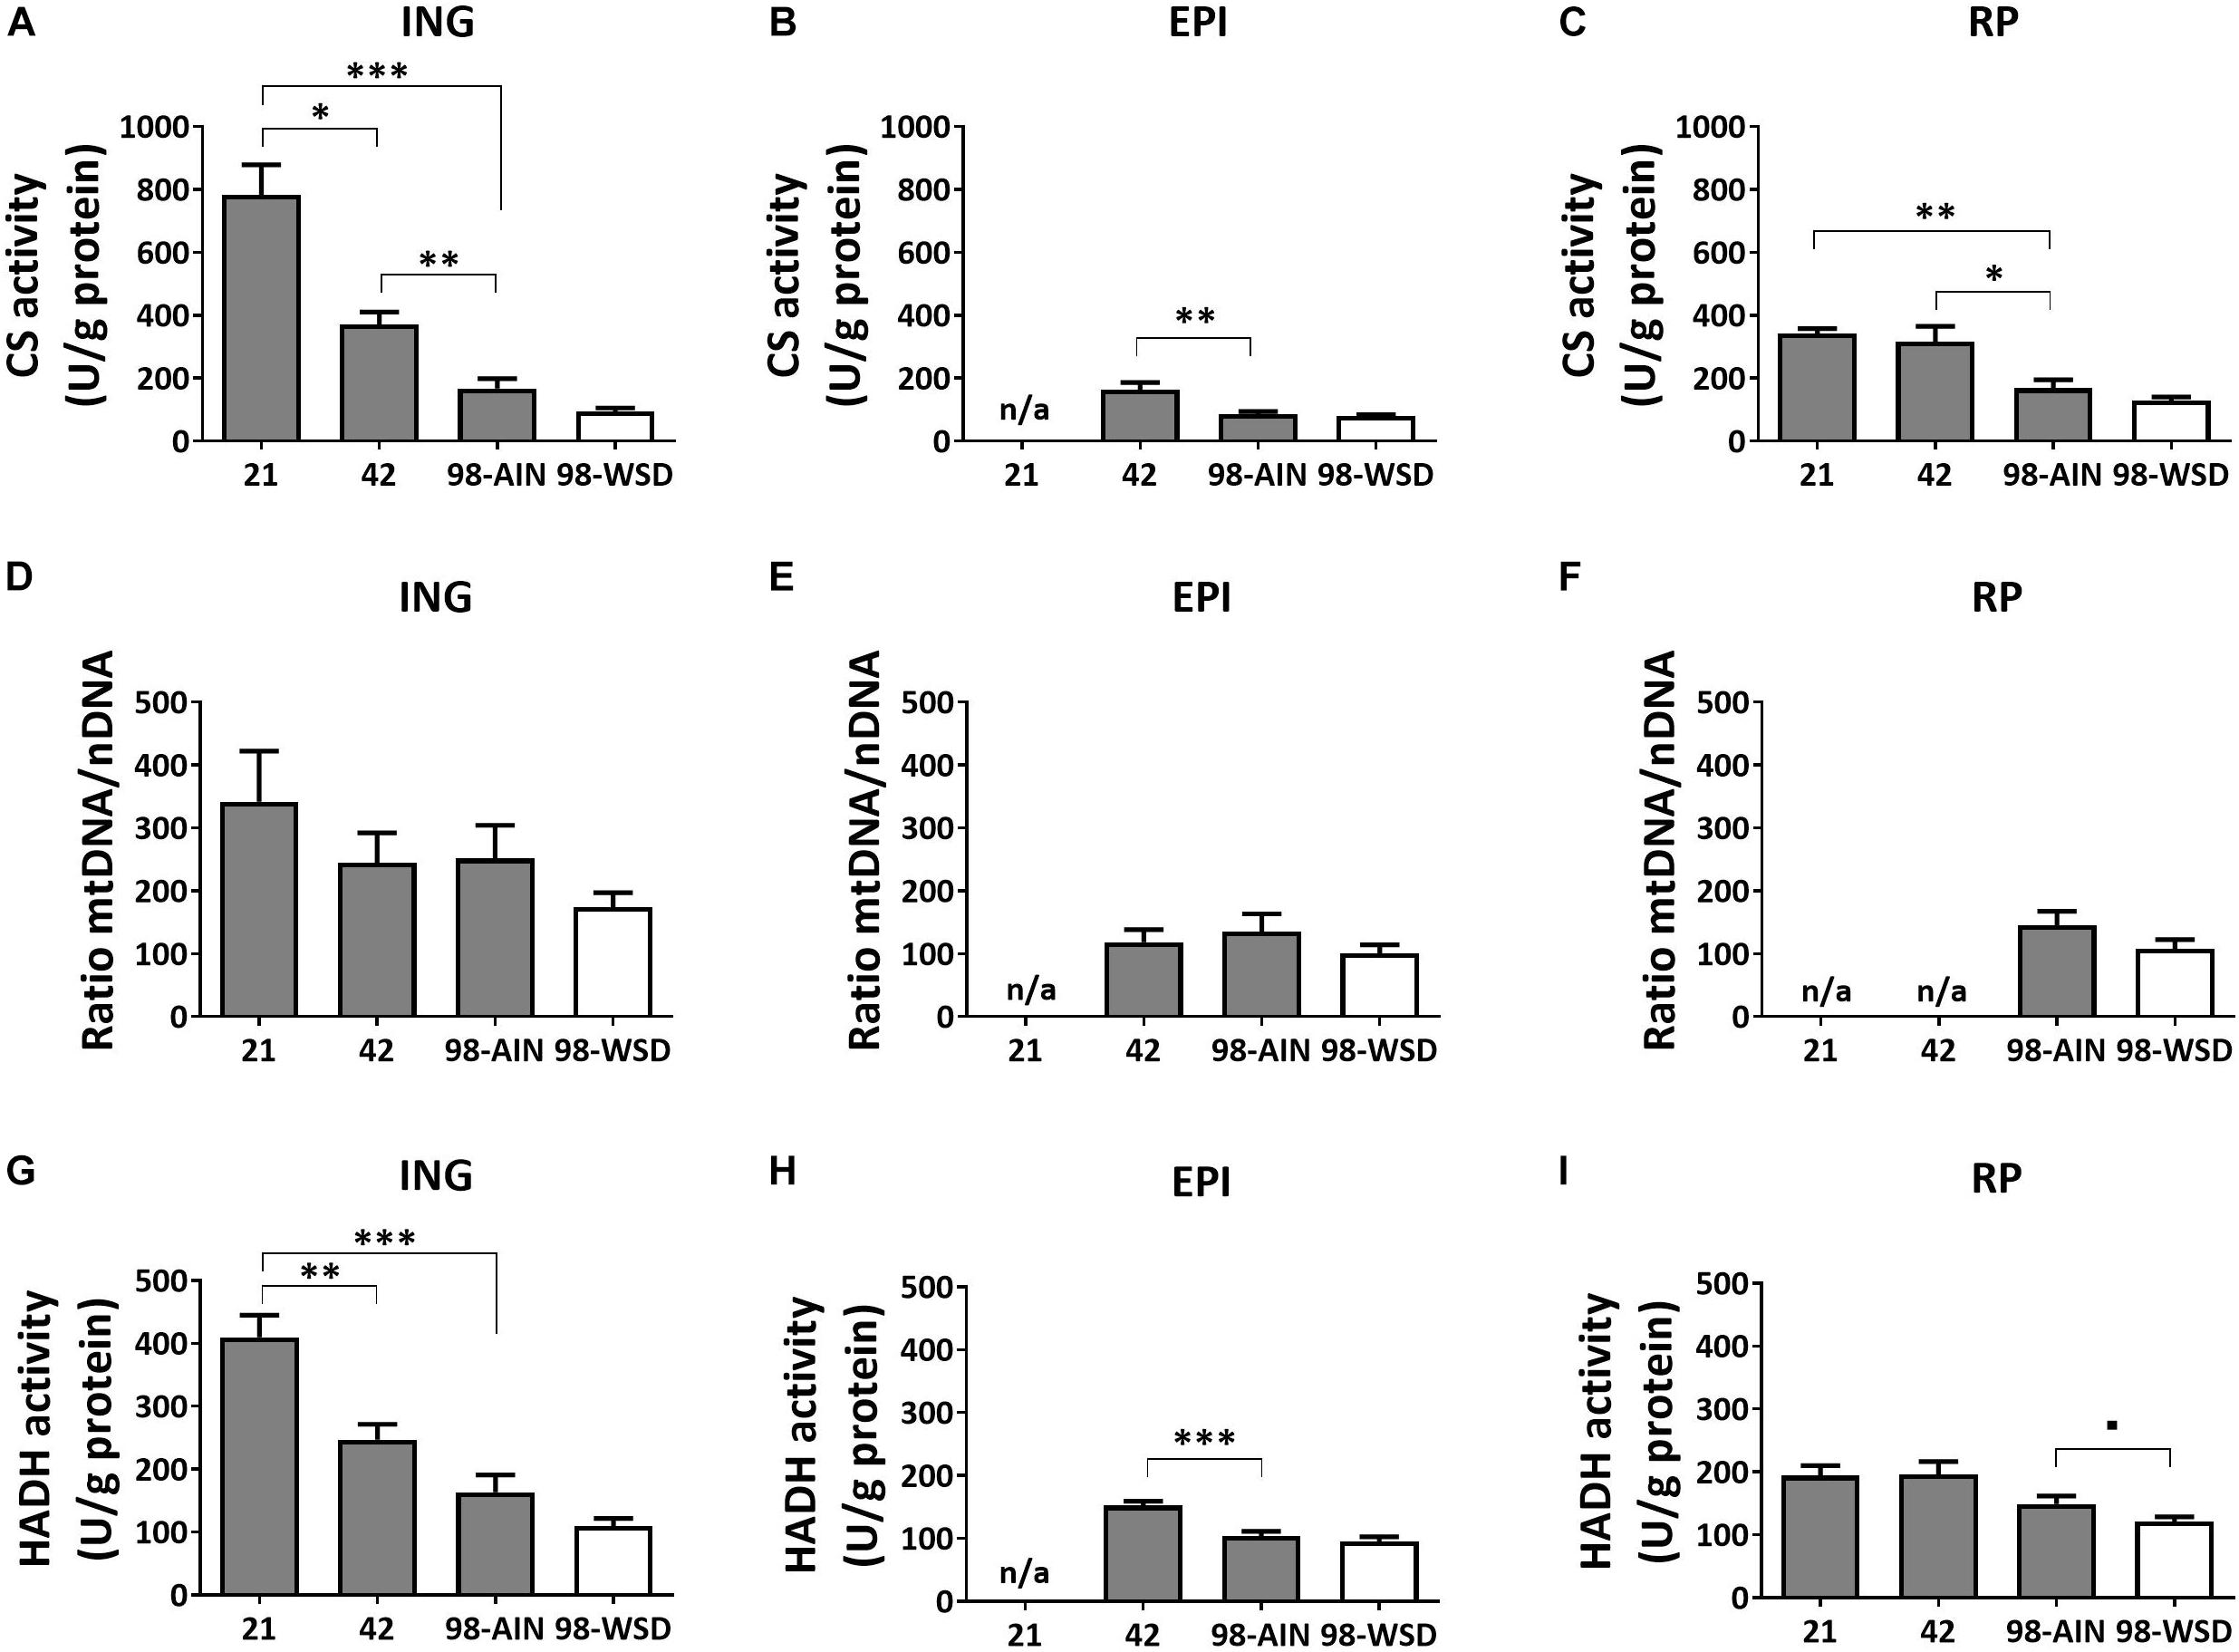
Figure 2. Changes in mitochondrial content markers, citrate synthase (CS), mtDNA and hydroxyacyl-Coenzyme A dehydrogenase (HADH), between PN21 and PN98. CS activity in (A) ING WAT, (B) EPI WAT, (C) RP WAT; mtDNA copy number in (D) ING WAT, (E) EPI WAT, (F) RP WAT; HADH activity in (G) ING WAT, (H) EPI WAT, and (I) RP WAT. PN, postnatal day; AIN, AIM93-M diet; WSD, western style diet. Data expressed as mean + SEM, n = 8 for PN 21 and PN42 and n = 11 for PN98, no data available (n/a) for EPI WAT at PN21 and for RP WAT at PN21 and PN42 for mtDNA copy number. Time and WSD effects were analyzed separately; time effect: ∗p < 0.05; ∗∗p < 0.01; ∗∗∗p < 0.001; WSD effect: ■0.05 < p < 0.1.
Markers of Mitochondrial Oxidative Capacity
Mitochondrial oxidative capacity, measured by protein levels of five subunits representing the five oxidative phosphorylation (OXPHOS) complexes, decreased in ING WAT over time for NDUFB8 (p < 0.01; Figure 3A), SDHB and UQCRC2 (p < 0.01; Figures 3D,G) and upon WSD for UQCRC2 (Figure 3G) and MTCOI (Figure 3J). ATP5A protein expression decreased over time in EPI WAT (p < 0.05; Figure 3N) but was not affected in the ING WAT (Figure 3M). Other complexes of EPI WAT and all complexes in RP WAT remained stable over time and were not affected by the WSD (Figure 3).
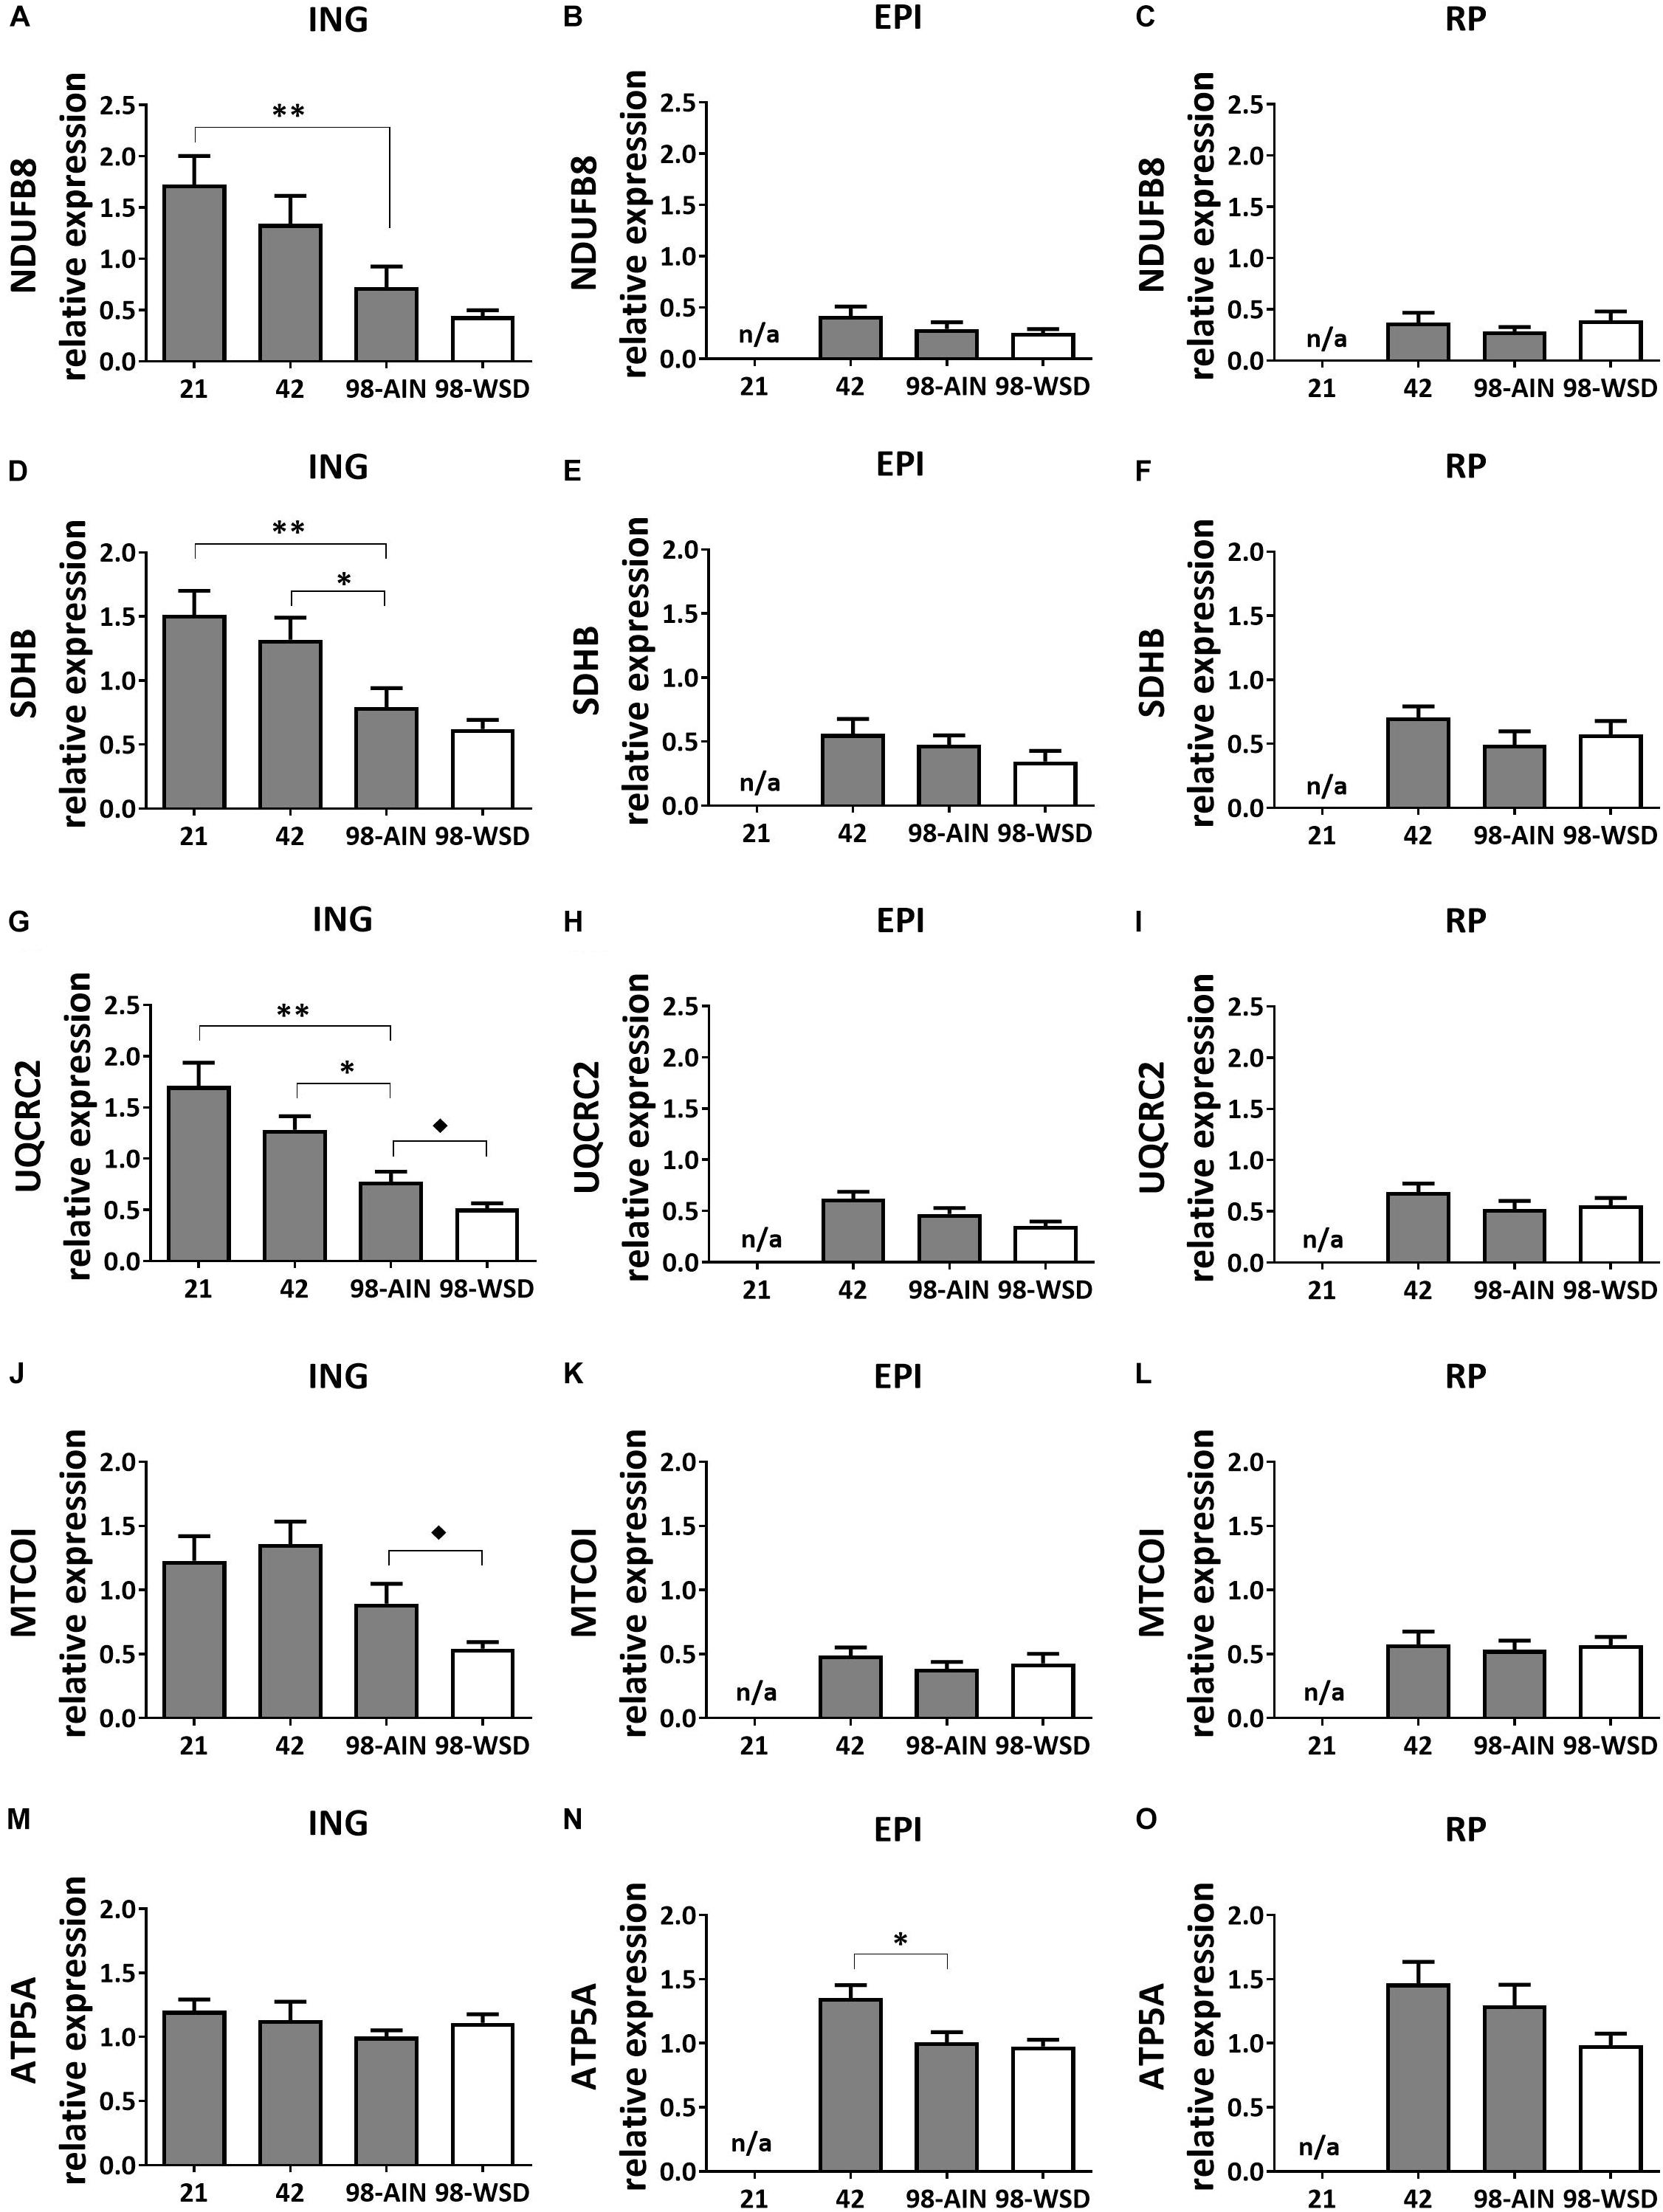
Figure 3. Changes in protein levels of subunits of oxidative phosphorylation complexes I-V between PN21 and PN98. NDUFB8 (Complex I) levels in (A) ING WAT, (B) EPI WAT, (C) RP WAT; SDHB (complex II) levels in (D) ING WAT, (E) EPI WAT, (F) RP WAT; UQCRC2 (complex III) levels in (G) ING WAT, (H) EPI WAT, (I) RP WAT; MTCOI (complex IV) levels in (J) ING WAT, (K) EPI WAT, (L) RP WAT; ATP5A (complex V) levels in (M) ING WAT, (N) EPI WAT, and (O) RP WAT. PN, postnatal day; AIN, AIM93-M diet; WSD, western style diet. Data expressed as mean expression levels corrected for total protein expression (Coomassie staining) + SEM, n = 8 for PN 21 and PN42 and n = 11 for PN98, no data available (n/a) for EPI and RP WAT at PN21. Time and WSD effects were analyzed separately; time effect: ∗p < 0.05; ∗∗p < 0.01; WSD effect: ◆p < 0.05.
Markers of WAT Browning
Gene expression levels of the uncoupling protein Ucp1, as marker for browning of WAT, was relatively high in ING WAT at PN21 and decreased substantial over time (p < 0.001; Figure 4A). Ucp1 expression levels were low in visceral depots, but also decreased over time in EPI WAT (p < 0.01; Figures 4B,C). Cidea gene expression levels were substantially higher in ING WAT compared to visceral depots (Figures 4D,E), but in contrast to Ucp1 remained stable in ING WAT between PN21 and 42, after which Cidea levels declined from PN42 to 98 (p < 0.01). UCP1 protein levels tended to decline from PN21 to 42 and 98 (p = 0.09; Figure 4G) and were low and not changing over time in the visceral depots (Figures 4H,I). Upon WSD exposure, Ucp1 and Cidea gene expression levels decreased in ING WAT (p < 0.05), but remained unaffected in the visceral EPI and RP WAT depots. UCP1 protein levels tended to decline upon the WSD exposure in ING WAT (p = 0.1), was not affected by the WSD in the EPI WAT but increased upon the WSD in RP WAT (p < 0.01). Ucp1 and Cidea expression levels did not change over time in RP WAT (Figures 4C,F). It should be noted that UCP1 protein levels were very heterogeneous at PN98, showing some animals with much higher levels than on average.
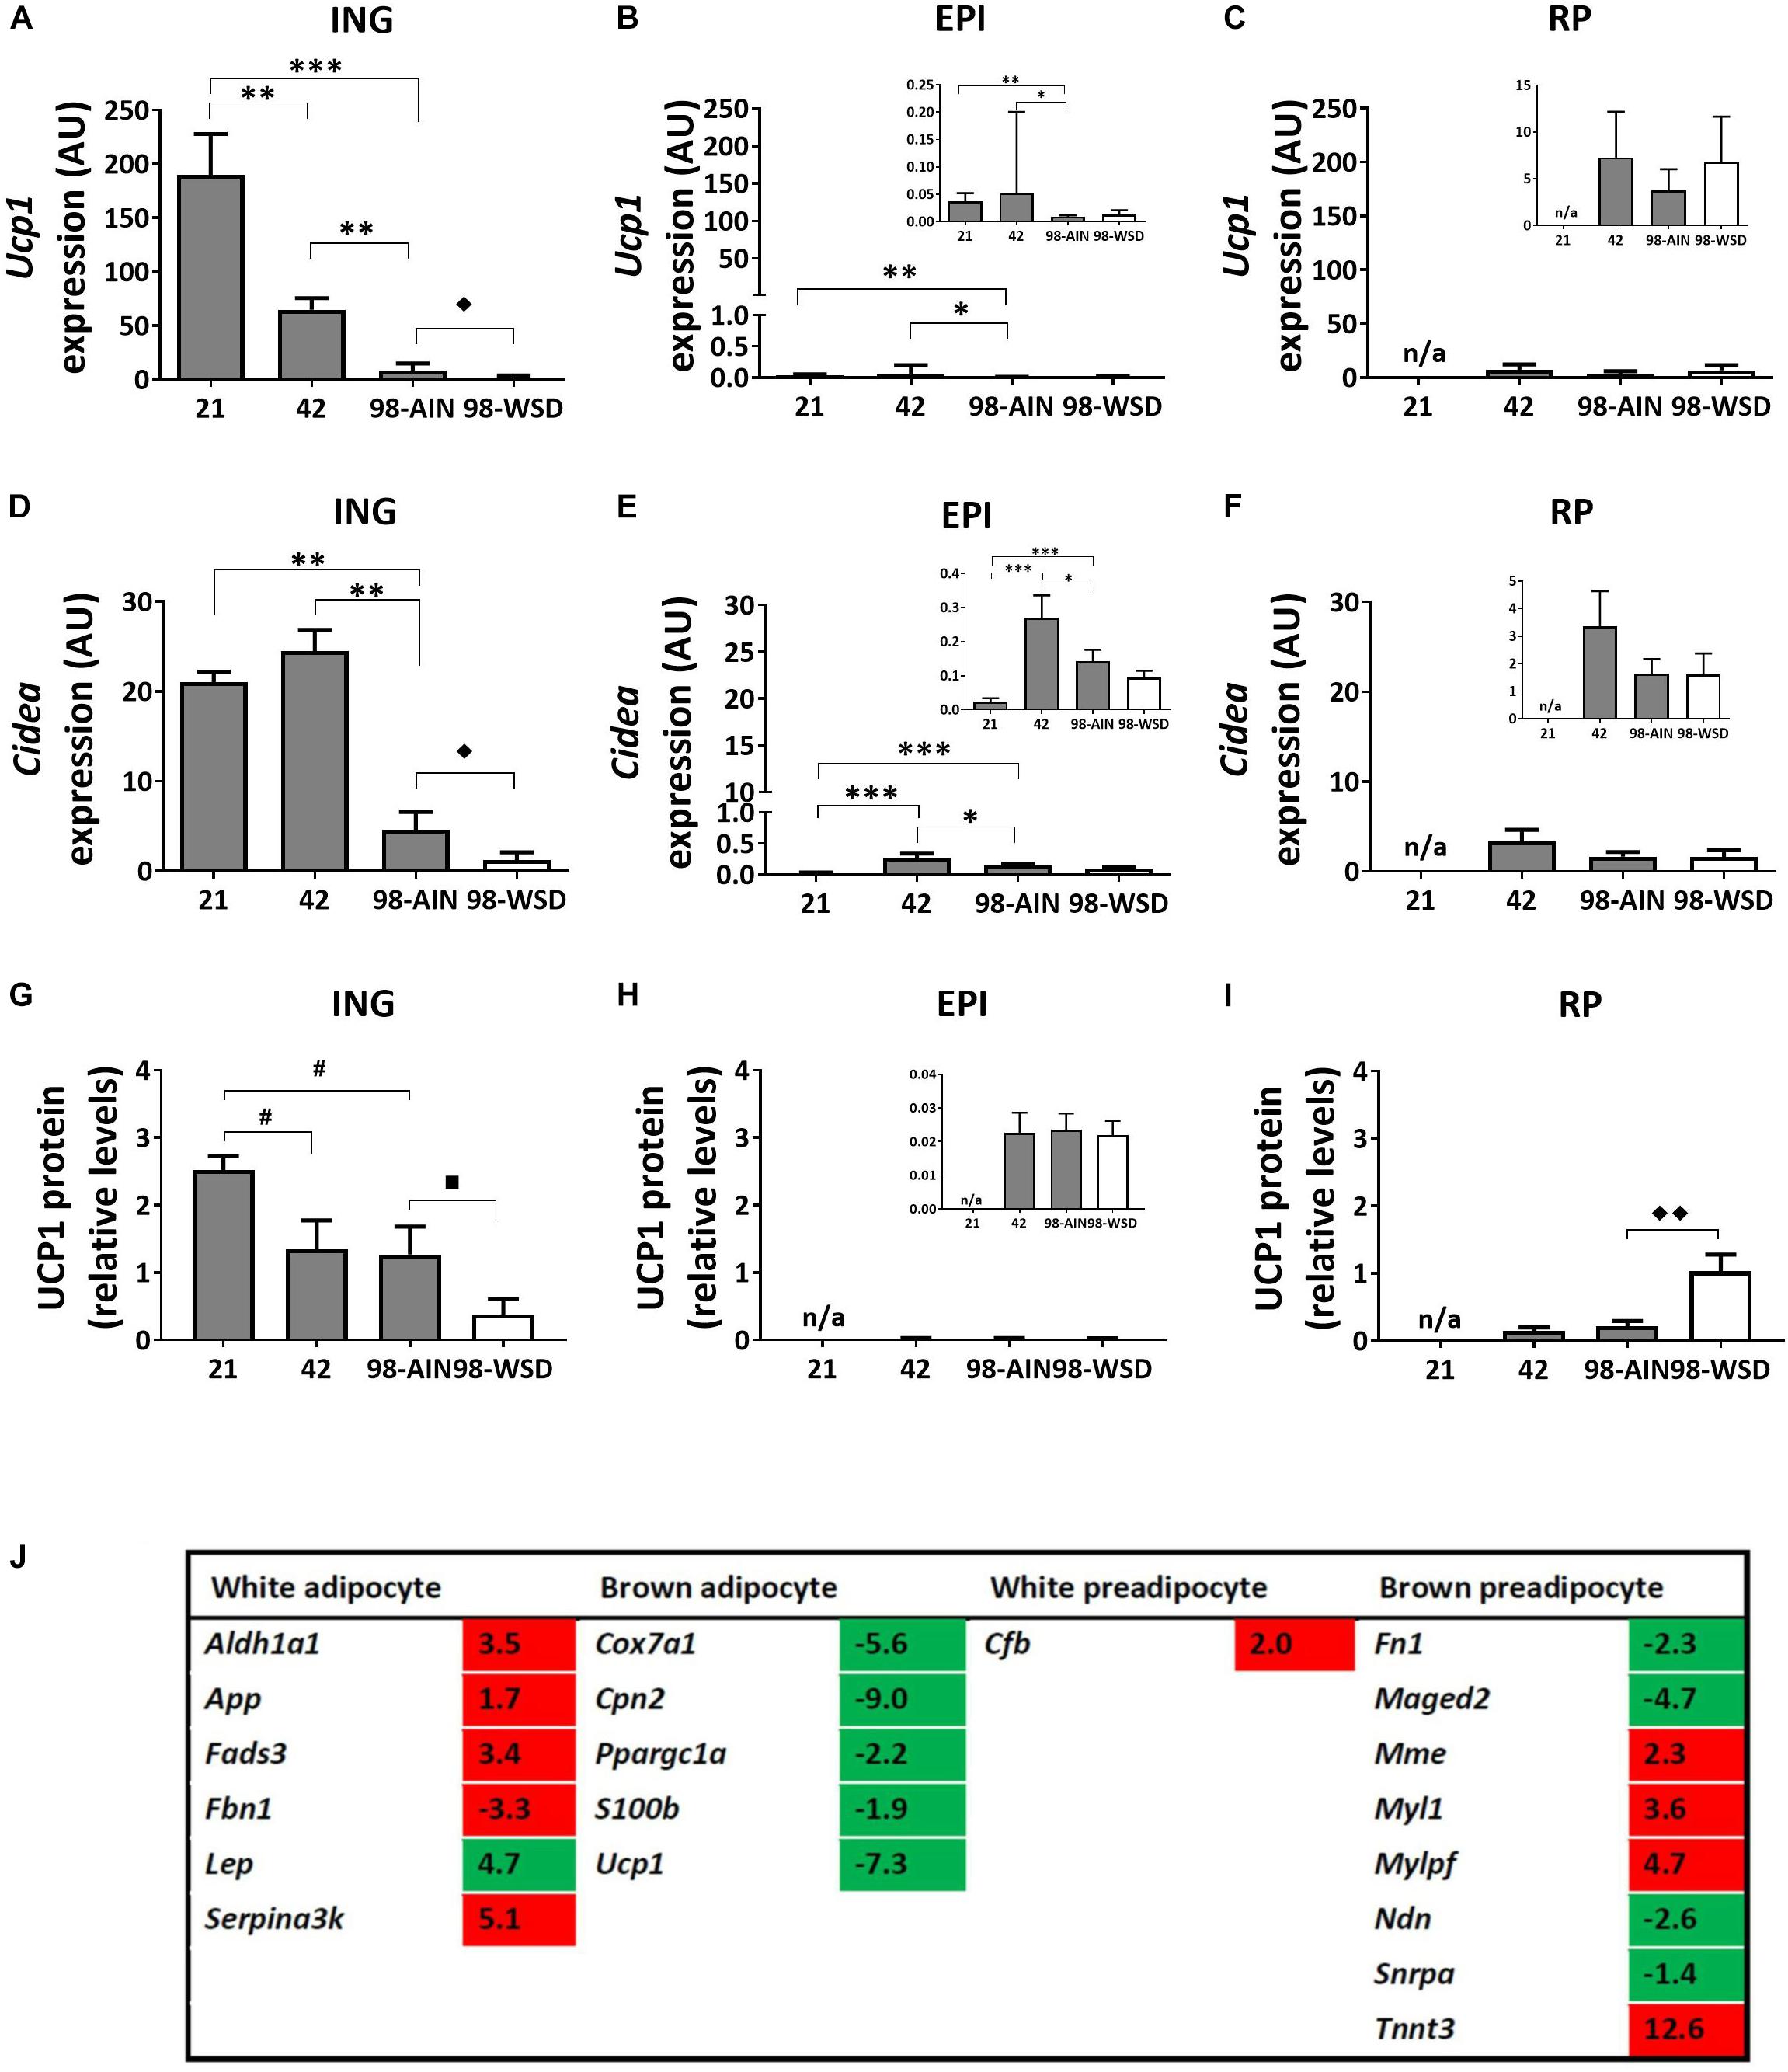
Figure 4. Changes in gene expression of browning markers between PN21 and PN98. Ucp1 gene expression in (A) ING WAT, (B) EPI WAT, (C) RP WAT; Cidea expression in (D) ING WAT, (E) EPI WAT, (F) RP WAT; UCP1 protein levels in (G) ING WAT, (H) EPI WAT, (I) RP WAT; and (J) Regulation of genes selective for brown or white (pre)adipocytes over time, analyzed with mRNA sequencing, gene list derived from Gesta et al. (2007) and expression levels of transcripts with p < 0.05 included in table. Inserts in figures B, C, E, F, and H show the same data with adapted y-axis for better visualization of the low expression data. PN, postnatal day; AIN, AIM93-G diet; WSD, western style diet. Gene expression data expressed as mean + SEM and protein levels as mean levels corrected for total protein (Coomassie staining) + SEM, n = 8 for PN 21 and PN42, n = 11 for PN98, no data available (n/a) for RP WAT at PN21. Time and WSD effects were analyzed separately; time effect: ∗p < 0.05; ∗∗p < 0.01; ∗∗∗p < 0.001; #0.05 < p < 0.1; WSD effect: ◆p < 0.05; ◆◆ p < 0.01; ■0.05 < p < 0.1. Sequence data reported as fold changes between postnatal day 21 over 98. Up regulated values red and down regulated values green.
Depot Differences
ING WAT had overall lower expression of adiposity markers (Lep, Mest; p < 0.001) and higher levels of mitochondrial (CS and HADH activity and OXPHOS subunits I – IV; p < 0.001) and browning markers (Ucp1 and Cidea gene expression and UCP1 protein levels; p < 0.001) compared to both EPI and RP WAT. Especially at PN21 and 42 CS and HADH levels were higher in ING compared to EPI and RP WAT (p < 0.01) and at PN42 levels of OXPHOS complexes I–IV were also higher in ING compared to RP and EPI WAT (p < 0.01). Subsequent decline in CS, HADH and OXPHOS complexes I–IV levels was steeper in ING WAT compared to the visceral depots and resulted in similar CS, HADH and OXPHOS subunit II levels in ING WAT and RP WAT and HADH and subunit II levels being similar in ING WAT and EPI WAT at PN98. Ucp1 and Cidea gene expression levels were also significant higher in ING compared to EPI and RP WAT at PN21 and 42 (p < 0.01) and had a steeper decline over time resulting in comparable Ucp1 gene expression levels in ING and RP WAT at PN98. OXPHOS complex I-IV from the electron transport system, which drives ATP synthesis by OXPHOS complex V, the final step that is bypassed by UCP1 mediated uncoupling. Remarkably, unlike complex I–IV, levels of complex V (represented by ATP5A) were similar between depots.
Pathway Analysis of mRNA Sequence Data
To better understand the changes in mitochondrial density and function markers in ING WAT over time, mRNA of ING WAT at PN21 and 98 was sequenced (n = 4 per time point). 91969 transcripts were found, 23193 of these transcripts had a FPKM value >0 for all samples and an average FPKM > 2 at PN21 or 98. For pathway analysis 5040 transcripts with a p-value <0.05 were used, resulting in a list of pathways which were significant regulated over time (Table 3). Most differentially regulated pathways include those involved in regulation of cell proliferation and growth and pathways involved in hormonal regulation and immune response. Protein synthesis was down regulated over time and pathways involved in the FA metabolism were up regulated over time. Overlap between the regulated pathways was plotted as a network map, showing much overlap between pathways, including those involved in the regulation of cell proliferation and growth as well as pathways involved in hormonal regulation and immune response. Two pathways were less connected to the central network: “mitochondrial dysfunction” and “lipid antigen presentation by CD1” (Supplementary Figure 2). The “mitochondrial dysfunction” pathway contained genes representing subunits of the oxidative phosphorylation and other genes involved in the function of mitochondria, and its IPA name follows the general idea that downregulation of the genes contained in this pathway is associated with dysfunctional mitochondria, like in T2D, Alzheimer’s or Parkinson’s disease. Although ingenuity pathway analysis did not indicate a direction for the change in the mitochondrial dysfunction pathway, 35 of the 44 regulated genes in this pathway were down regulated over time, what may indicate that mitochondrial function is reduced at PN98 compared to PN21 in ING WAT (Supplementary Table 1).
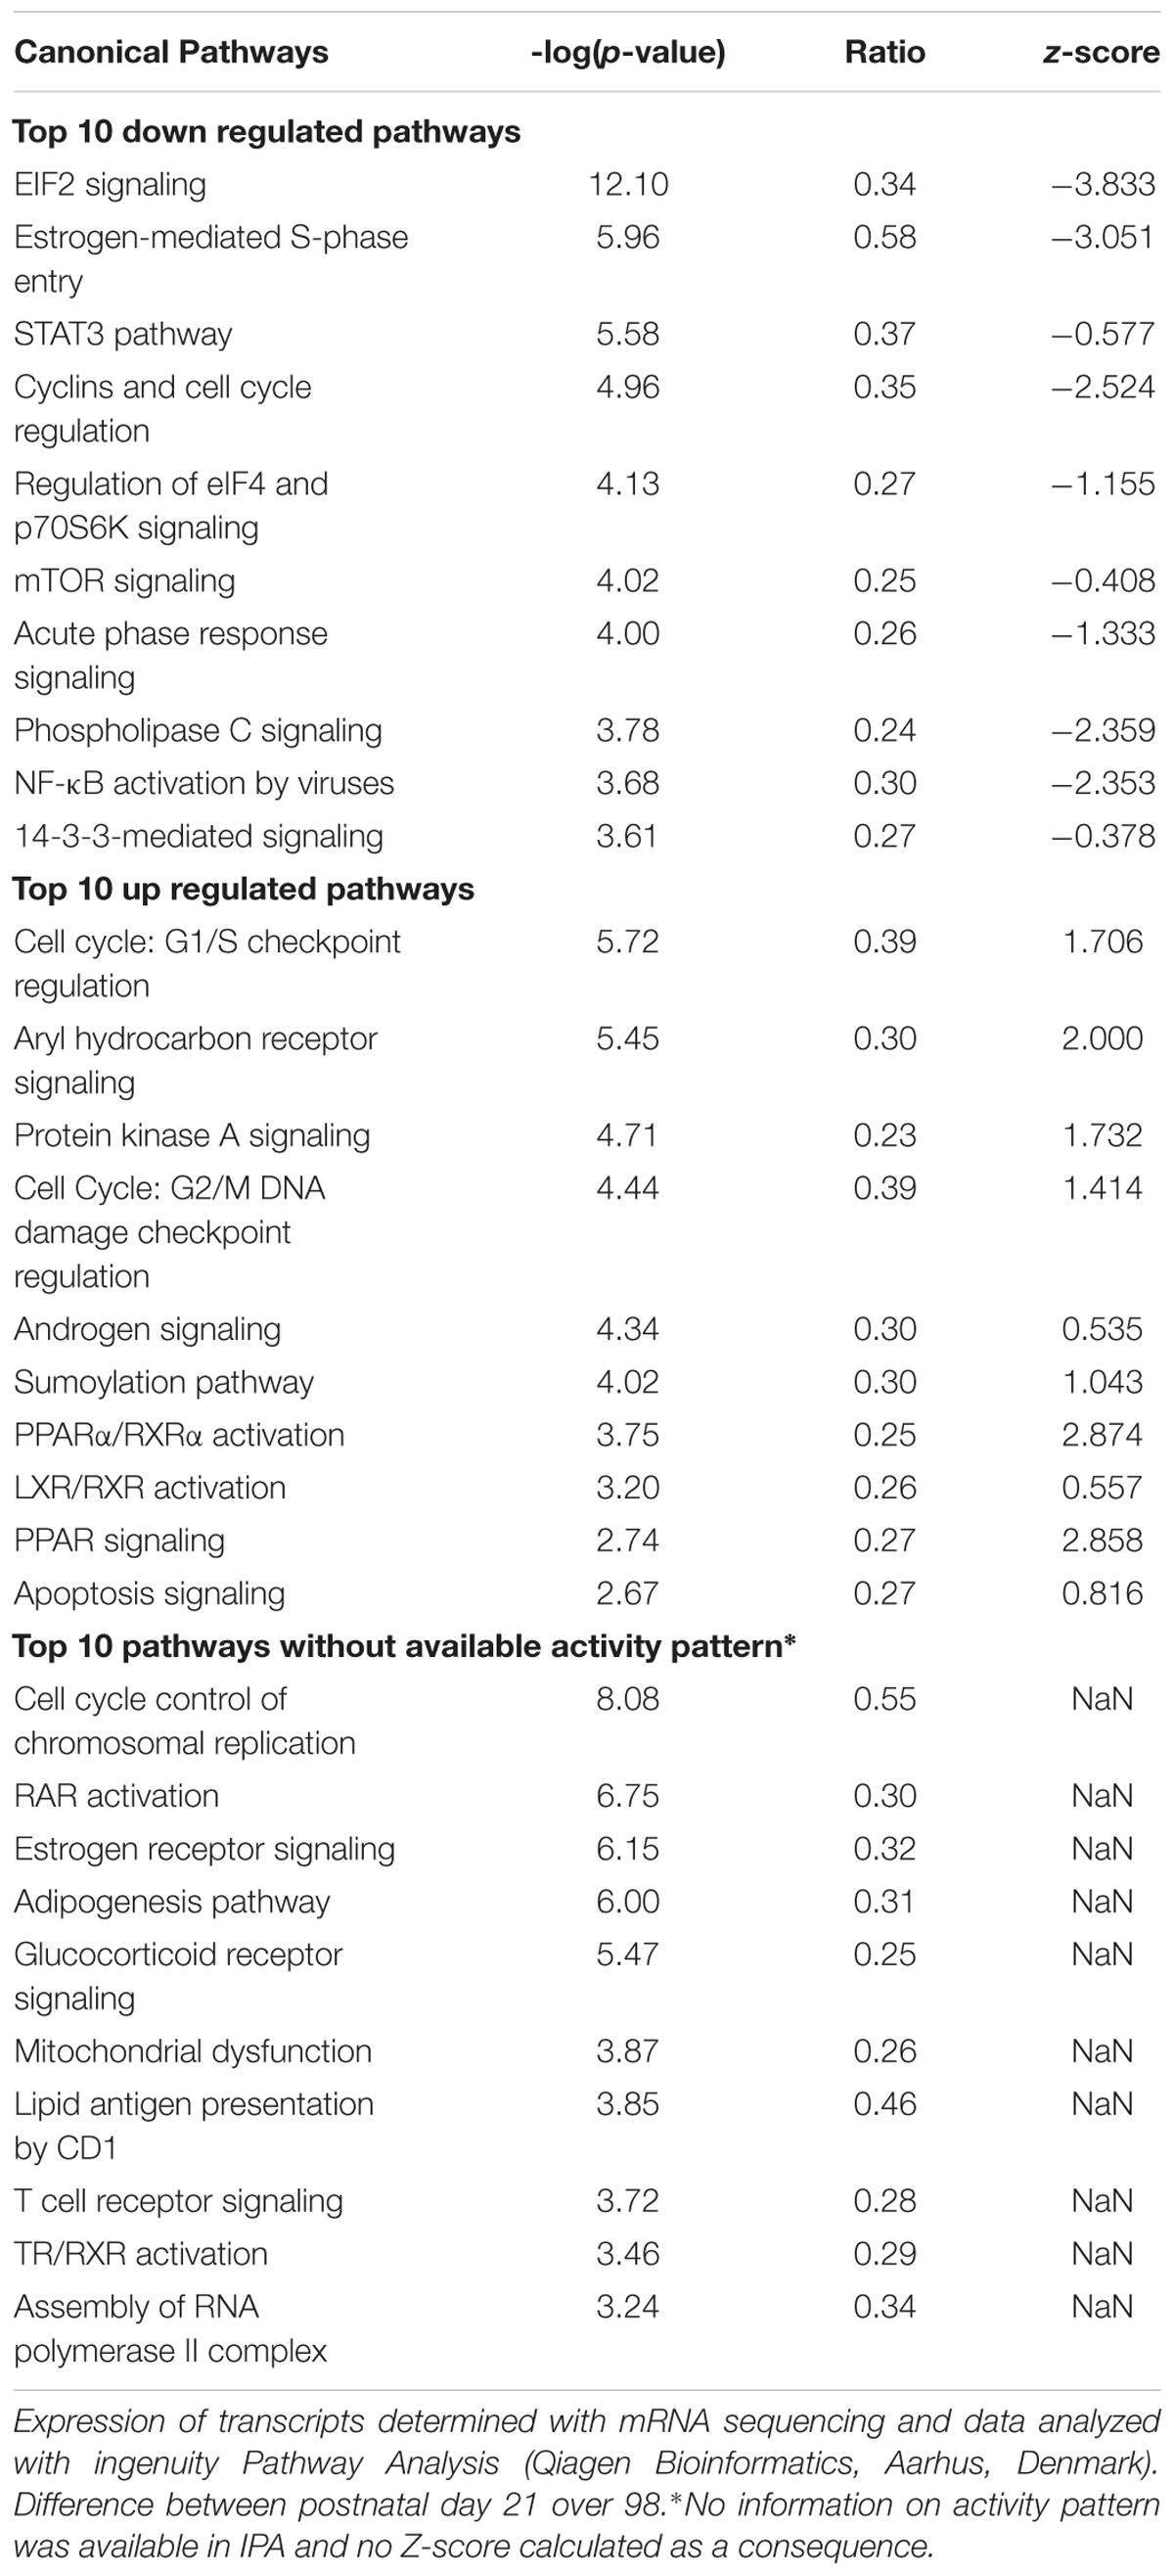
Table 3. List of significant regulated pathways at PN98 as analyzed by ingenuity pathway analysis (IPA).
Targeted Analysis of mRNA Sequence Data
A list of brown and white preadipocyte and adipocyte markers was extracted from literature (Gesta et al., 2007) and checked for their expression in the mRNA sequence data (the 5040 transcripts with p < 0.05) to get insight in possible changes in cell populations in ING WAT between PN21 and 98. Expression levels of brown adipocytes markers declined and levels of white adipocytes markers increased from PN21 to 98 (Figure 4J and Supplementary Table 2 for the complete list of markers). For preadipocytes the picture is less clear, some brown preadipocytes markers were up and others were down regulated over time. Of note, the list of markers was extracted from the review of Gesta et al. (2007) and based on results of different experiments, the brown preadipocytes markers which were up regulated over time originate from another experiment than the down regulated markers (Boeuf et al., 2001; Timmons et al., 2007). The list of white preadipocytes markers is short and only one of these genes was abundant in our data set and up regulated over time.
A list of genes of which mitochondrial localization is strongly supported (Mitocarta, 1158 genes) were checked for expression in the data set to further explore functional changes of the mitochondria over time. 327 genes of this list were identified in the data set, of which 231 gene were down regulated, 88 up regulated and 8 genes had discrepancy in regulation between different transcripts. Genes involved in energy metabolism and protein syntheses were down regulated over time, including oxidative phosphorylation, citric acid (TCA) cycle, β-oxidation, import, transport and translation. The up regulated genes showed more diversity in function, including glycolytic metabolism, lipid synthesis, biosynthesis and mitophagy. The list with genes categorized to function is shown in Supplementary Tables 3, 4. A summary of these findings is presented in Figure 5.
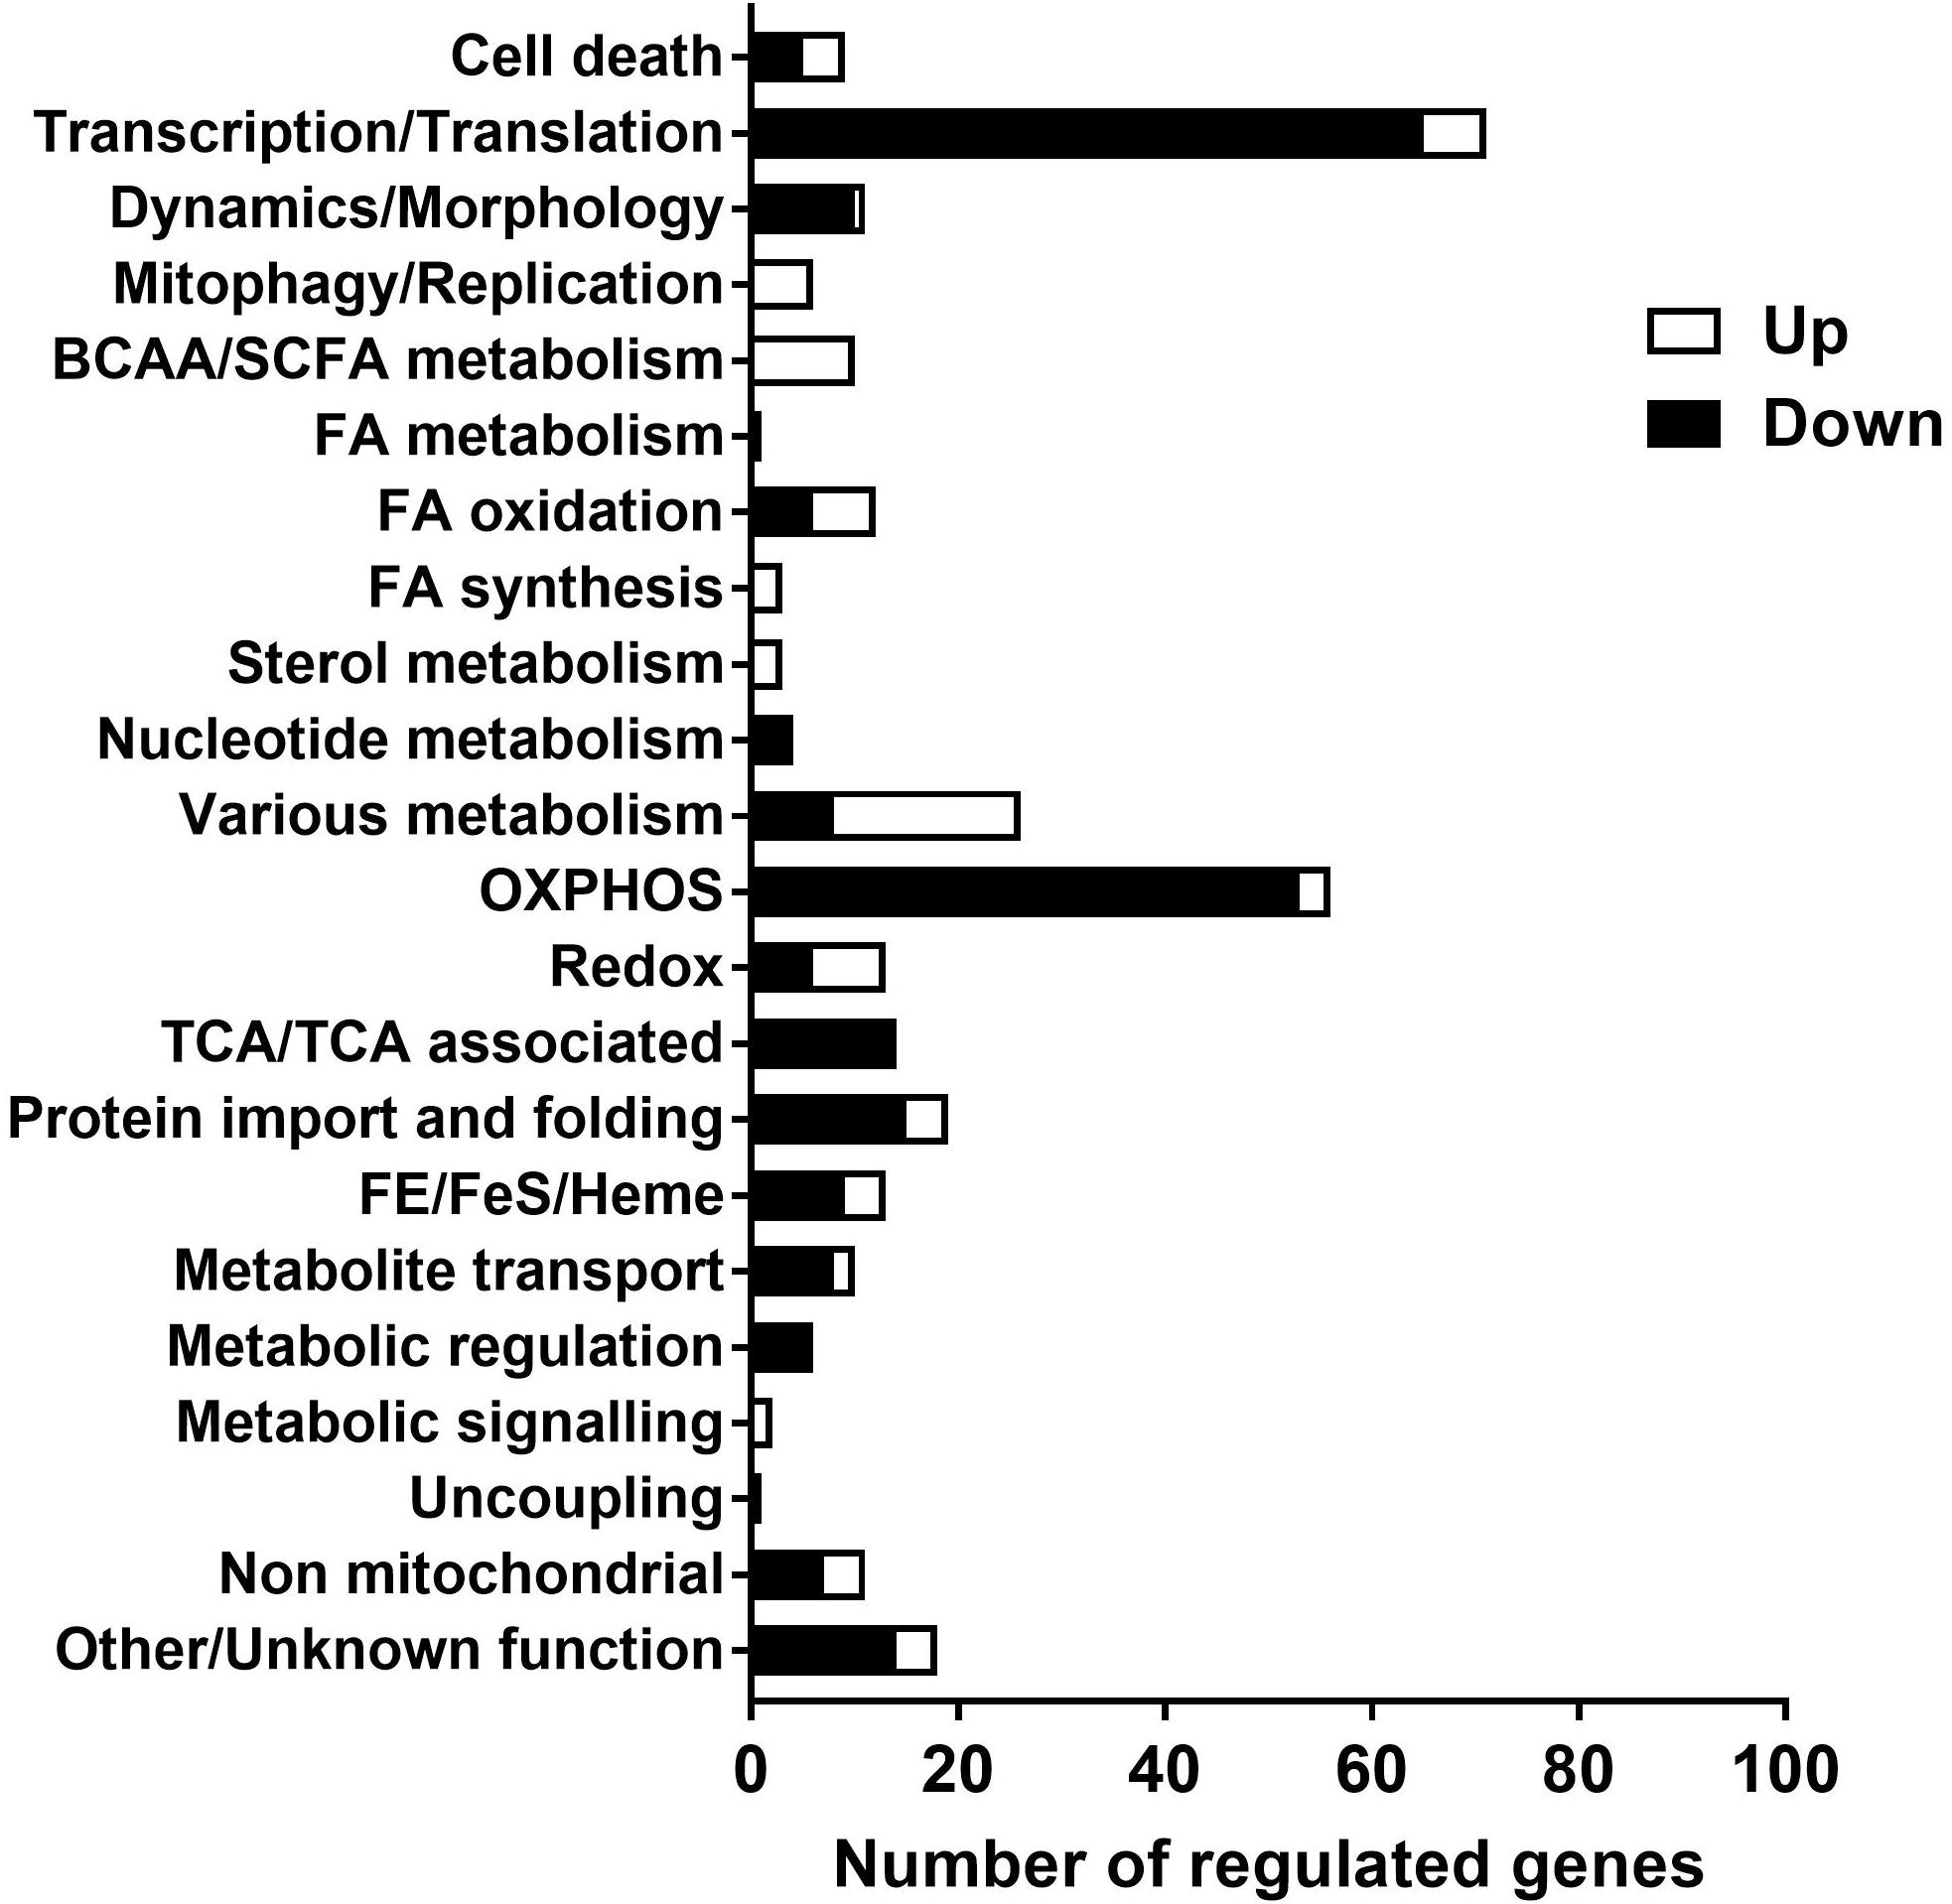
Figure 5. Functional categorization of regulated genes (PN21 over 98) with a strong support for mitochondrial localization. Expression of transcripts analyzed with mRNA sequence, of the transcripts with p < 0.05 genes encoding proteins with strong support of mitochondrial localization (Mouse MitoCarta 2.0, Broad institute) were selected and functional categorized with Nextprot (SIB Swiss institute for bioinformatics). The full list of genes with functional categorization is shown in Supplementary Tables 3, 4.
Established mitophagy/autophagy markers (Ding and Yin, 2012) were extracted from the mRNA sequence data and their regulation was studied for insight in potential underlying mechanisms of WAT whitening and results are reported in Table 4. Microtubule-associated protein one light chain three alpha (Map1lc3a, better known as Lc3), sequestosome 1 (Sqstm1, better known as p62), unk-51 like kinase 2 (Ulk2), PTEN induced putative kinase 1 (Pink1) and BCL2/adenovirus E1B interacting protein 3 (Bnip3) were upregulated at PN98 compared to PN21. To further support this data, LC3 protein levels were analyzed with western blot. LC3.2 protein levels increased between PN21 and 98 in ING and RP WAT and were unchanged in EPI WAT (Supplementary Materials and Supplementary Figure 5). Regrettably, LC3.1 protein levels were not detectable in these samples under these conditions and ratios between LC3.2 and LC3.1 could therefore not be calculated.
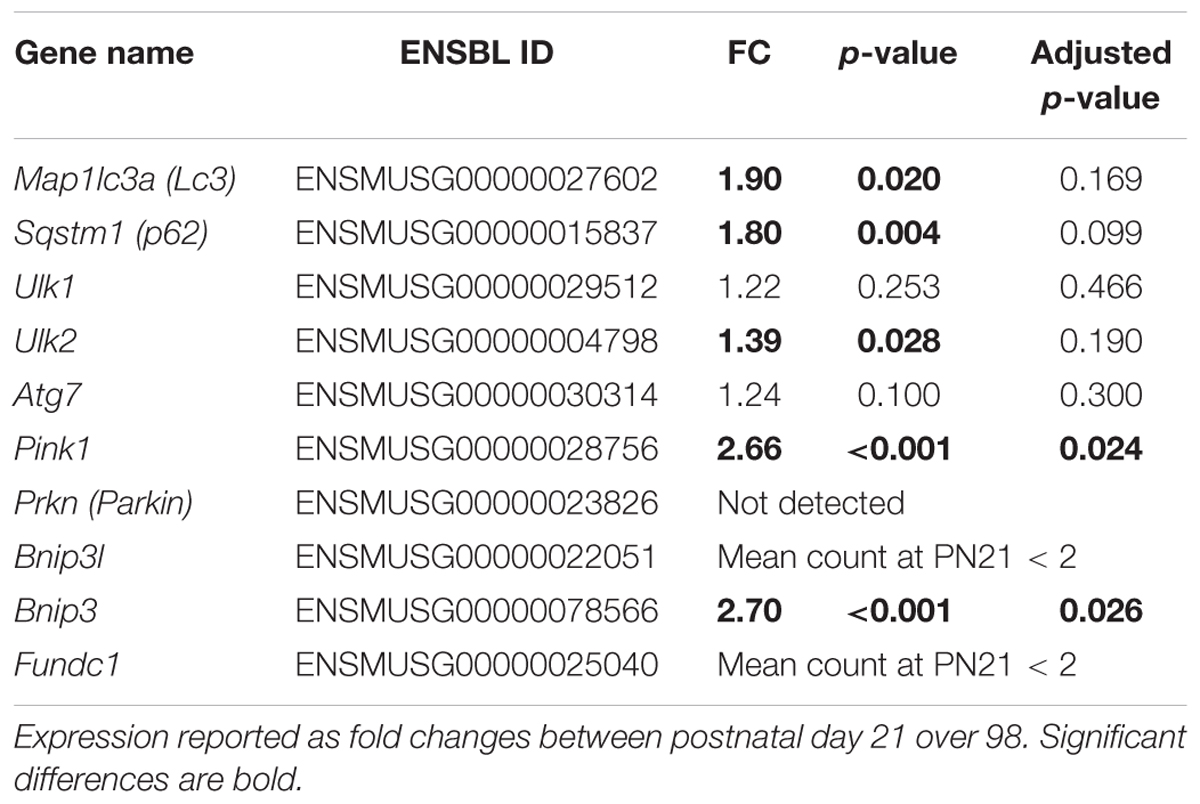
Table 4. Regulation of mitophagy/autophagy markers in ING WAT from PN21 to 98 as measured with RNA sequencing.
Correlations
There were many correlations between mitochondrial density and function markers and WAT weight (Table 5). Specifically, the inverse correlation between CS and HADH levels and weight of the corresponding depot was consistently strong in all depots. ING WAT weight was also inversely correlated to levels of the electron transport system complexes (OXPHOS complexes I–IV). In contrast, no correlation was found between ING WAT weight and the level of OXPHOS complex V (ATP5A; Table 5). RP WAT demonstrated opposite findings: the electron transport system complexes did not correlate with WAT weight, but complex V (ATP5A) showed a mild, inverse correlation with WAT weight. Lep gene expression was correlated to WAT weight for each of the depots, but this correlation was stronger in the visceral depots compared to ING WAT. Ucp1 expression, a key marker for browning of WAT, in ING WAT was correlated to mitochondrial density (CS and mtDNA, Table 5) and function markers (OXPHOS complexes I–IV), but not in RP WAT. In EPI WAT Ucp1 expression was only to some extent correlated to CS and HADH levels. Ucp1 expression in ING WAT was not correlated to complex V levels.
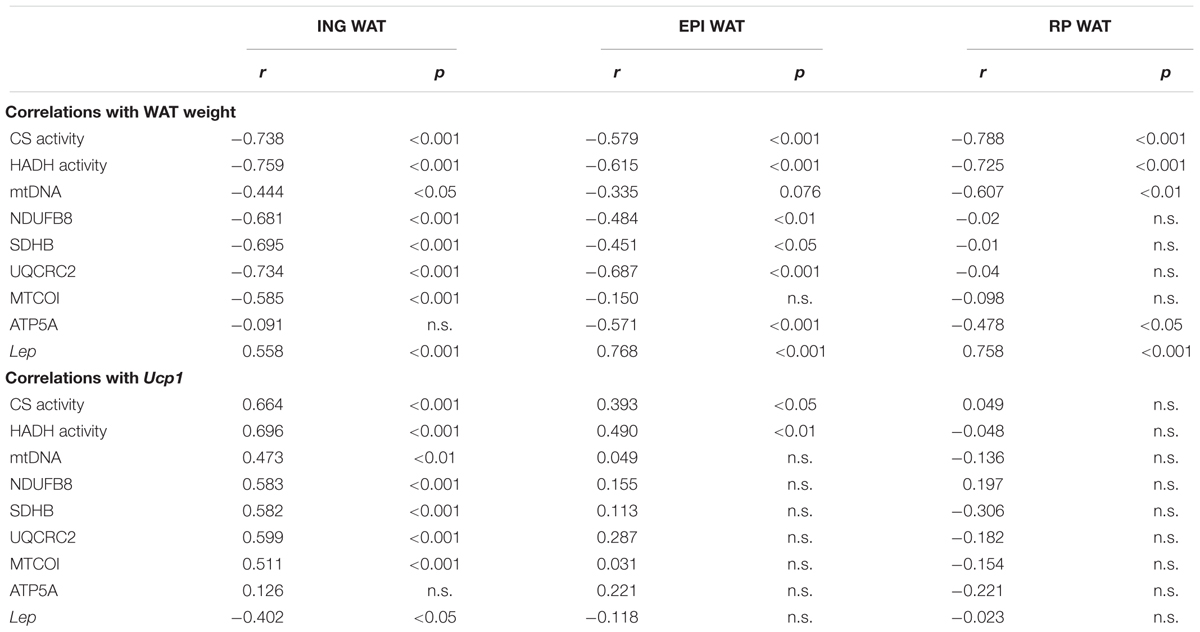
Table 5. Correlations between WAT weight v. Ucp1 gene expression and mitochondrial function markers, Lep gene expression.
Discussion
In this study, we show clear changes in markers for mitochondrial density, mitochondrial function and browning in ING, EPI, and RP WAT depots of C57BL/6j mice after weaning up to young adulthood. We show that an increase in WAT depot mass and elevated levels of adiposity markers is associated with a decline in mitochondrial density over time in all depots. This decline was depot specific, being most pronounced in ING WAT with the steepest drop from PN21 to 42 and was accelerated by the WSD challenge. RNA sequence data from the ING depot showed that the decline in mitochondrial density was accompanied by a transfer from active, ATP producing mitochondria with a clear uncoupling potential toward mitochondria with a more diverse metabolic function and a higher biosynthesis. The RNA sequence data also showed that ING WAT developed from a “browner” toward a “whiter” phenotype with increased coupled mitochondria. These data also show that this is accompanied by an increased mRNA expression of mitophagy markers.
The present study aimed to comprehensively compare postweaning changes of markers for mitochondrial function and WAT browning in three different WAT depots. There is evidence from one other study showing decreasing mitochondrial enzyme activity in human subcutaneous WAT from the postnatal period to adulthood (Novak et al., 1973), which is in accordance with the findings in our study. Previous experiments in rats showed lower mitochondrial respiration, enzyme activity and mitochondrial abundance in ING compared to EPI WAT, both when measured in whole tissue or isolated adipocytes (Prunet-Marcassus et al., 1999; Deveaud et al., 2004). But a study in adult mice showed a higher mitochondrial performance in isolated mitochondria of ING compared to EPI WAT while mitochondrial density was not different between the depots (Schottl et al., 2015). In the present study respiration was not measured, but the results were more in agreement with the later study, showing higher mitochondrial enzyme, OXPHOS protein and RNA marker levels in ING compared to EPI WAT of young mice. Moreover, the results of this study showed that the differences in mitochondrial density and function markers between ING and visceral WAT are age specific, being prominent at weaning and much smaller in early adulthood.
The declining mitochondrial density and function markers from weaning to young adulthood in ING WAT was accompanied by a diminished gene expression of the WAT browning markers Ucp1 and Cidea. UCP1 proteins levels tended to decrease accordingly, although statistical significance was not reached for the older AIN93 animals. Subcutaneous depots are more prone to WAT browning than visceral depots and have a higher abundancy of adipocytes with a brown-like phenotype, that can be activated upon cold exposure (Wu et al., 2012). The higher levels of WAT browning markers at weaning may therefore be part of a protective response of the vulnerable pups to the colder environment in the postnatal period, comparable to the uncoupling response in the brown adipose tissue (Obregon et al., 1989). Indeed, the decreased expression of brown adipocyte markers in the RNA sequence data at PN98 suggests that abundance of brown or brown-like adipocytes, with the capacity to produce heat, is declining over time. This is in line with evidence of other mice studies showing browning of the WAT depots from PN10 to 20 and subsequent whitening from PN20 to 30 (Xue et al., 2007; Lasar et al., 2013; Birnbacher et al., 2018) a process that has shown to be strongly genetically controlled (Chabowska-Kita et al., 2015). The increased abundancy of white adipocytes, with their lipid storage and insulation capacity, at the same time point further supports this explanation. This also provides an explanation for the differences between subcutaneous and visceral WAT, of which the latter showed a much lower expression of the browning makers Ucp1 and Cidea. Again, this it is fully in line with the developmental needs of a young pup, being small and vulnerable to cold stress, to a large, more mature individual with a sufficient layer of thermal insulation provided by WAT. This notion is supported by the substantial decline in preadipocyte marker expression from PN21 to PN42 and the increased expression of white adipocyte markers at PN98. The latter indicates that preadipocytes differentiated to adipocytes between those time points, a process that is probably already ongoing at PN21. Indeed, the decline in preadipocyte marker expression is previously reported and there coincided with an increased expression of adipocyte marker expression (Xue et al., 2007). Environmental factors, like dietary interventions or early life stress (Yam et al., 2017), may change the pace of whitening and subsequently have long-lasting effects on the oxidative and storage capacity of WAT depots. It would be of interest to investigate the effects of temperature on postweaning changes, in particular by repeating the experiment under thermoneutrality, but also at intermediate and lower low-ambient temperatures, and what the consequence of changes in the pace of whitening of the WAT depots is for later life metabolic health and WAT function. Moreover, investigating the pace of whitening and subsequent later life health consequences in UCP1 knockout or other relevant genetic mouse models or investigating the consequences of different aspects of the weaning process (maternal separation, dietary switch and early/late weaning) can give insight in the underlying mechanisms.
Recent publications revealed that the whitening of WAT is controlled by autophagy induced mitochondrial clearance (mitophagy), indicated by the activation of mitophagy during the beige to white transition in cultured adipocytes following β3-AR agonist withdrawal and the impaired whitening when autophagy is deleted in knock-out mouse models (Altshuler-Keylin et al., 2016; Lu et al., 2019). Therefore, we checked the regulation of genes known to be involved in mitophagy (Ding and Yin, 2012) in ING WAT between PN21 and 98, the depot where changes in mitochondrial abundance and expression of browning markers was biggest. Indeed, genes involved in mitophagy were upregulated over time, as was the protein level of the autophagy marker LC3.2, confirming the role of mitophagy in whitening of WAT depots.
Our data on mitochondrial metabolic pathways show that mitochondria develop from organelles with a high expression of pathways directed at energy production (and dissipation), as in brown adipocytes (Forner et al., 2009), toward coupled mitochondria which display a wider variety of biochemical pathways. Part of the changes may be related to maturation of ING WAT, since expression of proteins involved in fatty acid metabolism and of mitochondrial chaperones has been shown to increase during adipogenesis (Wilson-Fritch et al., 2003). In ING WAT of the more mature PN98 mice we observe a much smaller number of genes related to especially protein import, translation and OXPHOS as well as nucleotide metabolism, suggestion a decrease in mitochondrial “growth”/biogenesis, while genes related to lipid synthesis, branched chain amino acid/short chain fatty acid metabolism, steroid metabolism and redox signaling appear, as well as a substantial number of genes related to diverse biosynthetic pathways (Figure 5). This indicates that the mitochondria have reached a condition where they interact more with the rest of the cell, no longer unilaterally focused on growth and energy metabolism (and dissipation) only. This especially suggests that ING WAT mitochondria have reached a steady state, which is supported by the appearance of autophagy and apoptosis genes, essential for mitochondrial (and cellular) turnover and quality control (Zimmermann and Reichert, 2017). Our data further indicate that ING WAT between PN21 (and possibly earlier) and PN42 provides a physiological relevant model to study and better understand functional changes in mitochondria related to adipose tissue development and mitochondrial adaptive capacity and to understand mitochondrial changes related to WAT whitening.
The changes in the functionality of the mitochondria in the WAT depots and the remodeling of these depots in early life may have an impact for intervention studies starting in early life, as the effect of the intervention may be very dependent on the starting point of the intervention. In line with the developmental origins of health and disease theory (Hales and Barker, 2001; Gluckman and Hanson, 2004), developmental processes may respond in a manner to optimally match an individual to anticipate later life conditions (Hanson and Gluckman, 2014). Previous studies in our lab showed that the postnatal period is amendable to nutritional programming since a relative mild dietary intervention at weaning indeed increased levels of later life mitochondrial oxidative capacity (Kodde et al., 2017). Although the perspective is there, additional studies are needed to fully understand to which extent nutritional interventions in the timeframe of weaning provides a window of opportunity for protection against later life metabolic disease.
Conclusion
The present study showed a decline in mitochondrial density and oxidative capacity markers in WAT depots of young C57Bl/6j mice over time while adipose tissue mass increased in size. The decline is more explicit in ING WAT compared to the visceral depots and is accompanied by an evolution from a browner, energy dissipating, to a whiter, biosynthetic, adipose tissue phenotype. These developmental changes may provide an opportunity to program a healthy WAT mitochondrial phenotype by nutritional interventions during the weaning period.
Ethics Statement
All animal procedures were in accordance with the principles of good laboratory animal care following the EU directive for the protection of animals used for scientific purposes and approved by an external, independent Animal Experimental Committee (DEC consult, Soest, Netherlands).
Author Contributions
AK, EE, and KvL conducted the experiments. AK and JK analyzed the data and drafted the manuscript. AK, AO, and JK interpreted the results. AK prepared the figures. All authors contributed to the design of the study, edited and revised the manuscript, and approved the final version of the manuscript.
Funding
This work was funded by the Danone Nutricia Research.
Conflict of Interest Statement
AK, EE, AO, KvL, and EvdB are employees of the Danone Nutricia Research.
The remaining author declares that the research was conducted in the absence of any commercial or financial relationships that could be construed as a potential conflict of interest.
Acknowledgments
We thank Jan Polman for help in carrying out the data analyses of the mRNA sequence results and Joris Hoeks and Gert Schaart (Maastricht University) for sharing their UCP1 western blot protocol.
Supplementary Material
The Supplementary Material for this article can be found online at: https://www.frontiersin.org/articles/10.3389/fphys.2019.00836/full#supplementary-material
References
Altshuler-Keylin, S., Shinoda, K., Hasegawa, Y., Ikeda, K., Hong, H., Kang, Q., et al. (2016). Beige adipocyte maintenance is regulated by autophagy-induced mitochondrial clearance. Cell Metab. 24, 402–419. doi: 10.1016/j.cmet.2016.08.002
Baars, A., Oosting, A., Engels, E., Kegler, D., Kodde, A., Schipper, L., et al. (2016). Milk fat globule membrane coating of large lipid droplets in the diet of young mice prevents body fat accumulation in adulthood. Br. J. Nutr. 115, 1930–1937. doi: 10.1017/S0007114516001082
Birnbacher, L., Maurer, S., Scheidt, K., Herzen, J., Pfeiffer, F., and Fromme, T. (2018). Electron density of adipose tissues determined by phase-contrast computed tomography provides a measure for mitochondrial density and fat content. Front. Physiol. 9:707. doi: 10.3389/fphys.2018.00707
Bjorndal, B., Burri, L., Staalesen, V., Skorve, J., and Berge, R. K. (2011). Different adipose depots: their role in the development of metabolic syndrome and mitochondrial response to hypolipidemic agents. J. Obes. 2011:490650. doi: 10.1155/2011/490650
Boeuf, S., Klingenspor, M., Van Hal, N. L., Schneider, T., Keijer, J., and Klaus, S. (2001). Differential gene expression in white and brown preadipocytes. Physiol. Genomics 7, 15–25.
Bouwman, L. M. S., Fernandez-Calleja, J. M. S., Swarts, H. J. M., van der Stelt, I., Oosting, A., Keijer, J., et al. (2018). No adverse programming by post-weaning dietary fructose of body weight, adiposity, glucose tolerance, or metabolic flexibility. Mol. Nutr. Food Res. 62:1700315. doi: 10.1002/mnfr.201700315
Bruce, K. D., Cagampang, F. R., Argenton, M., Zhang, J., Ethirajan, P. L., Burdge, G. C., et al. (2009). Maternal high-fat feeding primes steatohepatitis in adult mice offspring, involving mitochondrial dysfunction and altered lipogenesis gene expression. Hepatology 50, 1796–1808. doi: 10.1002/hep.23205
Chabowska-Kita, A., Trabczynska, A., Korytko, A., Kaczmarek, M. M., and Kozak, L. P. (2015). Low ambient temperature during early postnatal development fails to cause a permanent induction of brown adipocytes. FASEB J. 29, 3238–3252. doi: 10.1096/fj.15-271395
Choo, H. J., Kim, J. H., Kwon, O. B., Lee, C. S., Mun, J. Y., Han, S. S., et al. (2006). Mitochondria are impaired in the adipocytes of type 2 diabetic mice. Diabetologia 49, 784–791. doi: 10.1007/s00125-006-0170-2
Claycombe, K. J., Vomhof-DeKrey, E. E., Garcia, R., Johnson, W. T., Uthus, E., and Roemmich, J. N. (2016). Decreased beige adipocyte number and mitochondrial respiration coincide with increased histone methyl transferase (G9a) and reduced FGF21 gene expression in Sprague-Dawley rats fed prenatal low protein and postnatal high-fat diets. J. Nutr. Biochem. 31, 113–121. doi: 10.1016/j.jnutbio.2016.01.008
Derous, D., Kelder, T., van Schothorst, E. M., van Erk, M., Voigt, A., Klaus, S., et al. (2015). Network-based integration of molecular and physiological data elucidates regulatory mechanisms underlying adaptation to high-fat diet. Genes Nutr. 10:470. doi: 10.1007/s12263-015-0470-6
Deveaud, C., Beauvoit, B., Salin, B., Schaeffer, J., and Rigoulet, M. (2004). Regional differences in oxidative capacity of rat white adipose tissue are linked to the mitochondrial content of mature adipocytes. Mol. Cell Biochem. 267, 157–166.
DiGirolamo, M., Fine, J. B., Tagra, K., and Rossmanith, R. (1998). Qualitative regional differences in adipose tissue growth and cellularity in male Wistar rats fed ad libitum. Am. J. Physiol. 274(5 Pt 2), R1460–R1467. doi: 10.1152/ajpregu.1998.274.5.R1460
Ding, W. X., and Yin, X. M. (2012). Mitophagy: mechanisms, pathophysiological roles, and analysis. Biol. Chem. 393, 547–564. doi: 10.1515/hsz-2012-0119
Fernandez-Calleja, J. M. S., Bouwman, L. M. S., Swarts, H. J. M., Oosting, A., Keijer, J., and van Schothorst, E. M. (2018). Direct and long-term metabolic consequences of lowly vs. highly-digestible starch in the early post-weaning diet of mice. Nutrients 10:E1788. doi: 10.3390/nu10111788
Flachs, P., Horakova, O., Brauner, P., Rossmeisl, M., Pecina, P., Franssen-van Hal, N., et al. (2005). Polyunsaturated fatty acids of marine origin upregulate mitochondrial biogenesis and induce beta-oxidation in white fat. Diabetologia 48, 2365–2375. doi: 10.1007/s00125-005-1944-7
Forner, F., Kumar, C., Luber, C. A., Fromme, T., Klingenspor, M., and Mann, M. (2009). Proteome differences between brown and white fat mitochondria reveal specialized metabolic functions. Cell Metab. 10, 324–335. doi: 10.1016/j.cmet.2009.08.014
Gesta, S., Tseng, Y. H., and Kahn, C. R. (2007). Developmental origin of fat: tracking obesity to its source. Cell 131, 242–256. doi: 10.1016/j.cell.2007.10.004
Gluckman, P. D., and Hanson, M. A. (2004). The developmental origins of the metabolic syndrome. Trends Endocrinol. Metab. 15, 183–187.
Hammarstedt, A., Graham, T. E., and Kahn, B. B. (2012). Adipose tissue dysregulation and reduced insulin sensitivity in non-obese individuals with enlarged abdominal adipose cells. Diabetol. Metab. Syndr. 4:42. doi: 10.1186/1758-5996-4-42
Han, J., Lee, J. E., Jin, J., Lim, J. S., Oh, N., Kim, K., et al. (2011). The spatiotemporal development of adipose tissue. Development 138, 5027–5037. doi: 10.1242/dev.067686
Hanson, M. A., and Gluckman, P. D. (2014). Early developmental conditioning of later health and disease: physiology or pathophysiology? Physiol. Rev. 94, 1027–1076. doi: 10.1152/physrev.00029.2013
Hellemans, J., Mortier, G., De Paepe, A., Speleman, F., and Vandesompele, J. (2007). qBase relative quantification framework and software for management and automated analysis of real-time quantitative PCR data. Genome Biol. 8:R19. doi: 10.1186/gb-2007-8-2-r19
Jousse, C., Muranishi, Y., Parry, L., Montaurier, C., Even, P., Launay, J. M., et al. (2014). Perinatal protein malnutrition affects mitochondrial function in adult and results in a resistance to high fat diet-induced obesity. PLoS One 9:e104896. doi: 10.1371/journal.pone.0104896
Kaaman, M., Sparks, L. M., van Harmelen, V., Smith, S. R., Sjolin, E., Dahlman, I., et al. (2007). Strong association between mitochondrial DNA copy number and lipogenesis in human white adipose tissue. Diabetologia 50, 2526–2533. doi: 10.1007/s00125-007-0818-6
Kodde, A., van der Beek, E. M., Phielix, E., Engels, E., Schipper, L., and Oosting, A. (2017). Supramolecular structure of dietary fat in early life modulates expression of markers for mitochondrial content and capacity in adipose tissue of adult mice. Nutr. Metab. 14:37. doi: 10.1186/s12986-017-0191-5
Lasar, D., Julius, A., Fromme, T., and Klingenspor, M. (2013). Browning attenuates murine white adipose tissue expansion during postnatal development. Biochim. Biophys. Acta 1831, 960–968. doi: 10.1016/j.bbalip.2013.01.016
Lecoutre, S., Deracinois, B., Laborie, C., Eberle, D., Guinez, C., Panchenko, P. E., et al. (2016). Depot- and sex-specific effects of maternal obesity in offspring’s adipose tissue. J. Endocrinol. 230, 39–53. doi: 10.1530/JOE-16-0037
Lu, X., Altshuler-Keylin, S., Wang, Q., Chen, Y., Sponton, C. H., Ikeda, K., et al. (2019). Mitophagy controls beige adipocyte maintenance through a Parkin-dependent and UCP1-independent mechanism. Sci. Signal. 11, 1–21. doi: 10.1126/scisignal.aap8526
Meex, R. C., Phielix, E., Schrauwen-Hinderling, V., Moonen-Kornips, E., Schaart, G., Schrauwen, P., et al. (2010). The use of statins potentiates the insulin-sensitizing effect of exercise training in obese males with and without Type 2 diabetes. Clin. Sci. 119, 293–301. doi: 10.1042/CS20100153
Mitra, A., Alvers, K. M., Crump, E. M., and Rowland, N. E. (2009). Effect of high-fat diet during gestation, lactation, or postweaning on physiological and behavioral indexes in borderline hypertensive rats. Am. J. Physiol. Regul. Integr. Comp. Physiol. 296, R20–R28. doi: 10.1152/ajpregu.90553.2008
Ng, M., Fleming, T., Robinson, M., Thomson, B., Graetz, N., Margono, C., et al. (2014). Global, regional, and national prevalence of overweight and obesity in children and adults during 1980-2013: a systematic analysis for the Global Burden of Disease Study 2013. Lancet 384, 766–781. doi: 10.1016/S0140-6736(14)60460-8
Nisoli, E., Tonello, C., Cardile, A., Cozzi, V., Bracale, R., Tedesco, L., et al. (2005). Calorie restriction promotes mitochondrial biogenesis by inducing the expression of eNOS. Science 310, 314–317. doi: 10.1126/science.1117728
Novak, M., Hahn, P., Penn, D., Monkus, E., and Kirby, L. (1973). Metabolism of subcutaneous adipose tissue in the immediate postnatal period of human newborns. developmental changes in some cytoplasmic enzymes. Biol. Neonate 23, 19–24.
Obregon, M. J., Jacobsson, A., Kirchgessner, T., Schotz, M. C., Cannon, B., and Nedergaard, J. (1989). Postnatal recruitment of brown adipose tissue is induced by the cold stress experienced by the pups. an analysis of mRNA levels for thermogenin and lipoprotein lipase. Biochem. J. 259, 341–346.
Palou, M., Priego, T., Sanchez, J., Torrens, J. M., Palou, A., and Pico, C. (2010). Moderate caloric restriction in lactating rats protects offspring against obesity and insulin resistance in later life. Endocrinology 151, 1030–1041. doi: 10.1210/en.2009-0934
Pouliot, M. C., Despres, J. P., Nadeau, A., Moorjani, S., Prud’Homme, D., Lupien, P. J., et al. (1992). Visceral obesity in men. Associations with glucose tolerance, plasma insulin, and lipoprotein levels. Diabetes 41, 826–834.
Prunet-Marcassus, B., Moulin, K., Carmona, M. C., Villarroya, F., Penicaud, L., and Casteilla, L. (1999). Inverse distribution of uncoupling proteins expression and oxidative capacity in mature adipocytes and stromal-vascular fractions of rat white and brown adipose tissues. FEBS Lett. 464, 184–188.
Reeves, P. G., Nielsen, F. H., and Fahey, G. C. Jr. (1993). AIN-93 purified diets for laboratory rodents: final report of the American Institute of Nutrition ad hoc writing committee on the reformulation of the AIN-76A rodent diet. J. Nutr. 123, 1939–1951.
Reilly, J. J., and Kelly, J. (2011). Long-term impact of overweight and obesity in childhood and adolescence on morbidity and premature mortality in adulthood: systematic review. Int. J. Obes. 35, 891–898. doi: 10.1038/ijo.2010.222
Ross, R., Aru, J., Freeman, J., Hudson, R., and Janssen, I. (2002). Abdominal adiposity and insulin resistance in obese men. Am. J. Physiol. Endocrinol. Metab. 282, E657–E663. doi: 10.1152/ajpendo.00469.2001
Schottl, T., Kappler, L., Braun, K., Fromme, T., and Klingenspor, M. (2015). Limited mitochondrial capacity of visceral versus subcutaneous white adipocytes in male C57BL/6N mice. Endocrinology 156, 923–933. doi: 10.1210/en.2014-1689
Shepherd, D., and Garland, P. B. (1969). The kinetic properties of citrate synthase from rat liver mitochondria. Biochem. J. 114, 597–610.
Spalding, K. L., Arner, E., Westermark, P. O., Bernard, S., Buchholz, B. A., Bergmann, O., et al. (2008). Dynamics of fat cell turnover in humans. Nature 453, 783–787. doi: 10.1038/nature06902
Sutherland, L. N., Capozzi, L. C., Turchinsky, N. J., Bell, R. C., and Wright, D. C. (2008). Time course of high-fat diet-induced reductions in adipose tissue mitochondrial proteins: potential mechanisms and the relationship to glucose intolerance. Am. J. Physiol. Endocrinol. Metab. 295, E1076–E1083. doi: 10.1152/ajpendo.90408.2008
Timmons, J. A., Wennmalm, K., Larsson, O., Walden, T. B., Lassmann, T., Petrovic, N., et al. (2007). Myogenic gene expression signature establishes that brown and white adipocytes originate from distinct cell lineages. Proc. Natl. Acad. Sci. U.S.A. 104, 4401–4406. doi: 10.1073/pnas.0610615104
Vanhoutvin, S. A., Troost, F. J., Hamer, H. M., Lindsey, P. J., Koek, G. H., Jonkers, D. M., et al. (2009). Butyrate-induced transcriptional changes in human colonic mucosa. PLoS One 4:e6759. doi: 10.1371/journal.pone.0006759
Wang, Q. A., Tao, C., Gupta, R. K., and Scherer, P. E. (2013). Tracking adipogenesis during white adipose tissue development, expansion and regeneration. Nat. Med. 19, 1338–1344. doi: 10.1038/nm.3324
Wilson-Fritch, L., Burkart, A., Bell, G., Mendelson, K., Leszyk, J., Nicoloro, S., et al. (2003). Mitochondrial biogenesis and remodeling during adipogenesis and in response to the insulin sensitizer rosiglitazone. Mol. Cell. Biol. 23, 1085–1094.
Wilson-Fritch, L., Nicoloro, S., Chouinard, M., Lazar, M. A., Chui, P. C., Leszyk, J., et al. (2004). Mitochondrial remodeling in adipose tissue associated with obesity and treatment with rosiglitazone. J. Clin. Invest. 114, 1281–1289. doi: 10.1172/JCI21752
Wu, J., Bostrom, P., Sparks, L. M., Ye, L., Choi, J. H., Giang, A. H., et al. (2012). Beige adipocytes are a distinct type of thermogenic fat cell in mouse and human. Cell 150, 366–376. doi: 10.1016/j.cell.2012.05.016
Xue, B., Rim, J. S., Hogan, J. C., Coulter, A. A., Koza, R. A., and Kozak, L. P. (2007). Genetic variability affects the development of brown adipocytes in white fat but not in interscapular brown fat. J. Lipid Res. 48, 41–51. doi: 10.1194/jlr.M600287-JLR200
Yam, K. Y., Naninck, E. F. G., Abbink, M. R., la Fleur, S. E., Schipper, L., van den Beukel, J. C., et al. (2017). Exposure to chronic early-life stress lastingly alters the adipose tissue, the leptin system and changes the vulnerability to western-style diet later in life in mice. Psychoneuroendocrinology 77, 186–195. doi: 10.1016/j.psyneuen.2016.12.012
Yang, Y. K., Chen, M., Clements, R. H., Abrams, G. A., Aprahamian, C. J., and Harmon, C. M. (2008). Human mesenteric adipose tissue plays unique role versus subcutaneous and omental fat in obesity related diabetes. Cell. Physiol. Biochem. 22, 531–538. doi: 10.1159/000185527
Keywords: white adipose tissue, mitochondria, browning, maturation, uncoupling protein, oxidative phosphorylation, obesity
Citation: Kodde A, Engels E, Oosting A, van Limpt K, van der Beek EM and Keijer J (2019) Maturation of White Adipose Tissue Function in C57BL/6j Mice From Weaning to Young Adulthood. Front. Physiol. 10:836. doi: 10.3389/fphys.2019.00836
Received: 24 January 2019; Accepted: 17 June 2019;
Published: 09 July 2019.
Edited by:
Jean-Pierre Montani, Université de Fribourg, SwitzerlandReviewed by:
Tobias Fromme, Technical University of Munich, GermanyYuko Okamatsu-Ogura, Hokkaido University, Japan
David Wright, University of Guelph, Canada
Copyright © 2019 Kodde, Engels, Oosting, van Limpt, van der Beek and Keijer. This is an open-access article distributed under the terms of the Creative Commons Attribution License (CC BY). The use, distribution or reproduction in other forums is permitted, provided the original author(s) and the copyright owner(s) are credited and that the original publication in this journal is cited, in accordance with accepted academic practice. No use, distribution or reproduction is permitted which does not comply with these terms.
*Correspondence: Andrea Kodde, Andrea.Kodde@danone.com