Following the Water: Characterising de facto Wastewater Reuse in Agriculture in the Netherlands


1
Physical Geography, Utrecht University, 3584 CB Utrecht, The Netherlands
2
KWR Water Research Institute, Groningenhaven 7, 3433 PE Nieuwegein, The Netherlands
3
Deltares, 3584 CB Utrecht, The Netherlands
4
Soil Physics and Land Management, Wageningen University, 6708 PB Wageningen, The Netherlands
*
Author to whom correspondence should be addressed.
Sustainability 2019, 11(21), 5936; https://doi.org/10.3390/su11215936
Submission received: 27 September 2019
/
Revised: 22 October 2019
/
Accepted: 23 October 2019
/
Published: 25 October 2019
(This article belongs to the Special Issue Water in the Circular Economy)
Abstract
:De facto (or indirect) wastewater reuse is the practice of extracting from surface water bodies which are impacted by treated wastewater (TWW) for anthropogenic use. The extent to which surface water bodies in the Netherlands are impacted by TWW is poorly understood, and the distribution of de facto reuse even more so. This study addresses these knowledge gaps, with a focus on reuse for agricultural irrigation. This is achieved via a novel application of the Water Framework Directive (WFD) Explorer water quality model, allowing for the distribution of different flow components—namely TWW and flow from transboundary rivers—to be discerned for the national surface water network. When paired with data on surface water extractions for irrigation, this identifies notable areas of de facto reuse. Results show that during dry conditions, TWW is a significant flow component in many surface water bodies, particularly in smaller streams located close to WWTPs. De facto reuse is indicated as widespread, with several key areas identified in which extractions are from impacted surface water bodies. This study represents a first attempt to directly link TWW emissions to agricultural irrigation, highlighting a mechanism by which wastewater-associated contaminants can propagate through the hydrological system.
1. Introduction
Wastewater, following treatment processes, is generally discharged into surface water bodies, whereupon it is transported and diluted. In areas with high population densities, this leads to a large percentage of water courses being impacted by treated wastewater (TWW) [1,2]. Indeed, a recent study by the EU Commission indicates that TWW is of a near ubiquitous presence in the surface water bodies of EU nations [3]. In many regions, TWW discharge helps to maintain environmental flow capacities in surface water bodies [4] and to recharge shallow aquifers [5]. It is, however, likely that in areas where surface water bodies are highly impacted with wastewater, water quality concerns are an issue. Contaminants found in TWW include pathogenic microorganisms (concentrations in the range of 10−1-105 [cfu l−1), nutrients (nitrates and phosphates, 100-102 [mg l−1]), heavy metals (10−1-102 [µg l−1]) and endocrine disruptors (10−2-102 [µg l−1]) [6]. The presence of these in surface water bodies may lead to problems meeting WFD chemical water quality targets, negative impacts on ecology [7] and reduced societal functions [2]. Furthermore, if surface water bodies are infiltrating, the transfer of contaminants to groundwater may occur. This is highly dependent on subsurface characteristics and hydrological conditions [8,9], but is indicated by studies which find a range of TWW-related pharmaceuticals and personal care products in groundwater samples [10].
De facto (or indirect) wastewater reuse is the practice of extracting from a surface water body which is heavily influenced by discharge from a wastewater stream (see Appendix A) for anthropogenic use [3]. In this form, TWW can constitute a freshwater resource for agriculture (irrigation), industry (cooling purposes) and public services (drinking water) [11]. The extent of its usefulness is, however, limited by its quality and the regulations associated with reuse [12]. The EU recognise water as a resource which should be managed as a key element of the circular economy [13]. Indeed, literature points to the direct reuse of TWW becoming a more common trend in the future, both internationally [14] and in the EU [13], if appropriate regulations can be devised [15] and the societal “yuck” factor can be overcome [12]. These reports, however, generally neglect to include the occurrence of de facto reuse as a component of water reuse initiatives. This is reflected in the lack of regulations relating to the practice when compared to direct reuse [16]. Given more knowledge on the topic, strategies could be better developed which would better integrate de facto reuse into freshwater management plans, complimenting existing water reuse schemes.
In the Netherlands, it is likely that wastewater is an important flow component in surface water bodies owing to high population densities and an extensive network of wastewater treatment plants (WWTPs) [17]. Moreover, the range of land and water usages located in proximity to WWTPs suggests that de facto reuse is prevalent nationally. Existing studies have shown that TWW exerts a significant impact on many surface water bodies in terms of water quality [2,18], but have failed to address the contribution of wastewater to the discharge of surface water bodies. Without this knowledge, it is impossible to draw links between wastewater discharges and societal water uses, hence neglecting the assessment of the occurrence of de facto water reuse. Characterising this problem has been (to date) confounded by difficulties in measuring and tracing the presence of TWW in a dynamic hydrological system [19]. A range of approaches seek to address this; from comparing discharge datasets for rivers and WWTPs [3] to interrogating population and hydrological datasets using GIS methods [1]. This study opts for a new approach to this problem: repurposing a national scale water quality model and labelling TWW as a tracer in and of itself. This methodology gives a more continuous representation of the impaction of surface water bodies than previous efforts. As such, the distribution of TWW within the surface water network of the Netherlands can be characterised (without the need for direct measurements) and subsequently related to agricultural extractions, hence bridging the knowledge gap between TWW emissions and societal water uses.
Via “following the water”, this study aims to determine whether TWW makes up a significant flow component for surface water bodies in the Netherlands and provide a first estimate of the extent to which de facto wastewater reuse is occurring in agricultural irrigation. This contributes to initiating discussions regarding appropriate regulations for de facto reuse and how the practice can be integrated within the circular economy to increase the responsible reuse of water sources.
2. Materials and Methods
2.1. General Approach
This research aims to trace TWW through the hydrological system of the Netherlands, with an emphasis on de facto reuse in agricultural systems; this therefore follows its release at WWTPs, transport and distribution among surface water bodies, and eventual extraction and application on agricultural fields (Figure 1). In this way, TWW propagates from a point source to a linear network to a planar distribution, becoming increasingly pervasive within the hydrological system. A national scale water quality model is used to simulate the partitioning of flow components within surface water bodies and the transport of TWW through the surface water network. Subsequently, a spatial analysis step is applied to relate the distribution of TWW in the surface water system to agricultural extractions for irrigation, hence identifying areas in which de facto reuse is occurring.
2.2. WFD-Explorer
The Water Framework Directive (WFD)-Explorer is a national scale implementation of the surface water quality model D-WAQ, created to aid decision makers in meeting Water Framework Directive-related targets [20]. The model is based on a simple version of the advection-diffusion equation to simulate reactive transport processes in open water systems. Average fluxes of WFD-identified contaminants through surface water bodies under steady-state flow conditions are simulated at timesteps of one quarter for the entire Netherlands. The model discretises the surface water network as surface water units (SWUs); these are nodes between which the model can simulate the dynamic transfer of water and substances (Appendix B). Contaminant sources are resolved as either point or diffuse inputs to the model domain, with WWTPs and transboundary rivers (TRs) resolved as point sources of discharge and contaminant fluxes.
In this implementation of the WFD-Explorer, around 27,000 nodes are incorporated, accounting for all major surface water bodies in the Netherlands. The output of steady-state simulations conducted for two specific periods is used: the first quarter of 2007 and the second quarter of 2011. These periods are chosen as they represent relatively wet and dry conditions based on their respective precipitation deficits and surpluses [21]. Three hundred and sixty-three WWTPs are included as point source inputs, and the influence of TRs on discharge and water quality are simulated as 65 point source inputs located on the German and Belgian borders.
2.2.1. Metamodel, Transfer Matrices
The WFD-Explorer is used to simulate how a constant flux of 1000 [g/s] of a nominal conservative and non-conservative (decay rate k = 0.05 [d−1]) tracer from each individual point source will eventually become distributed as fluxes through SWUs. When this procedure is repeated for each WWTP and TR considered, two transfer matrices (one for WWTPs, one for TRs) can be constructed, detailing how emissions from each individual point source will influence fluxes through every SWU, under prescribed hydrodynamic conditions. Table 1 gives a simplified representation of one such transfer matrix, but for the implementation detailed in this study, transfer matrices with dimensions [27435 SWUs x 360 WWTPs] and [27435 SWUs x 65 TRs] are used, representing a full national schematisation. The sum of fluxes through each individual SWU yields a total flux per timestep given all point source inputs. This procedure is applied to transfer matrices for both wet (first quarter of 2007) and dry (second quarter of 2011) conditions.
Previous implementations of the WFD-Explorer have shown how transfer matrices constructed using nominal tracer values can be used to model the transport of other contaminants through SWUs [2,18]. This study employs a similar procedure but takes a novel approach by labelling all discharge from point sources (WWTPs, TRs) as fully conservative tracers. This allows TWW and discharge from TRs to be traced through the surface water network, eventually yielding the distribution of TWW through every modelled SWU. To accomplish this, the distribution of tracer fluxes through SWUs are first redefined as fractions, and then scaled with recorded discharge values for WWTPs and TRs (Table 2 shows this procedure for WWTPs). In the case of emissions from Dutch WWTPs, the transfer matrix is scaled by recorded TWW discharge data from the CBS-Micro database. For TRs, two methodologies are applied: the first scales the transfer matrix with observed discharge values for TRs over the period considered, hence returning proportion impaction for each SWU by TR discharge; the second uses equivalent derived TWW discharge values extrapolated from Carbamazepine (CBZ) concentrations (see Section 2.3). Following scaling, the sum of discharges from each SWU originating from each TWW can be calculated. This yields an approximation of the average discharge over the given time period for each SWU originating as either TWW or TR discharge.
From this methodology, two model schematisations can be derived, with the difference between the two lying in the treatment of TR inputs described above. The first, henceforth referred to as the three-component model, uses the transfer matrix generated for WWTPs and TRs to work out the proportion impaction (I) of SWUs by TWW and discharge from TRs. Using these two calculated values, a third parameter can also be derived which is representative of internal non-anthropogenic flow (runoff), i.e., representing the combined contributions of direct precipitation to surface water bodies, surface runoff, shallow subsurface runoff and deep groundwater seepage. This may be summarised as follows, with subscripts WW,nl, TR and RU representing discharges from Dutch WWTPs, transboundary rivers and runoff respectively:
Three-component model:
The second model schematization, henceforth referred to as the combined model, treats TRs as point sources of TWW, thereby attempting to represent the inputs of extranational WWTPs on SWUs within the Netherlands. The combined discharges from TWW therefore give a total impaction value for each SWU; this is a useful metric, as it relates total wastewater impaction to de facto reuse via agricultural extractions for irrigation. This scheme is summarised as such, with subscripts WW,tr and WW,TOTAL denoting the extranational and total TWW discharges respectively:
Combined model:
2.2.2. Travel Time
Using the transfer matrix described in Table 1 for a nominal conservative and non-conservative tracer, it is also possible to calculate the travel times between each point source and respective receiving SWU. The following equation, first implemented and further described by Coppens et al. [2], may be used to derive travel time T between point source i and receiving SWU j, with F values representing fluxes of a conservative (c) and non-conservative (nc) tracer and K representing (linear) decay rate of the non-conservative tracer:
This equation is applied to give a respective travel time between each point source and SWU, hence generating a distribution for each individual SWU. This distribution can subsequently be used to generate an average travel time per SWU; this is a useful metric, as it is indicative of the amount of time TWW associated compounds have had to undergo degradation during reactive transport. A caveat here is the inability to predict total travel times for TWW which originates outside of the Netherlands due to the spatial constraints of the model; results can therefore only include average travel times between point sources of effluent as treated in the model framework (Dutch WWTPs, TRs at the point at which they enter the Netherlands).
2.3. Deriving Wastewater Impaction Using Carbamazepine Concentrations
To inform model inputs and evaluate results, observations of wastewater impaction values for surface water bodies are required. Directly measuring this metric is, however, impossible, and therefore it must be extrapolated from measurable concentrations of TWW-related contaminants. CBZ is chosen as a widely used tracer of TWW contamination [22]. Its utility stems from the fact that it is highly conservative, originates primarily from domestic wastewater and has no natural background concentration in surface water systems [23]. Observed CBZ concentrations and surface water discharges are used to extrapolate TWW discharge equivalent values using the following linear dilution model:
where QTOTAL,obs, CCBZ,obs and CCBZ,effluent represent observed discharge values, the observed concentration of CBZ and concentration in pure TWW effluent respectively. CCBZ,effluent is set at a constant value of 0.62 [µg l−1]; this was chosen after reviewing a range of literature and determining that this value represents a middle estimate from all studies, alongside considering the highest number of samples from Dutch WWTPs [24].
This methodology is used to quantify the average TWW discharge originating from extranational WWTPs and transported into the Netherlands by TRs. This study uses data on discharges and contaminant concentrations from monitoring programmes located close to the modelled node for each major TR considered to construct derived TWW discharge equivalent values for each transboundary input. Measurements come from the RIWA and Hydronet databases in the Netherlands and the NLWKN and ELWAS databases in Germany. Measurement points are chosen as close as possible to the Dutch border. Carbamazepine (CBZ) concentration measurements for all significant TRs are considered, with “significant” rivers hereby defined as having a discharge greater than 1 [m3s−1] during the wet period (first quarter of 2007). This procedure generates the results detailed in Appendix C, which are used as model inputs for the combined model described in Section 2.2.1.
The second use of the model detailed in Equation 4 is to provide a quasi-validation of model results. Assessing the error generated in this framework is difficult due the inability to directly measure the presence of TWW. Nonetheless, to evaluate the calculations and partially assess uncertainty, a dataset of 21 CBZ concentration measurements provided by Hydronet [25] and 10 measurements by RIWA, spanning the “dry” model simulation period (2011 Q2) are utilised. These values are converted to representative impaction values (IWW) and directly compared with the modelled value at the node closest to the measurement point, located using a “Nearest Neighbour” function implemented from the Python spatial analysis library Shapely.
2.4. Spatial Analysis
To gain an insight into how surface water impaction by TWW is likely to become spatially distributed during the process of irrigation, a spatial analysis step is applied. This aims to attribute irrigation extractions to their respective sources and the agricultural area they service respectively. Thus, the distribution of TWW in the surface water network is related to a planar agricultural surface, thereby showing how it can be propagated through the hydrological system. This process also allows for the identification of areas of high de facto reuse.
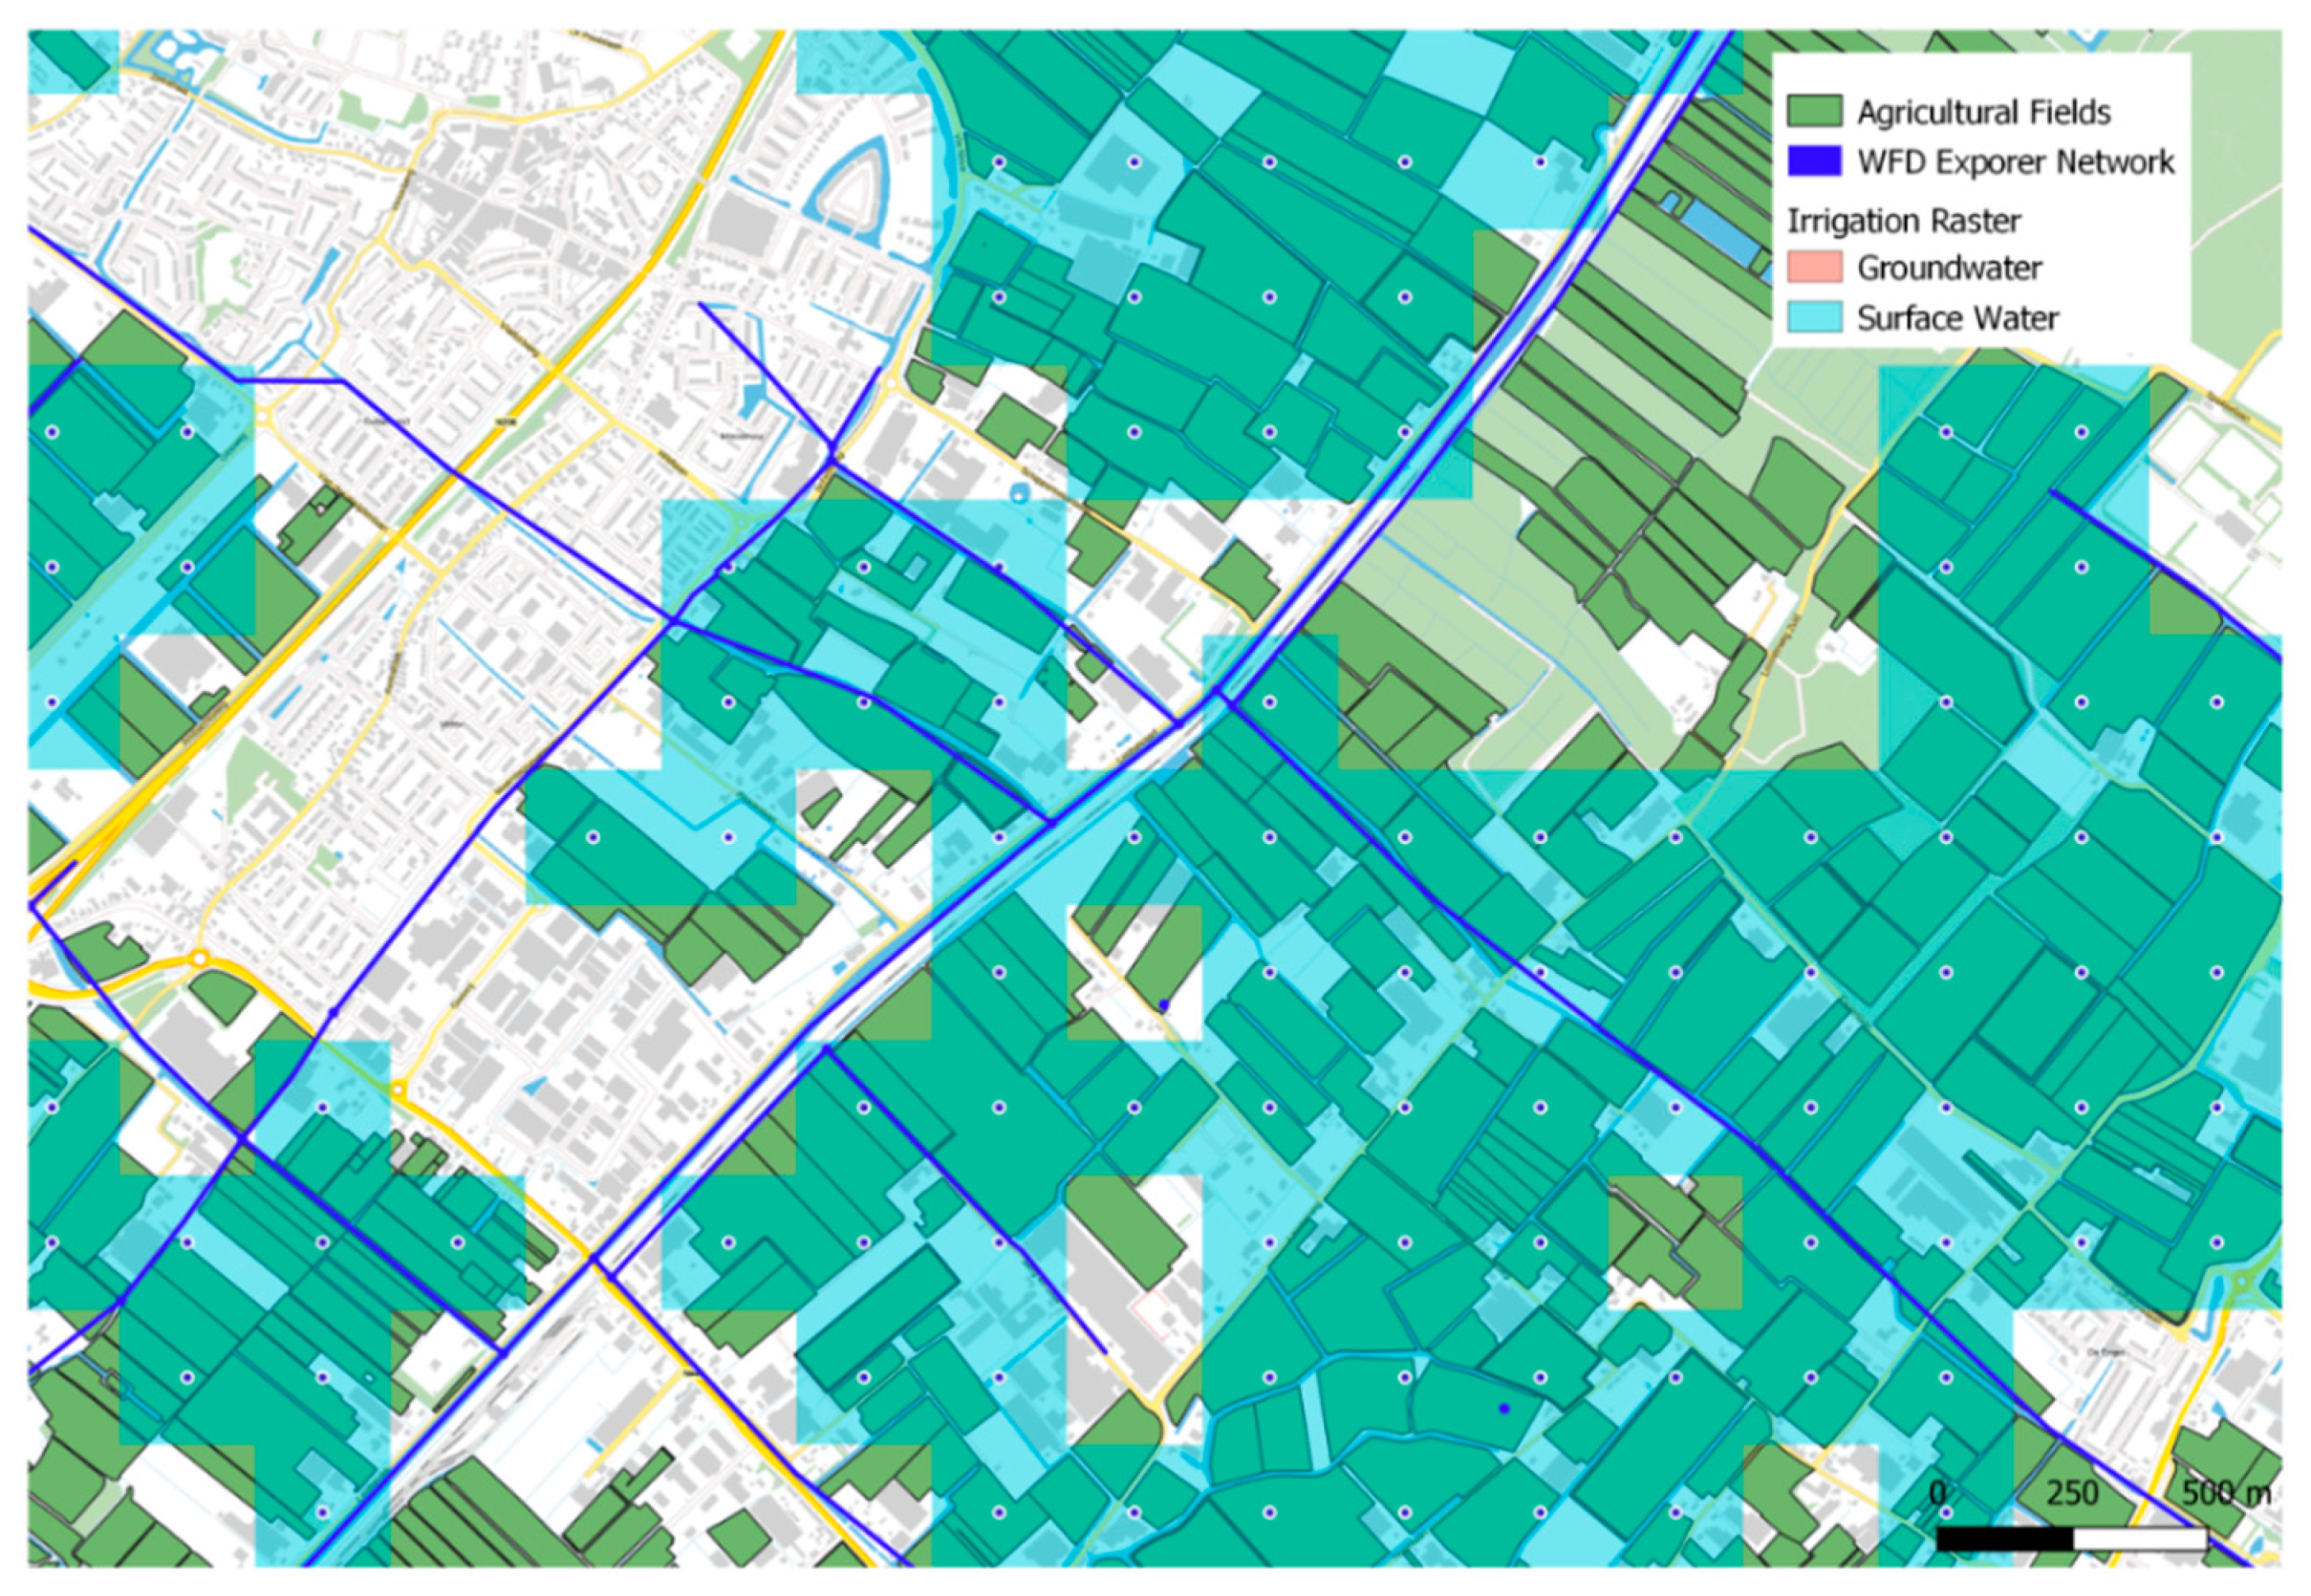
This is achieved by using openly available datasets detailing the locations of irrigated areas serviced by surface water from the Netherlands Hydrological Instrument [26] and registered agricultural crop plot extents [27]; these are raster and polygon datasets respectively (Appendix D). First, surface water irrigation locations are attached to model outputs of TWW impaction using a nearest neighbour join function implemented from the Python library Shapely; this assigns the impaction value generated for the closest (minimum distance between any point along the surface water network and the centre of the pixel) SWU polygon to each pixel of the irrigation raster. Next, the value for wastewater impaction attached to each pixel is assigned to underlying crop field extent polygons using an intersection function implemented from the Python library Geopandas.
3. Results
3.1. National Scale Analyses
3.1.1. Three-Component Model
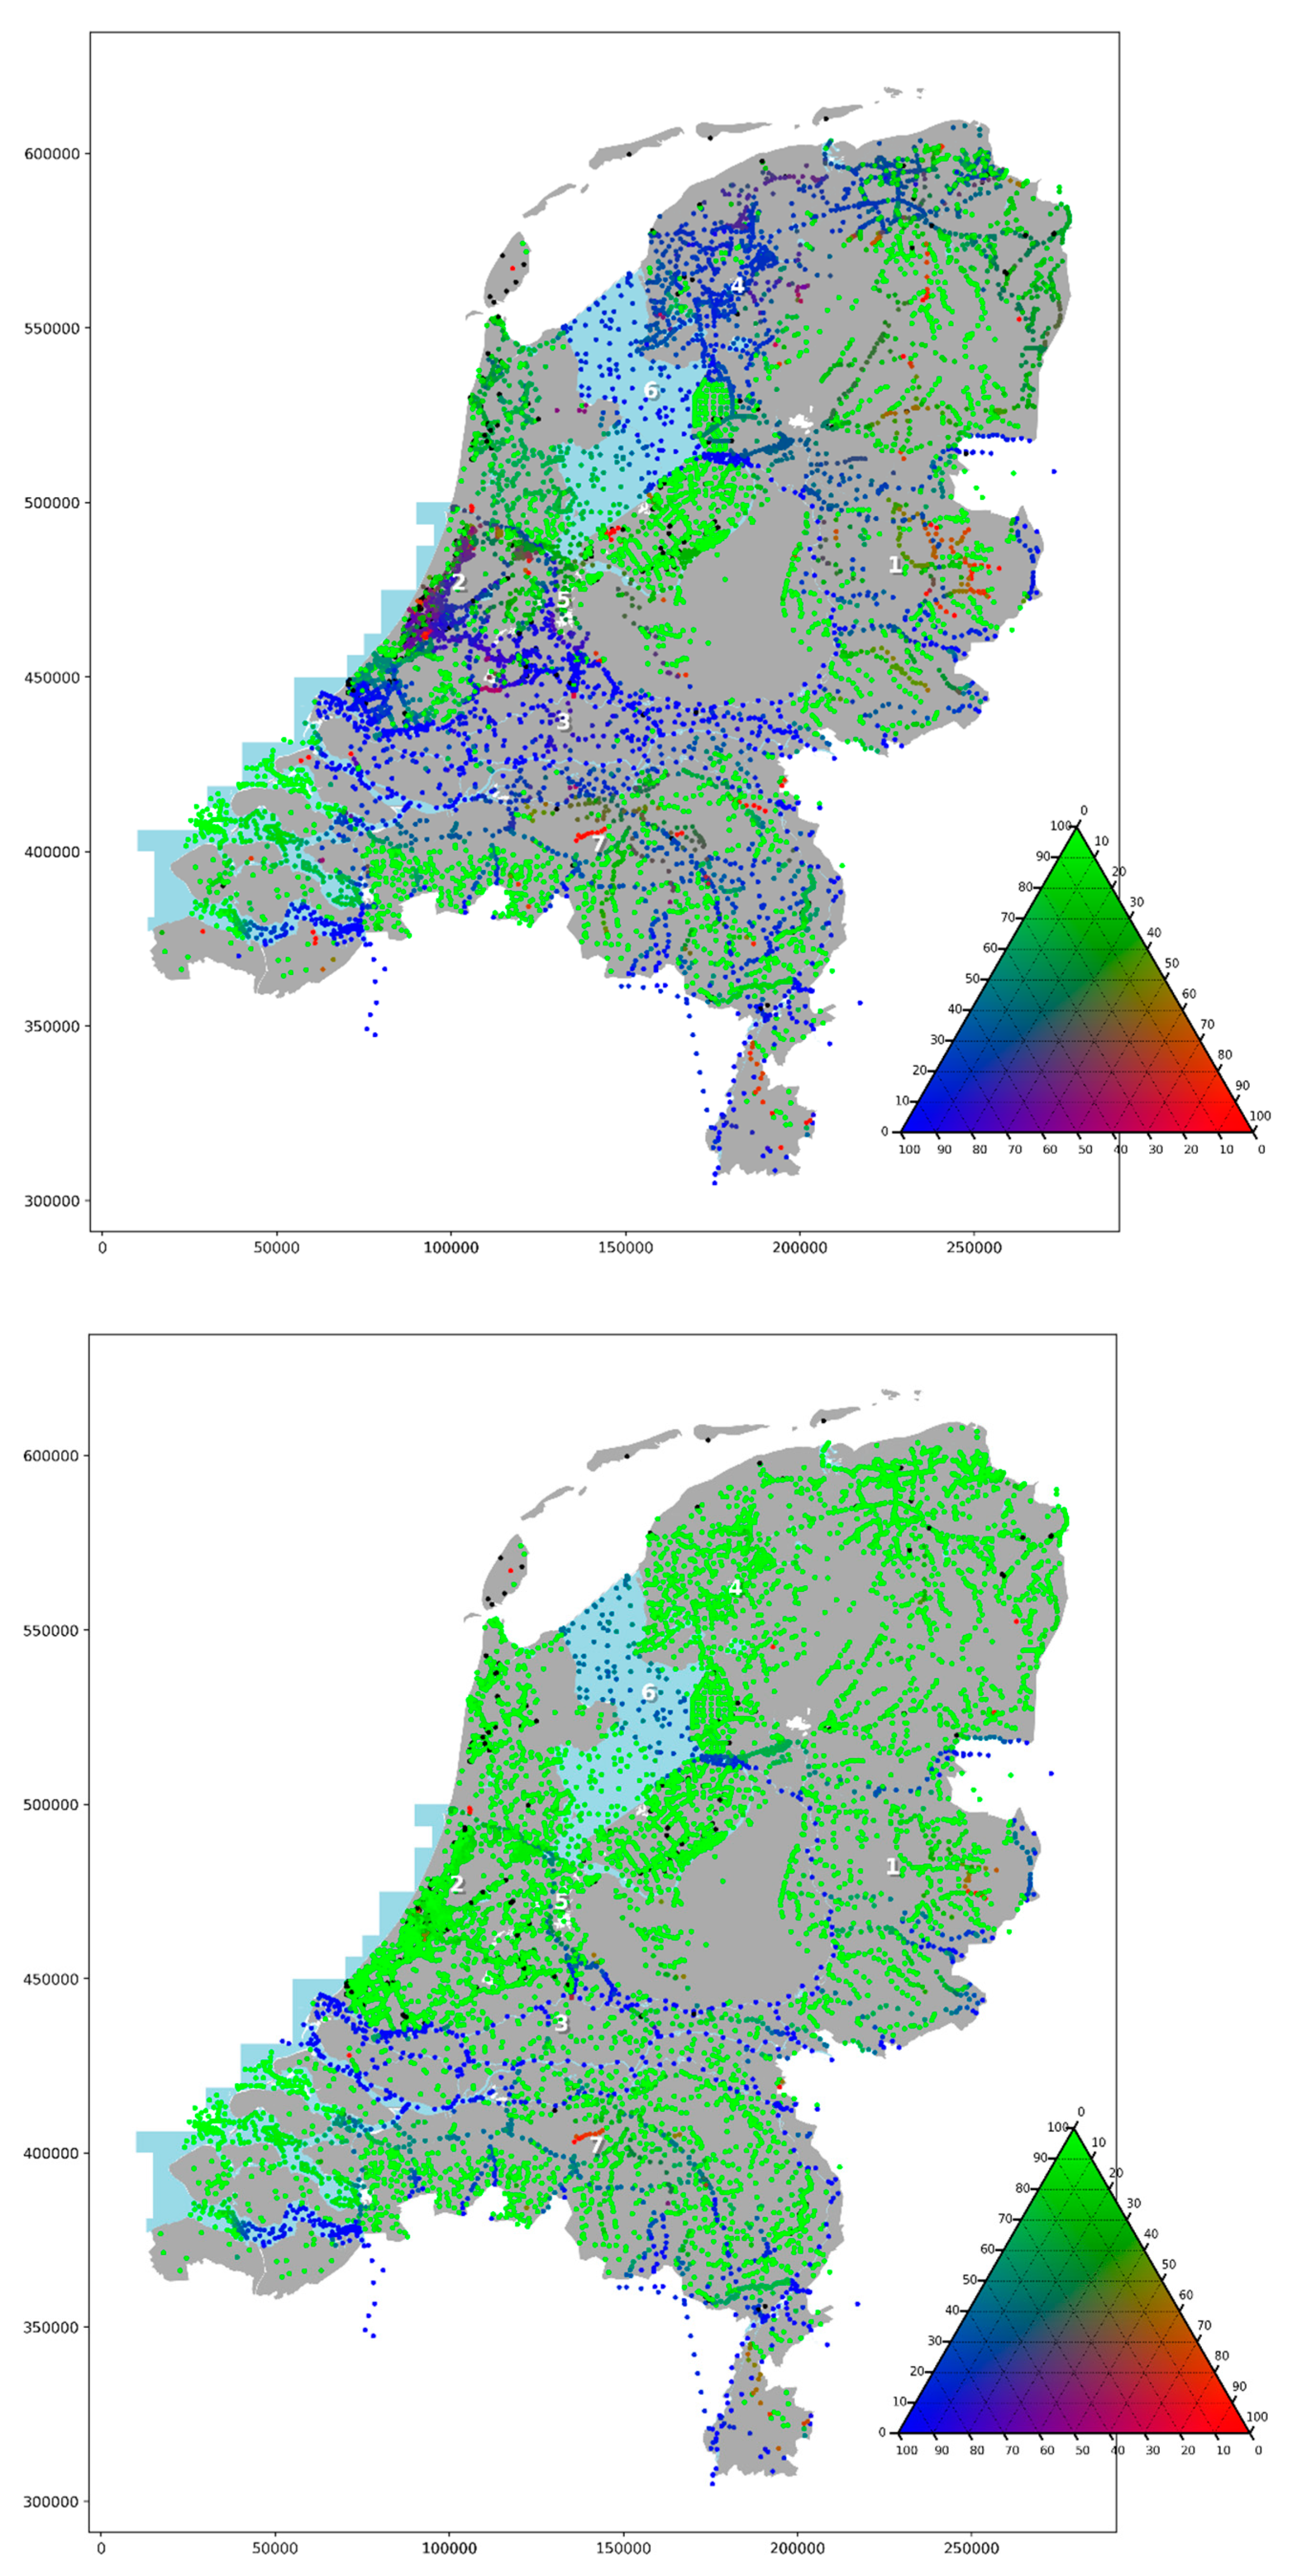
The three-component model schematisation clearly succeeds in representing the transport and dilution of different water sources; the flow of water from international sources through large river systems is visible in both periods and TWW discharge in small streams is diluted downstream of WWTPs by runoff (Figure 2).
Differentiation between wet and dry conditions is marked. In dry conditions, SWUs are impacted to a greater extent by Dutch WWTPs, especially in smaller surface water bodies in central eastern (Overijssel, #1) and western (Zuid Holland, #2) regions where impaction often approaches 100%. International rivers are clearly a vital component of surface water flow in dry periods, especially around the Meuse-Rhine corridor (#3) where most flow comes from transboundary sources. Perhaps surprisingly, the model also indicates that in dry periods, a large proportion of flow in northern (Friesland, #4) and central (Utrecht, #5) SWUs originates from transboundary sources. This spreading likely results from the model simulating the opening of water inlets during low flow periods, a decision often enacted to allow entry of water from large water courses into the low-lying polder systems during drought conditions [28]. In this case water from Lake IJssel (#6), which is replenished by river water, is let into the polders of Friesland, while water in Utrecht comes from the large rivers and from canals connected to these rivers. This reflects the extensive water management capabilities present in the Netherlands.
In wet conditions, discharge through the majority of SWUs stems from runoff, with discharge from international rivers being less pervasive in the surface water network, albeit still dominant along the central Meuse-Rhine corridor. This reflects the greater influence of precipitation during this period and the reversal of flow networks to encourage draining of surface water bodies to the sea, also resolved in the model framework. The impact of TWW from Dutch WWTPs in wet conditions is visible in some areas, notably for the Zandleij in the Brabant area (#7), but is in general negligible for the majority of SWUs.
3.1.2. Combined Model
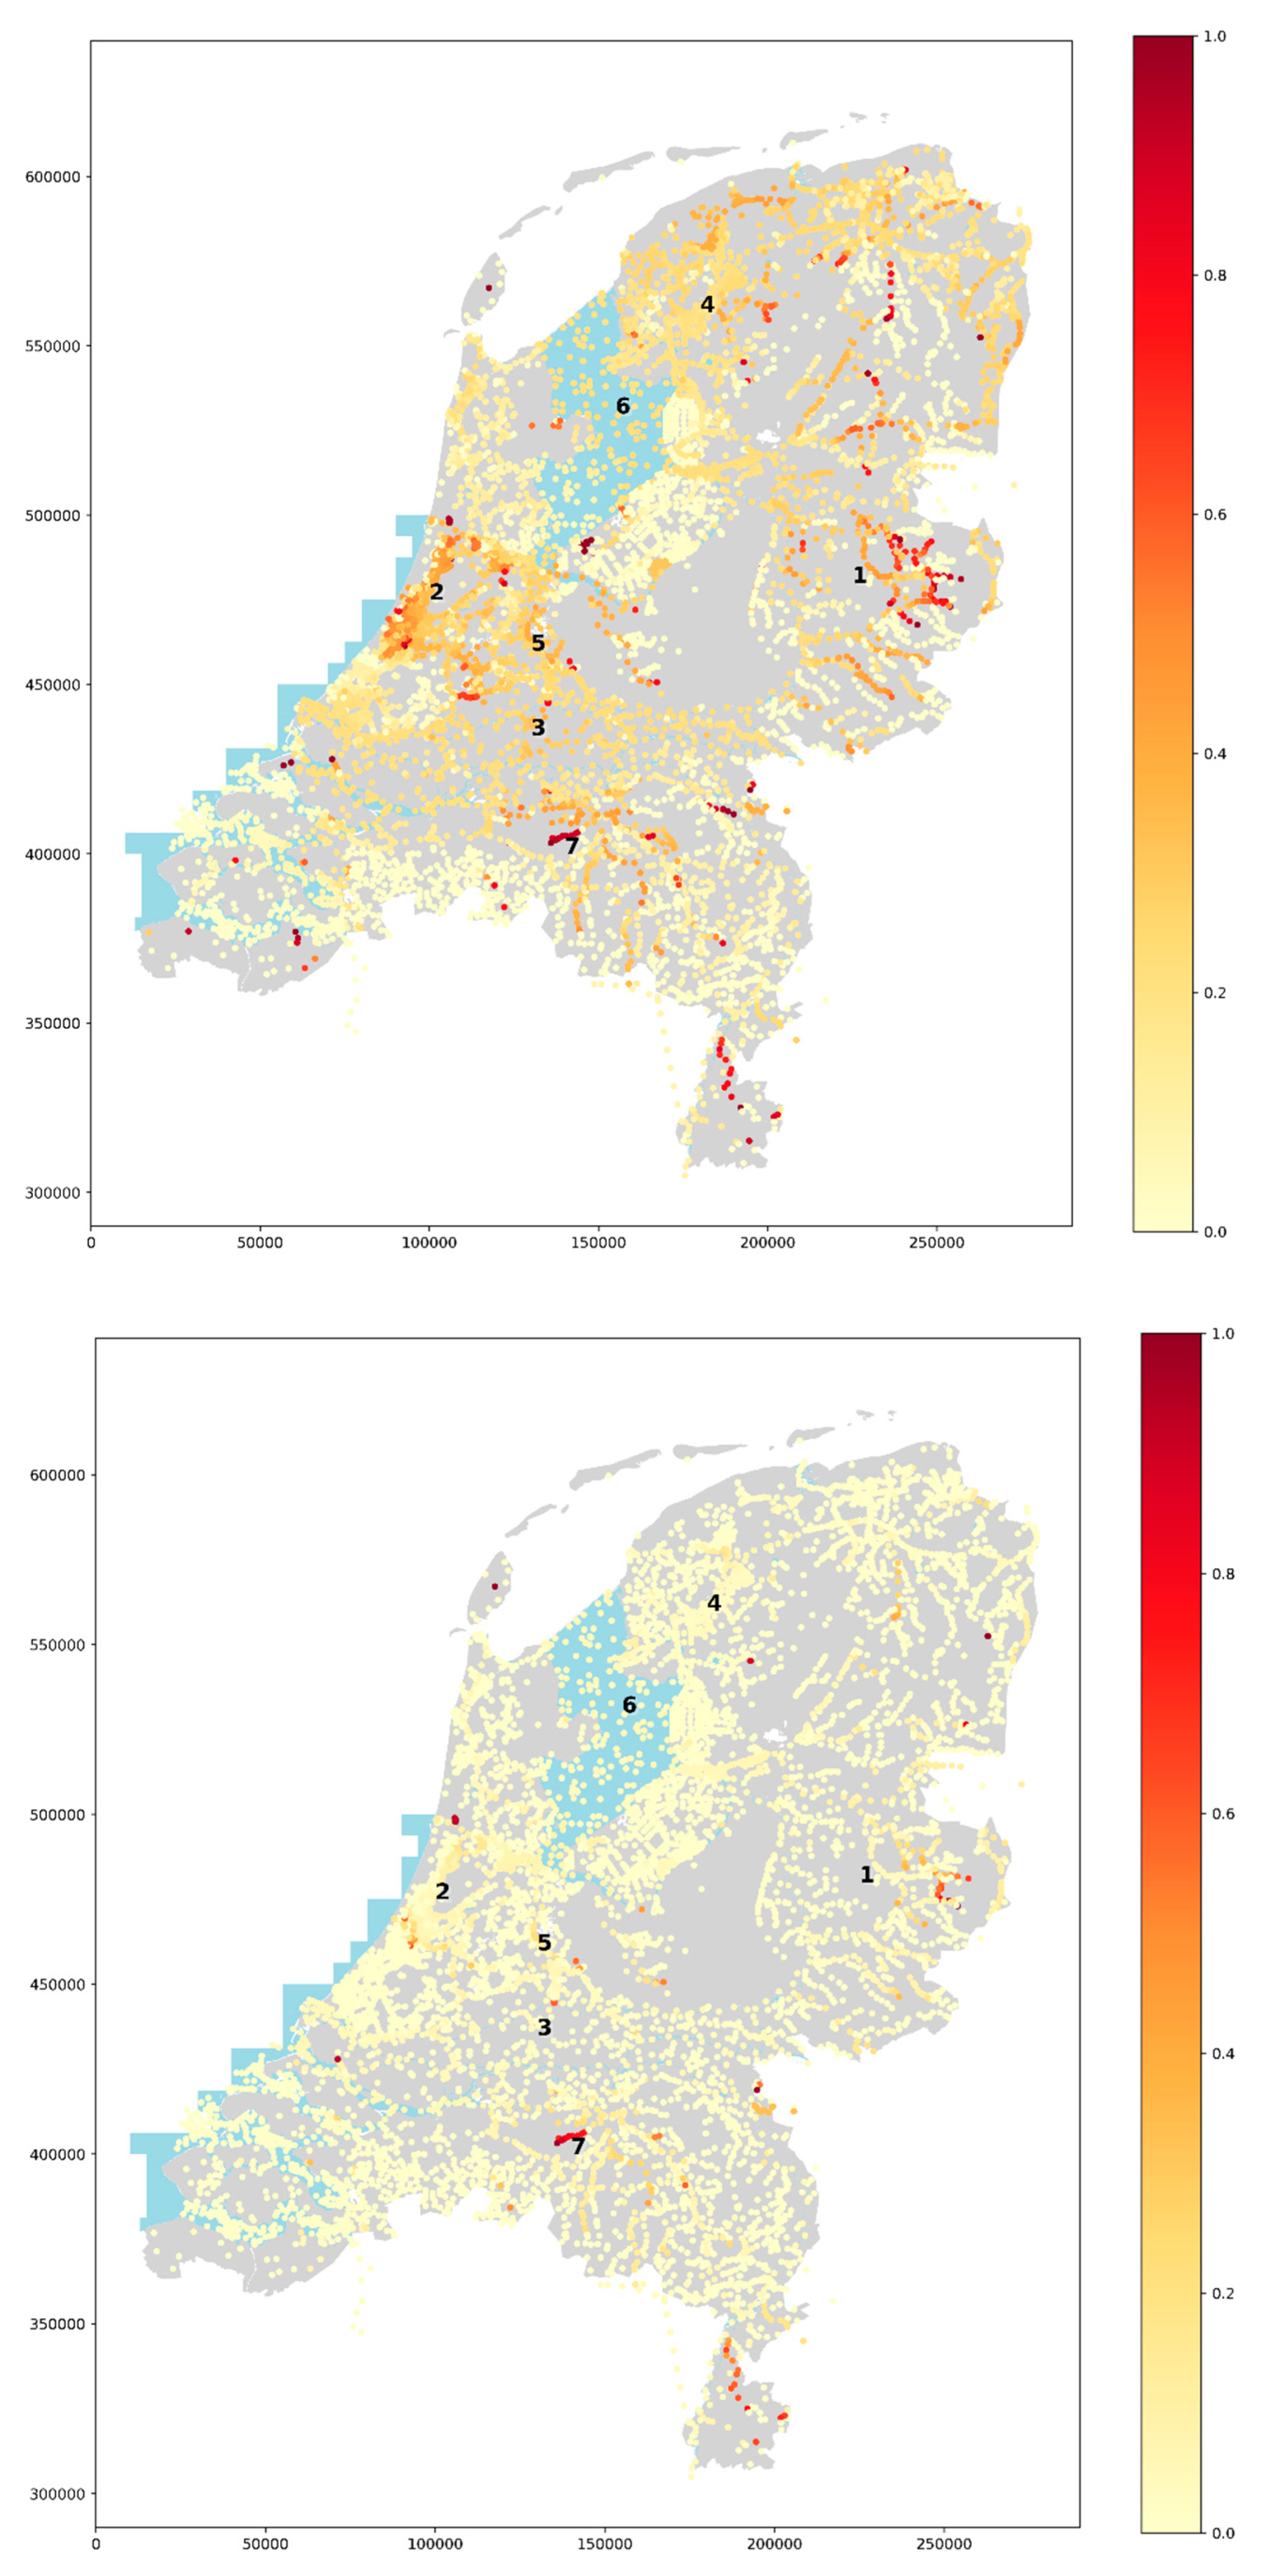
When international rivers are included as point sources of TWW effluent, a general representation of TWW impaction is obtained (Figure 3). These results show a compelling difference in terms of TWW impaction in wet and dry periods, with TWW making up a much higher percentage of flow in the majority of SWUs during the dry period. As expected, the model again clearly produces dilution effects along the course of surface water bodies (especially visible in streams in eastern areas).
During dry conditions, TWW is shown to be a pervasive component of surface water flow. Central eastern (Overijssel, #1) and western (Zuid Holland, #2) areas are highly impacted, with discharge through many SWUs being composed of 80–100% TWW. Results also clearly show the influence of TWW originating from transboundary sources, with inputs from the Rhine and Meuse contributing to the impaction of many surface water bodies in the central Netherlands (#3). Indeed, around 20% of the flow component of large surface water bodies in the Rhine-Meuse corridor is shown to be made up of TWW in dry conditions. This effect is also evident in the central southern area (Noord-Brabant, #8), which is influenced by TWW transported by the Dommel. TWW transported by the Rhine and IJssel also has a clear influence on impaction in Friesland (#4) and Utrecht (#5) areas.
In wet conditions, conversely, results suggest that TWW is largely unimportant in maintaining flow for the majority of SWUs. Indeed, the only areas in which TWW makes up a significant flow component is in a few smaller watercourses in the Zuid Holland (#2) and Limburg (#9) areas, as well as in the Zandleij (#7). Some wastewater impaction is also still indicated for the Dommel (#8).
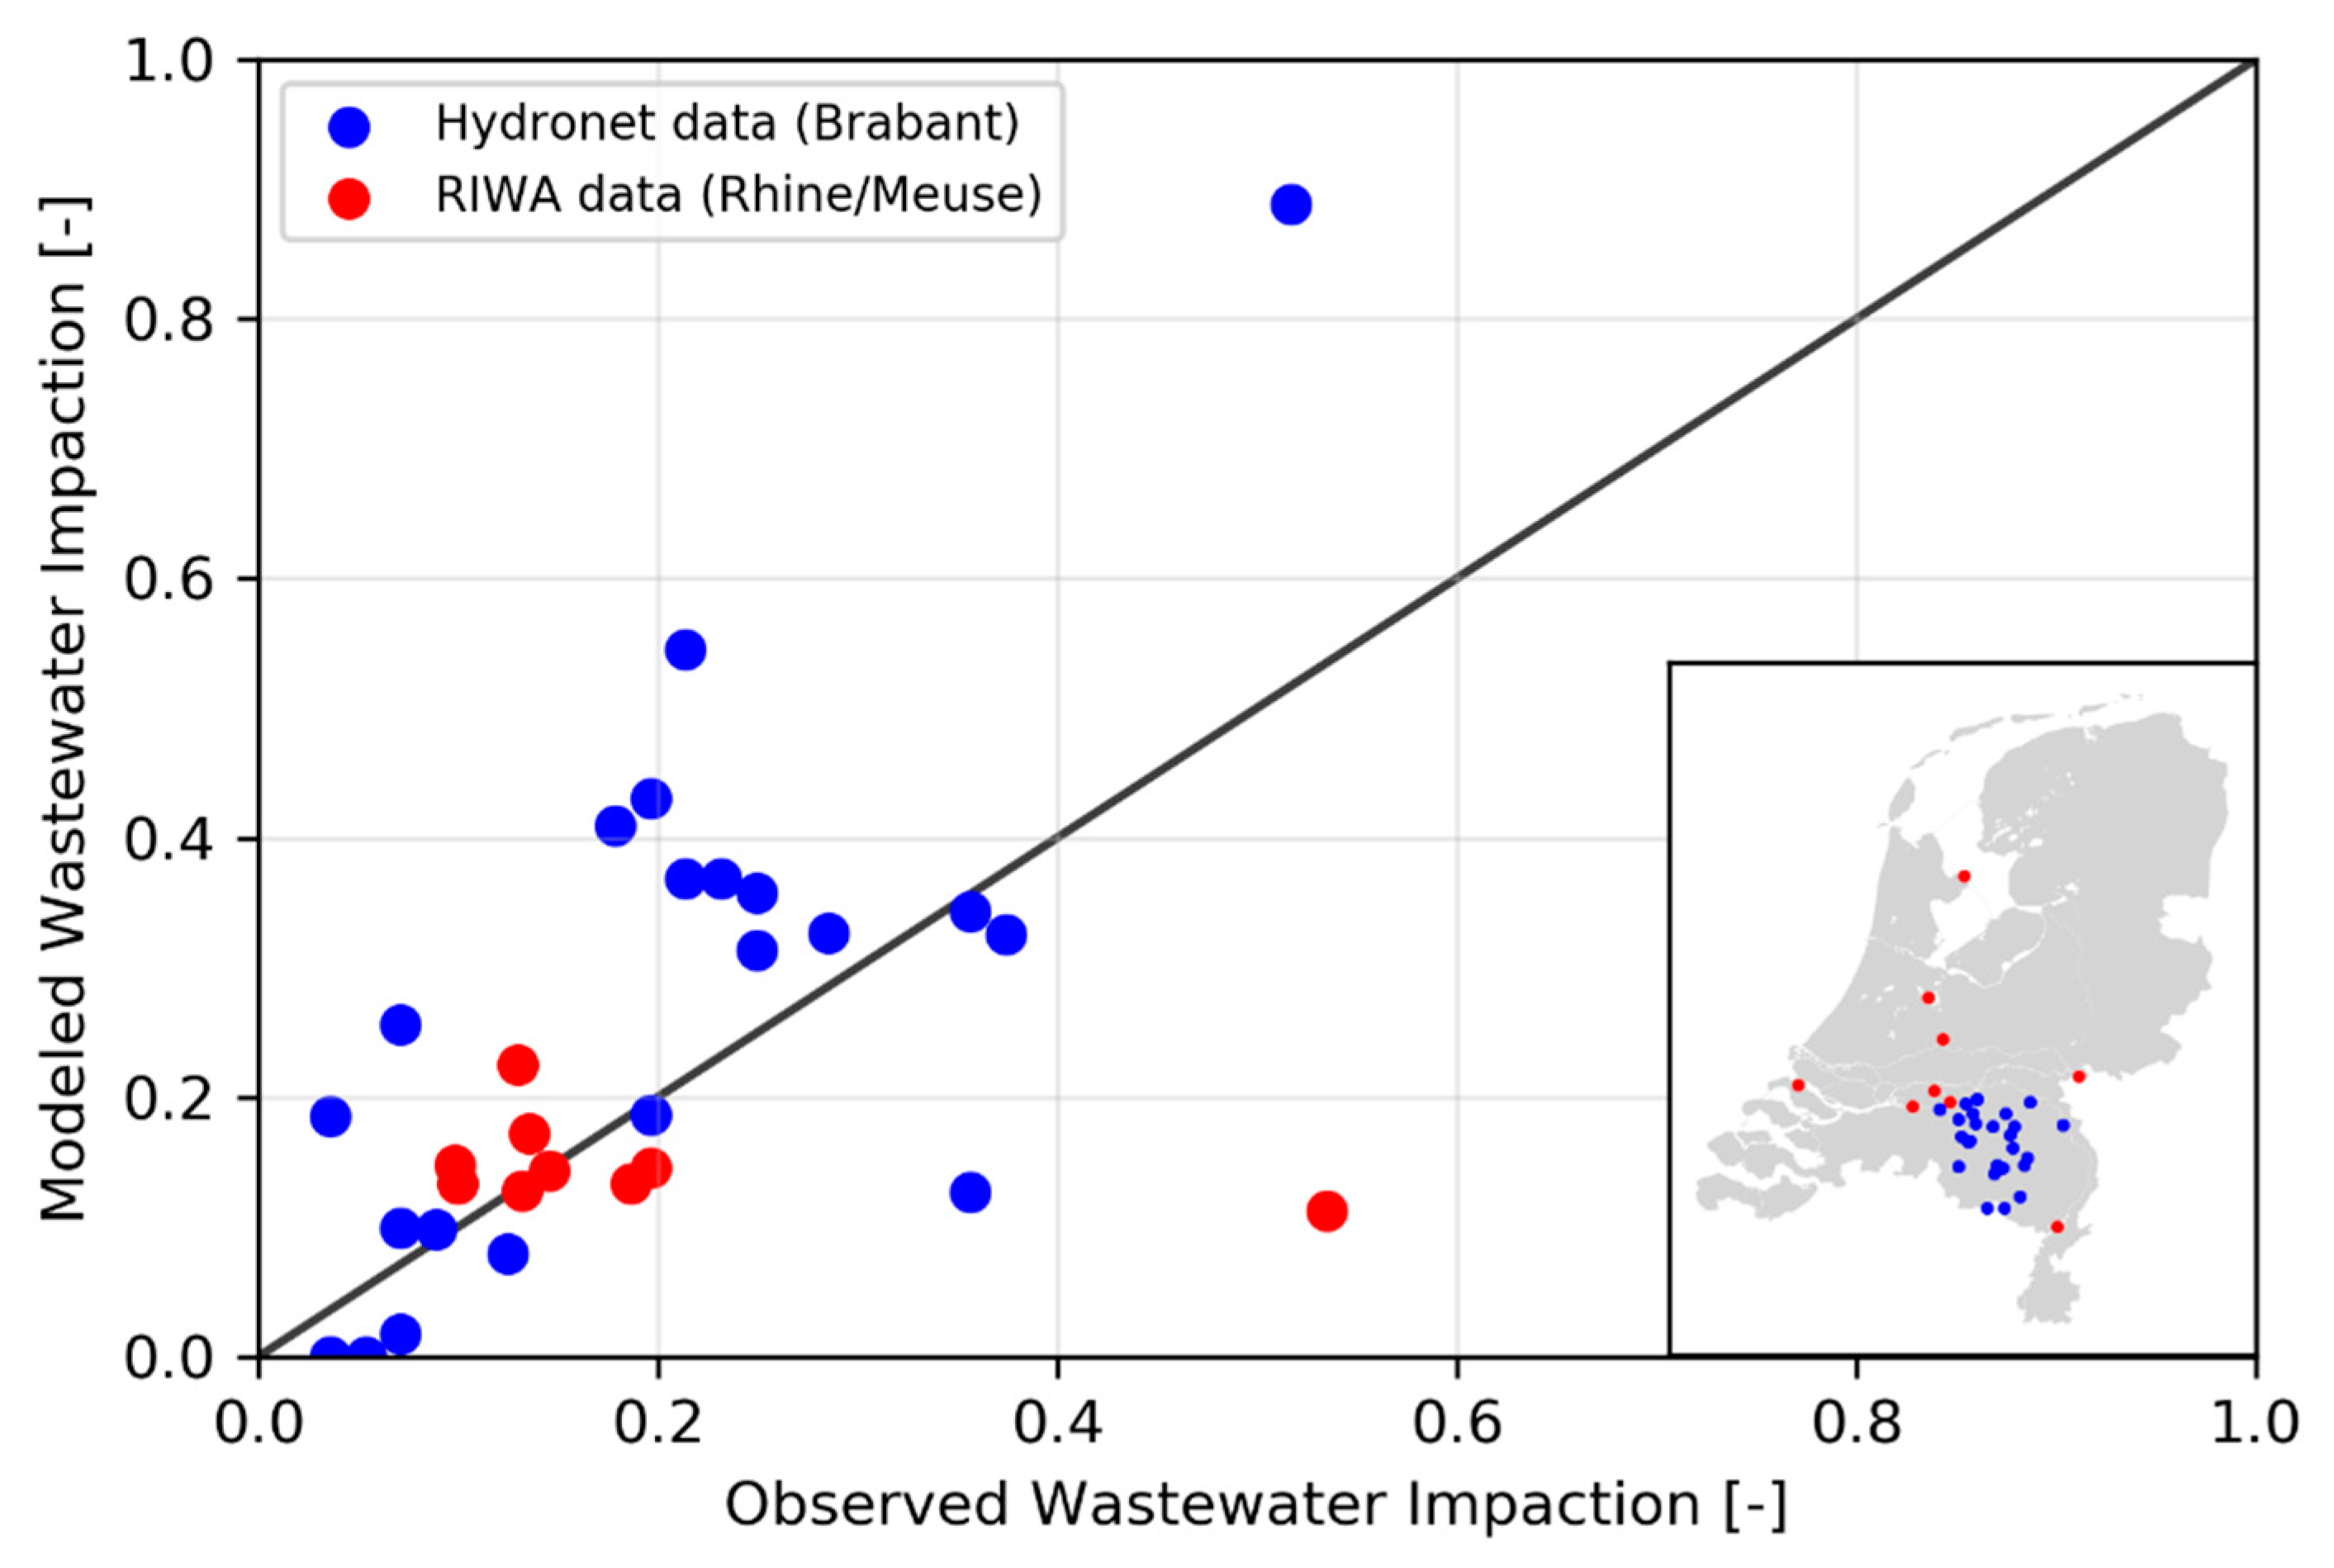
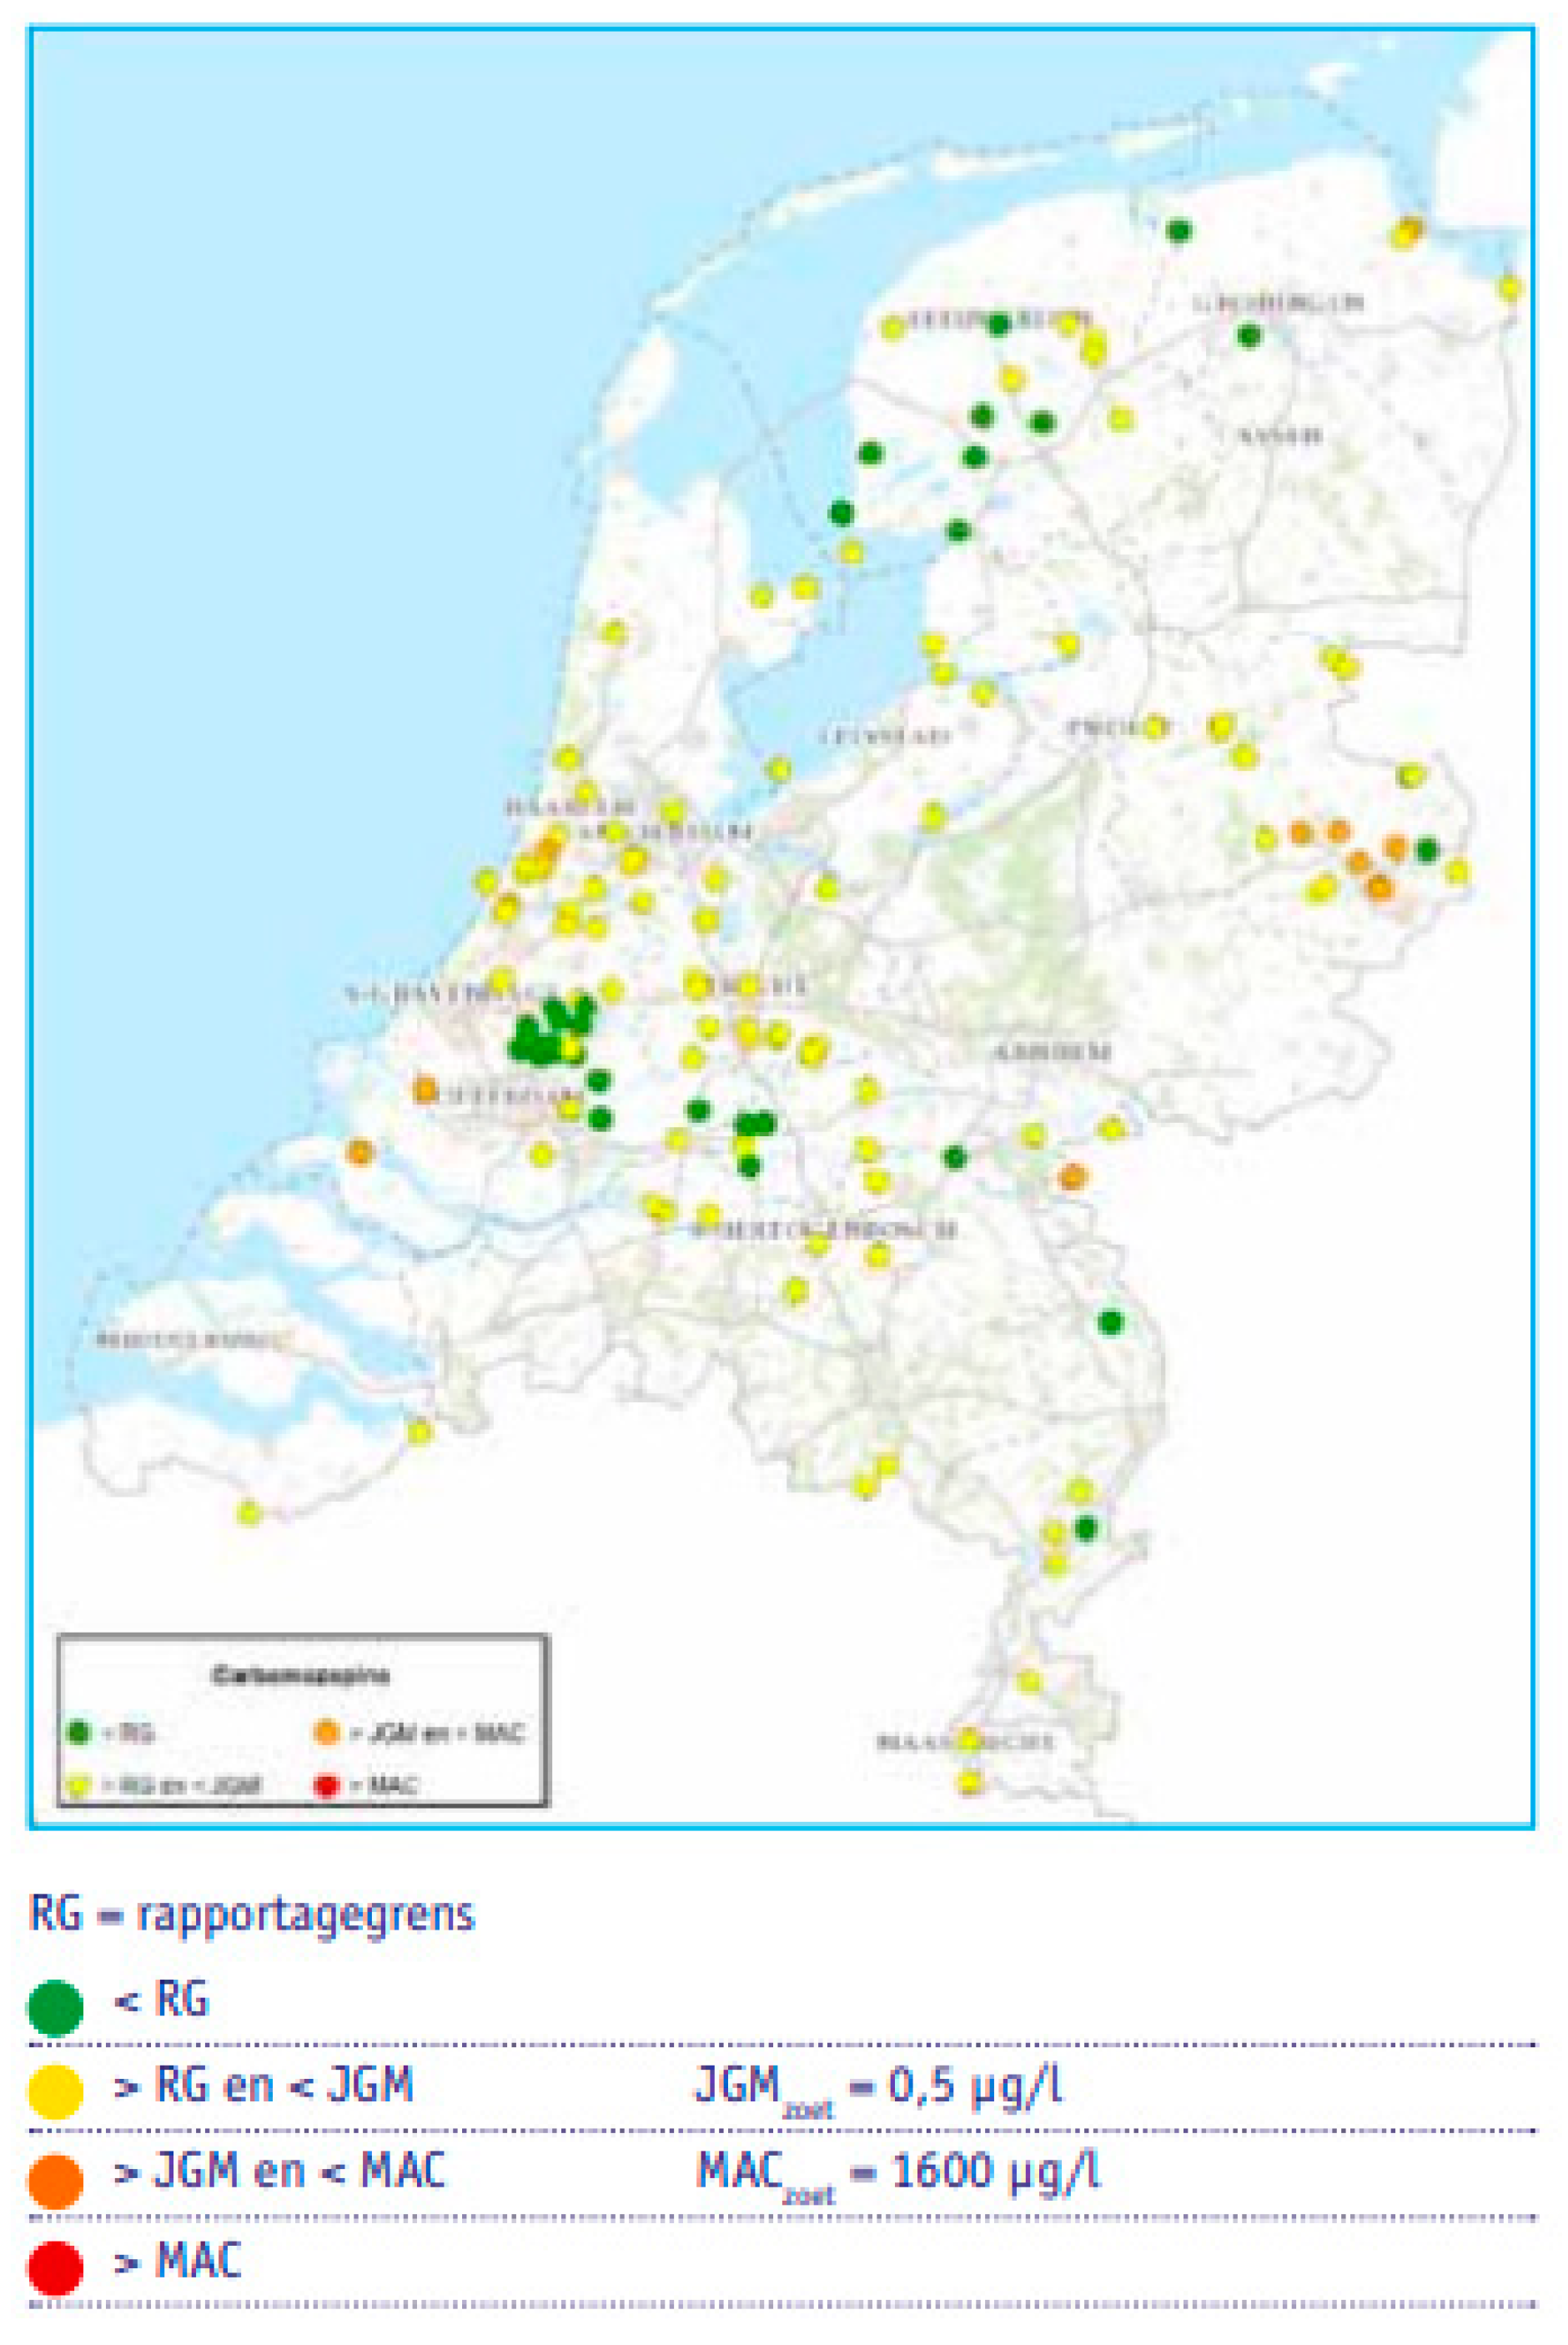
Model evaluation indicates that predictive accuracy varies, especially when considering higher predicted wastewater impactions (>40%), with two data points in particular showing large relative under- and over-predictions (Figure 4). This may be a result of increasing uncertainty in the model framework which occurs due to degradation processes being much more dynamic in real systems at relatively higher concentrations. A general trend toward overprediction is also shown in relation to the Hydronet data, which consists mostly of measurements taken in smaller streams. Overall, however, a fair level of agreement is shown, indicating that the model is useful for predicting the occurrence of TWW in surface water bodies. Moreover, when compared with the distribution of maximum CBZ concentrations in surface water bodies explored in a report by STOWA (2015), model outputs show good agreement (Appendix E). This finds elevated CBZ concentrations (above 0.5 [µg l−1]) in the same areas this study identifies as being highly impacted by TWW, notably in 5 samples taken from small streams in the east (Overijssel) and 3 samples taken from polder systems in the west (Zuid Holland area).
3.1.3. Travel Times
Average travel times between sources of effluent and receiving SWUs range from 0–200 days in both wet and dry conditions (Figure 5). In general, travel times are higher at the northern and western boundaries of the country, and lowest along the Rhine-Meuse corridor (#3) and central eastern areas. A clear distinction is again evident between wet and dry conditions, with travel times being higher in all areas during dry conditions. This is the result of the same water management strategy described earlier, whereby water is retained terrestrially during dry periods and flushed to the sea during wet periods to alleviate flood risk.
Results in terms of TWW impaction become more informative when combined with estimates of travel time as this provides for some insight into the decay processes which occur during transport. Highly conservative contaminants such as chloride, some pharmaceuticals and artificial sweeteners are unlikely to decay on time scales of 0–200 days [29], but for pathogens, travel times in the range of 20–100 days can lead to >90% reductions in concentrations under open flow systems [30]. In general, it should be noted that for dry conditions in the areas of significant impaction outlined above (Zuid Holland, #2; Overijssel, #1), travel times are still relatively low (<50 days) and thus the model suggests that contaminants related to TWW are unlikely to have decayed by the time they reach these SWUs.
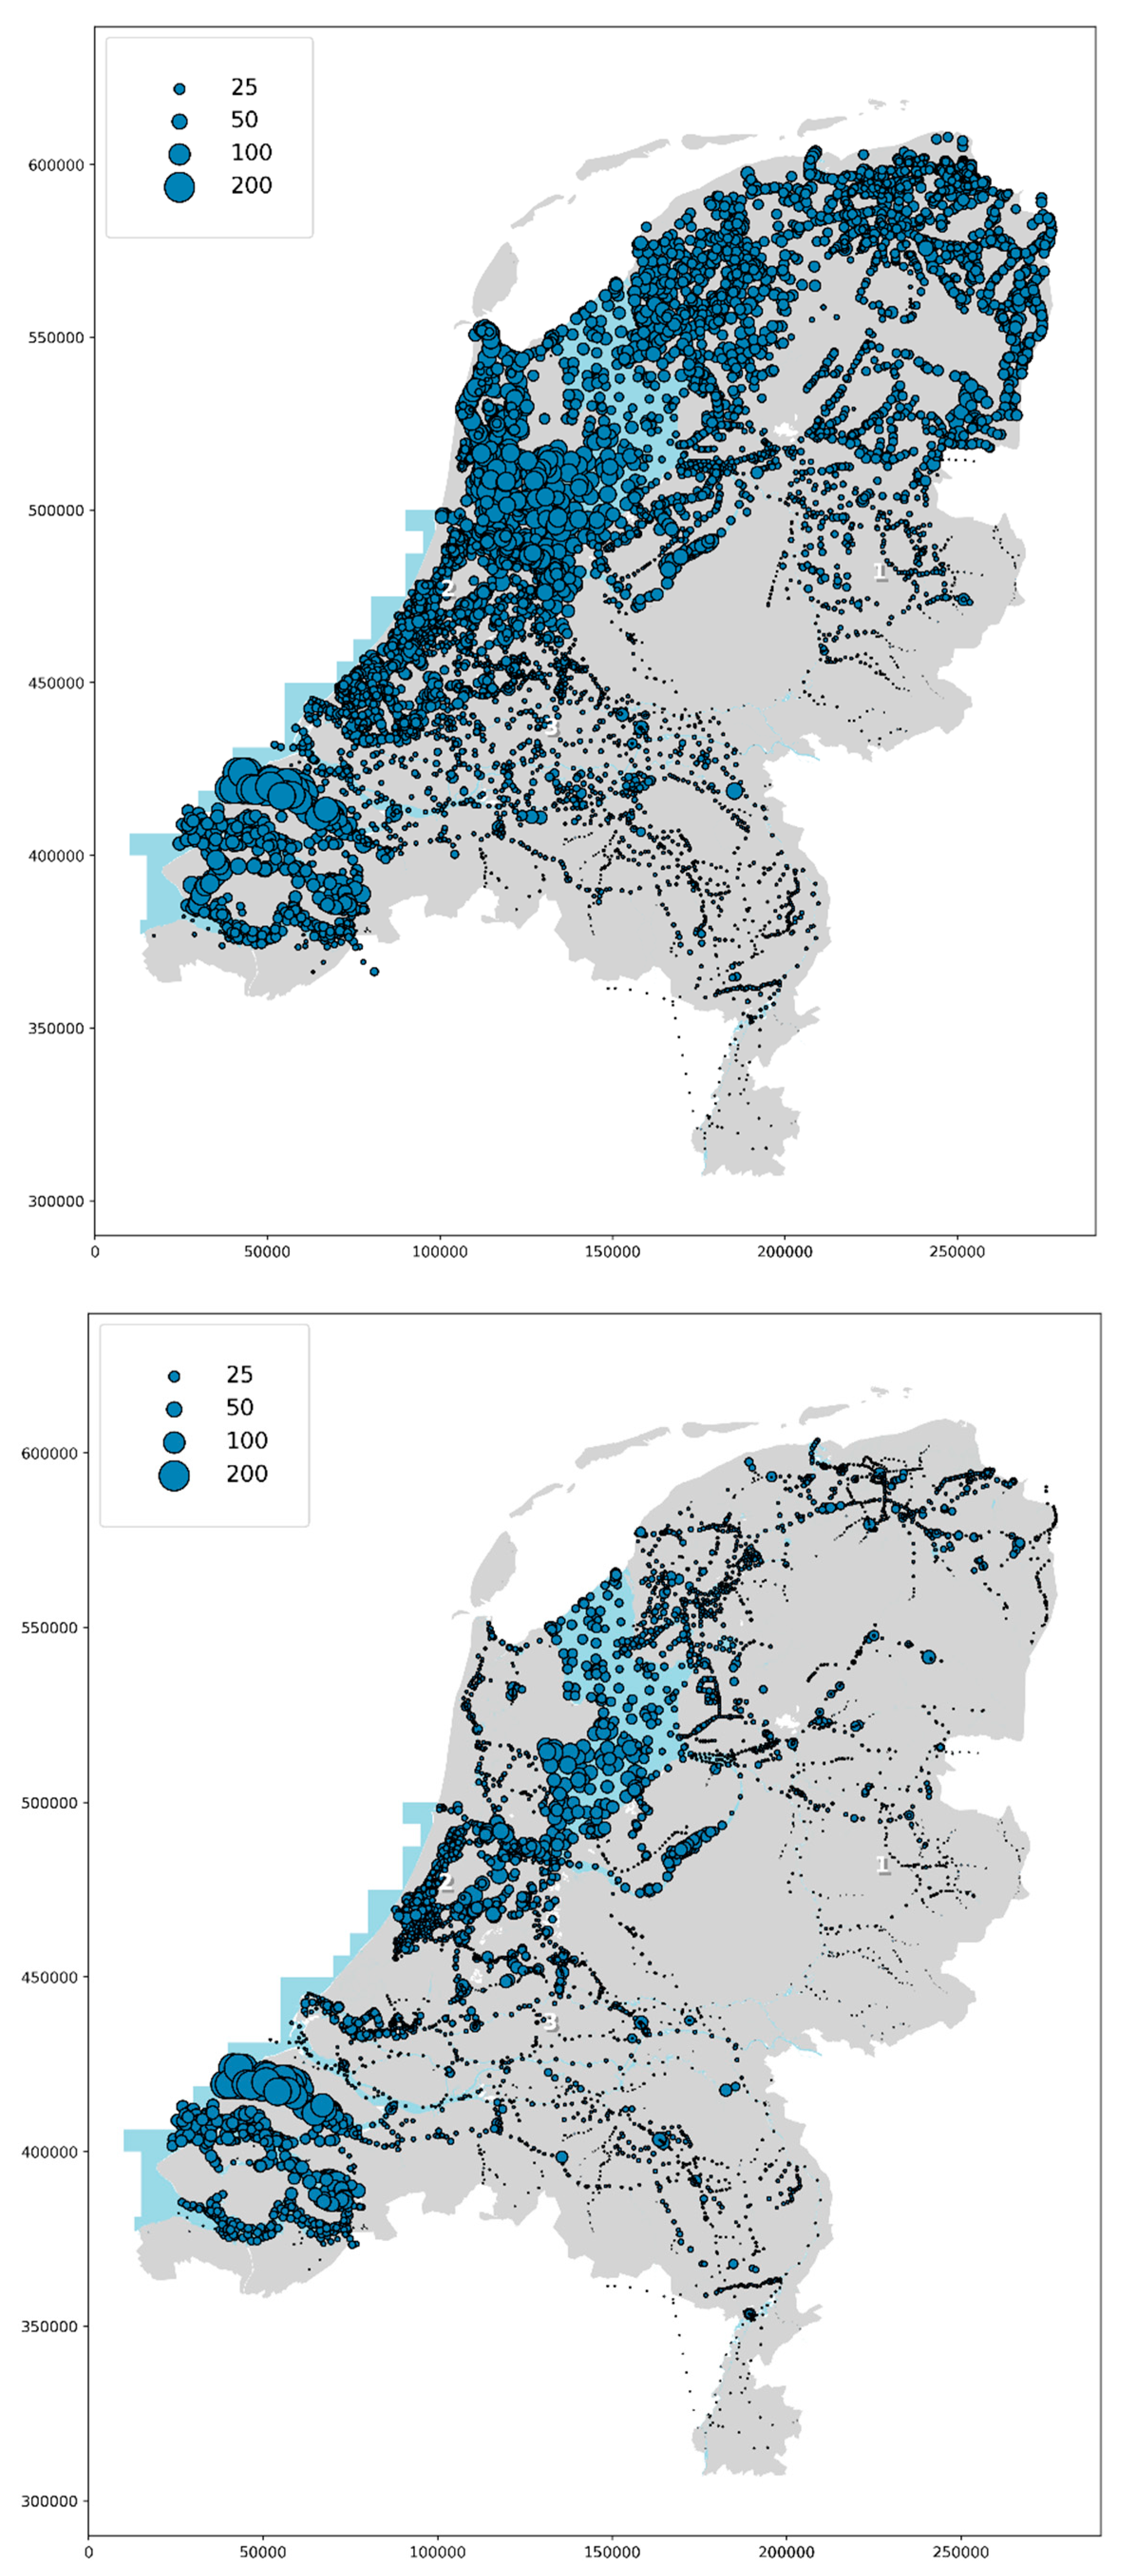
3.2. Distribution of De Facto Reuse
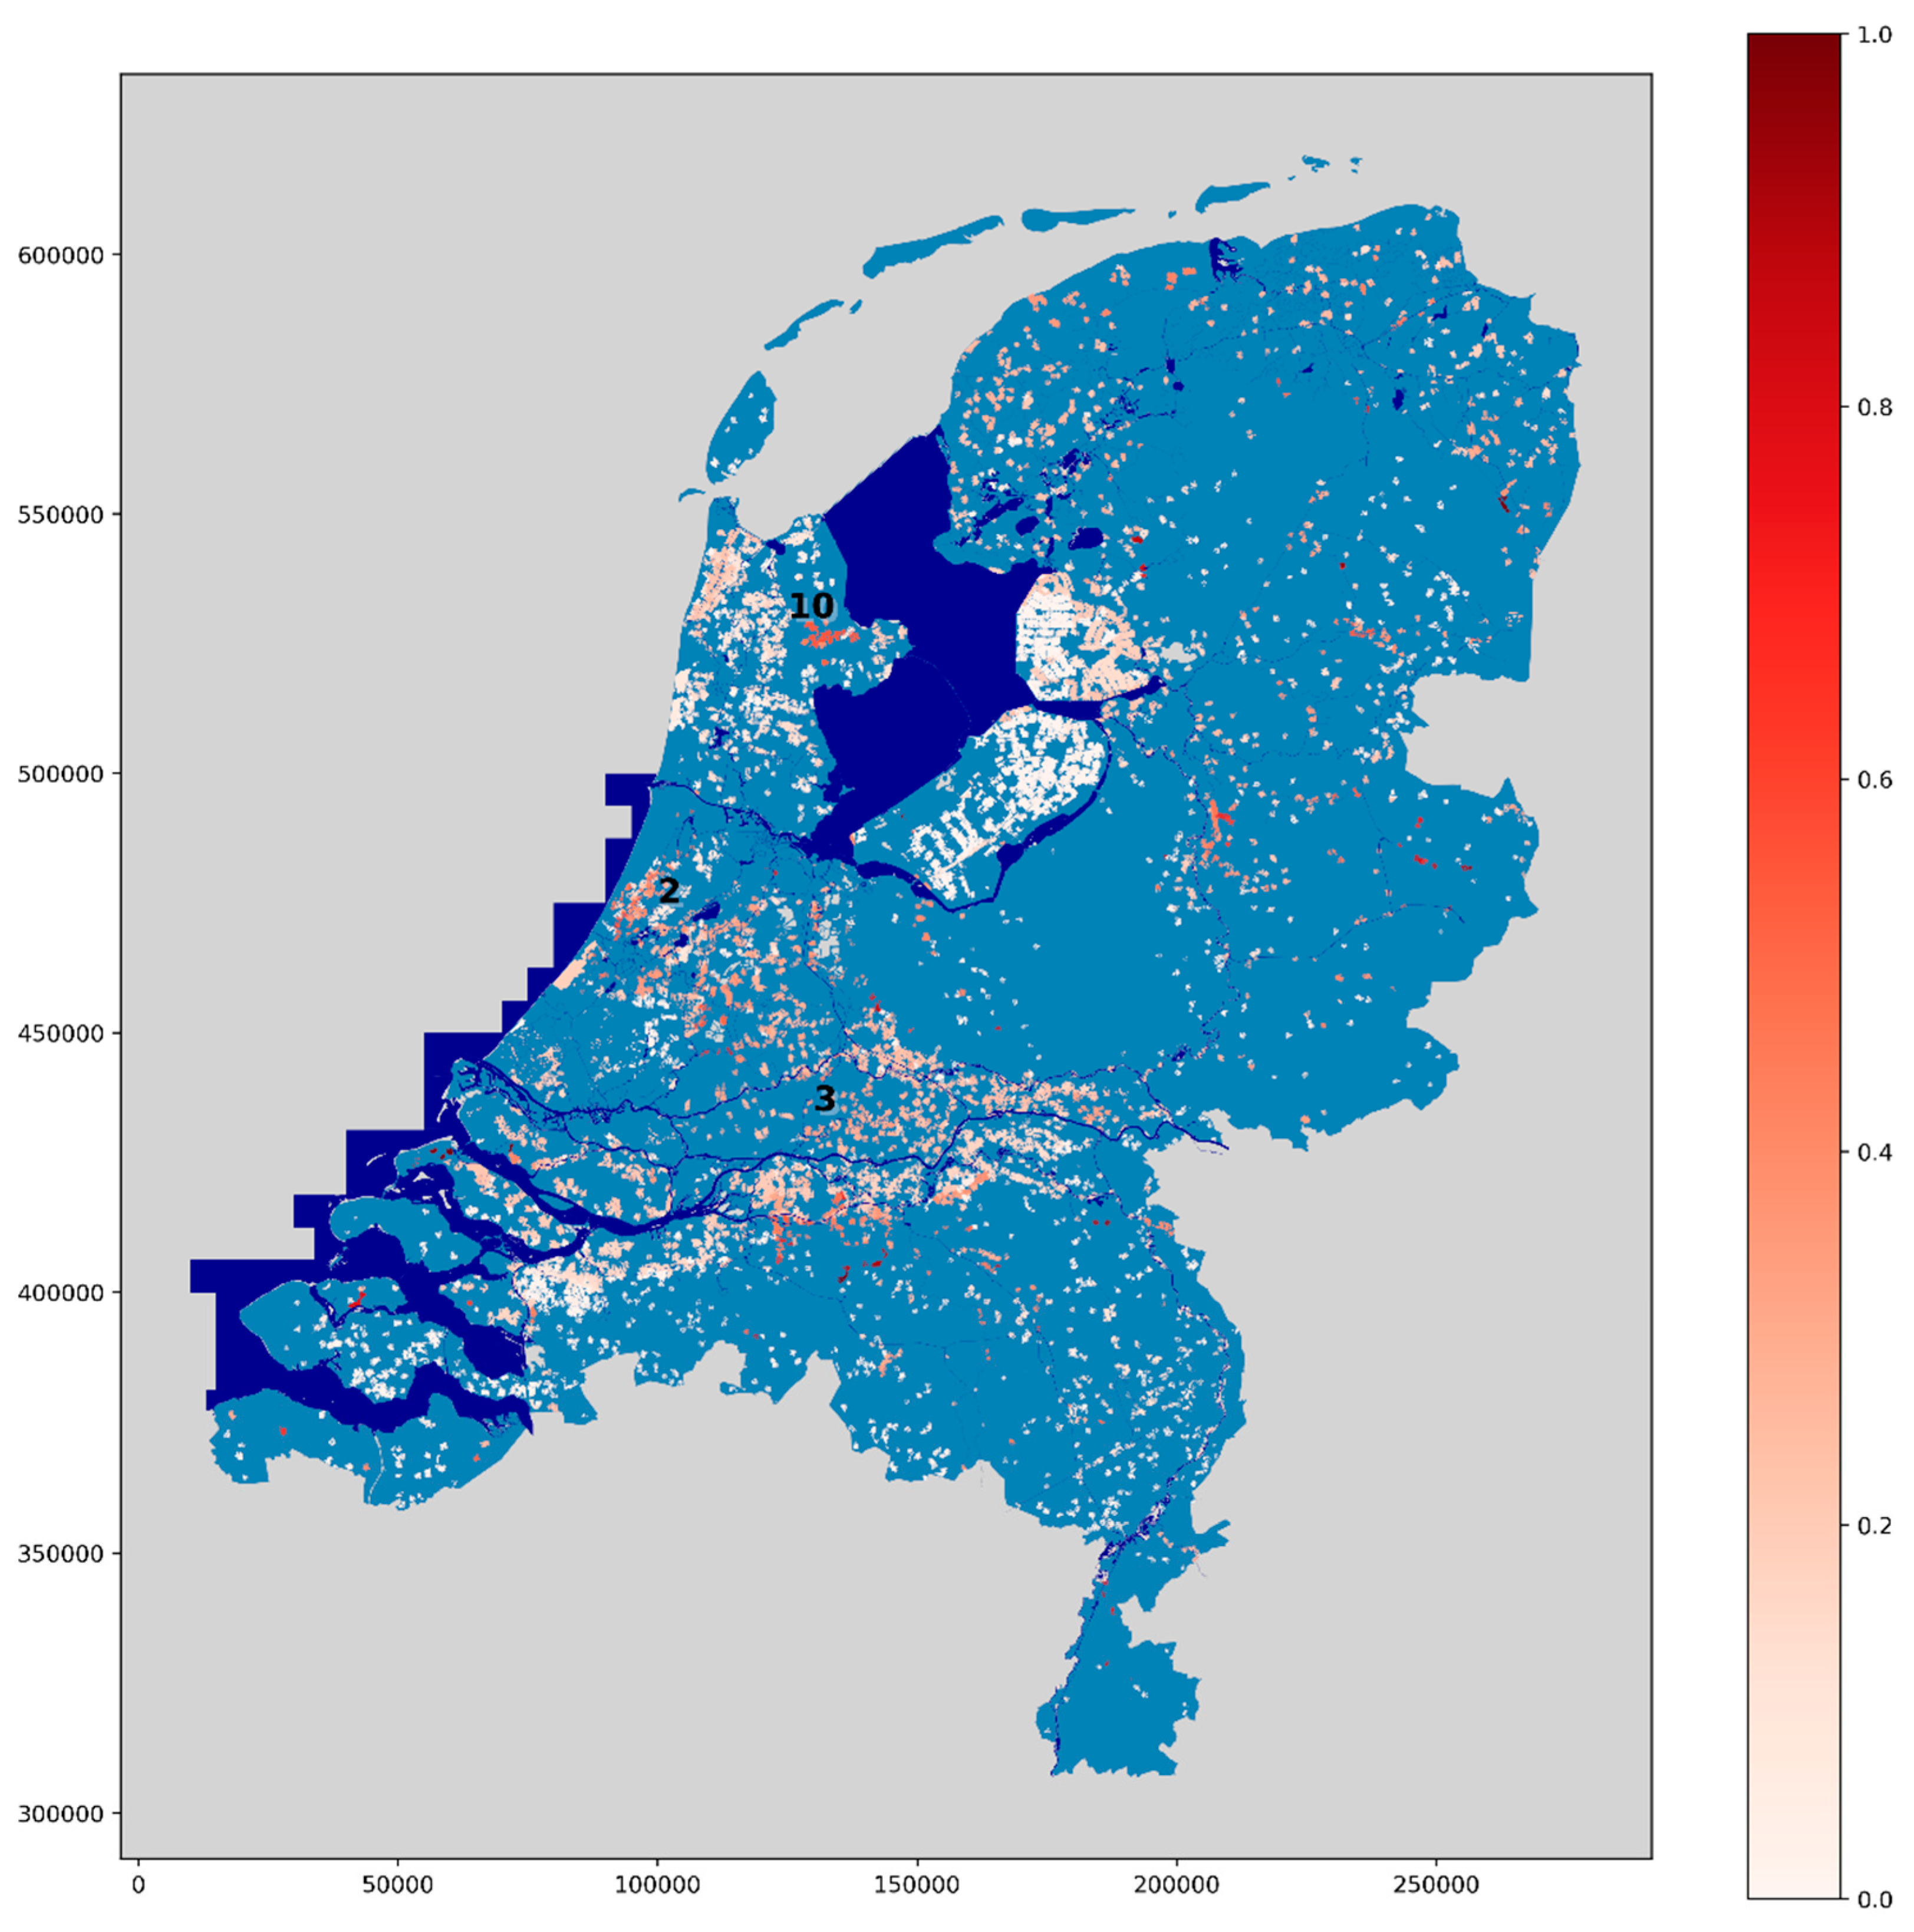
The results indicate that de facto reuse is indeed occurring within the Netherlands, but with a large amount of spatial variation in the extent to which this occurs (Figure 6). Along the Rhine and Meuse, especially in central areas (#3), it is clear that de facto reuse is occurring, with irrigation extractions generally containing 0-40% TWW. In central western areas of the Netherlands (Zuid Holland, #2), a large amount of de facto reuse is also indicated, with extractions coming from surface water bodies, of which 40–80% are impacted by TWW. Another key area which was not obvious during earlier modelling stages is a patch of high de facto reuse (40–60% TWW) in the agricultural area of Noord Holland (#10), in which one WWTP seems to produce a large effect in terms of impaction. Smaller areas in which water used for irrigation seems is highly impacted (80–100%) by TWW do exist but are scattered and only seem to occur for individual fields; these results should be approached with caution, as the framework may yield inaccurate results at the field scale.
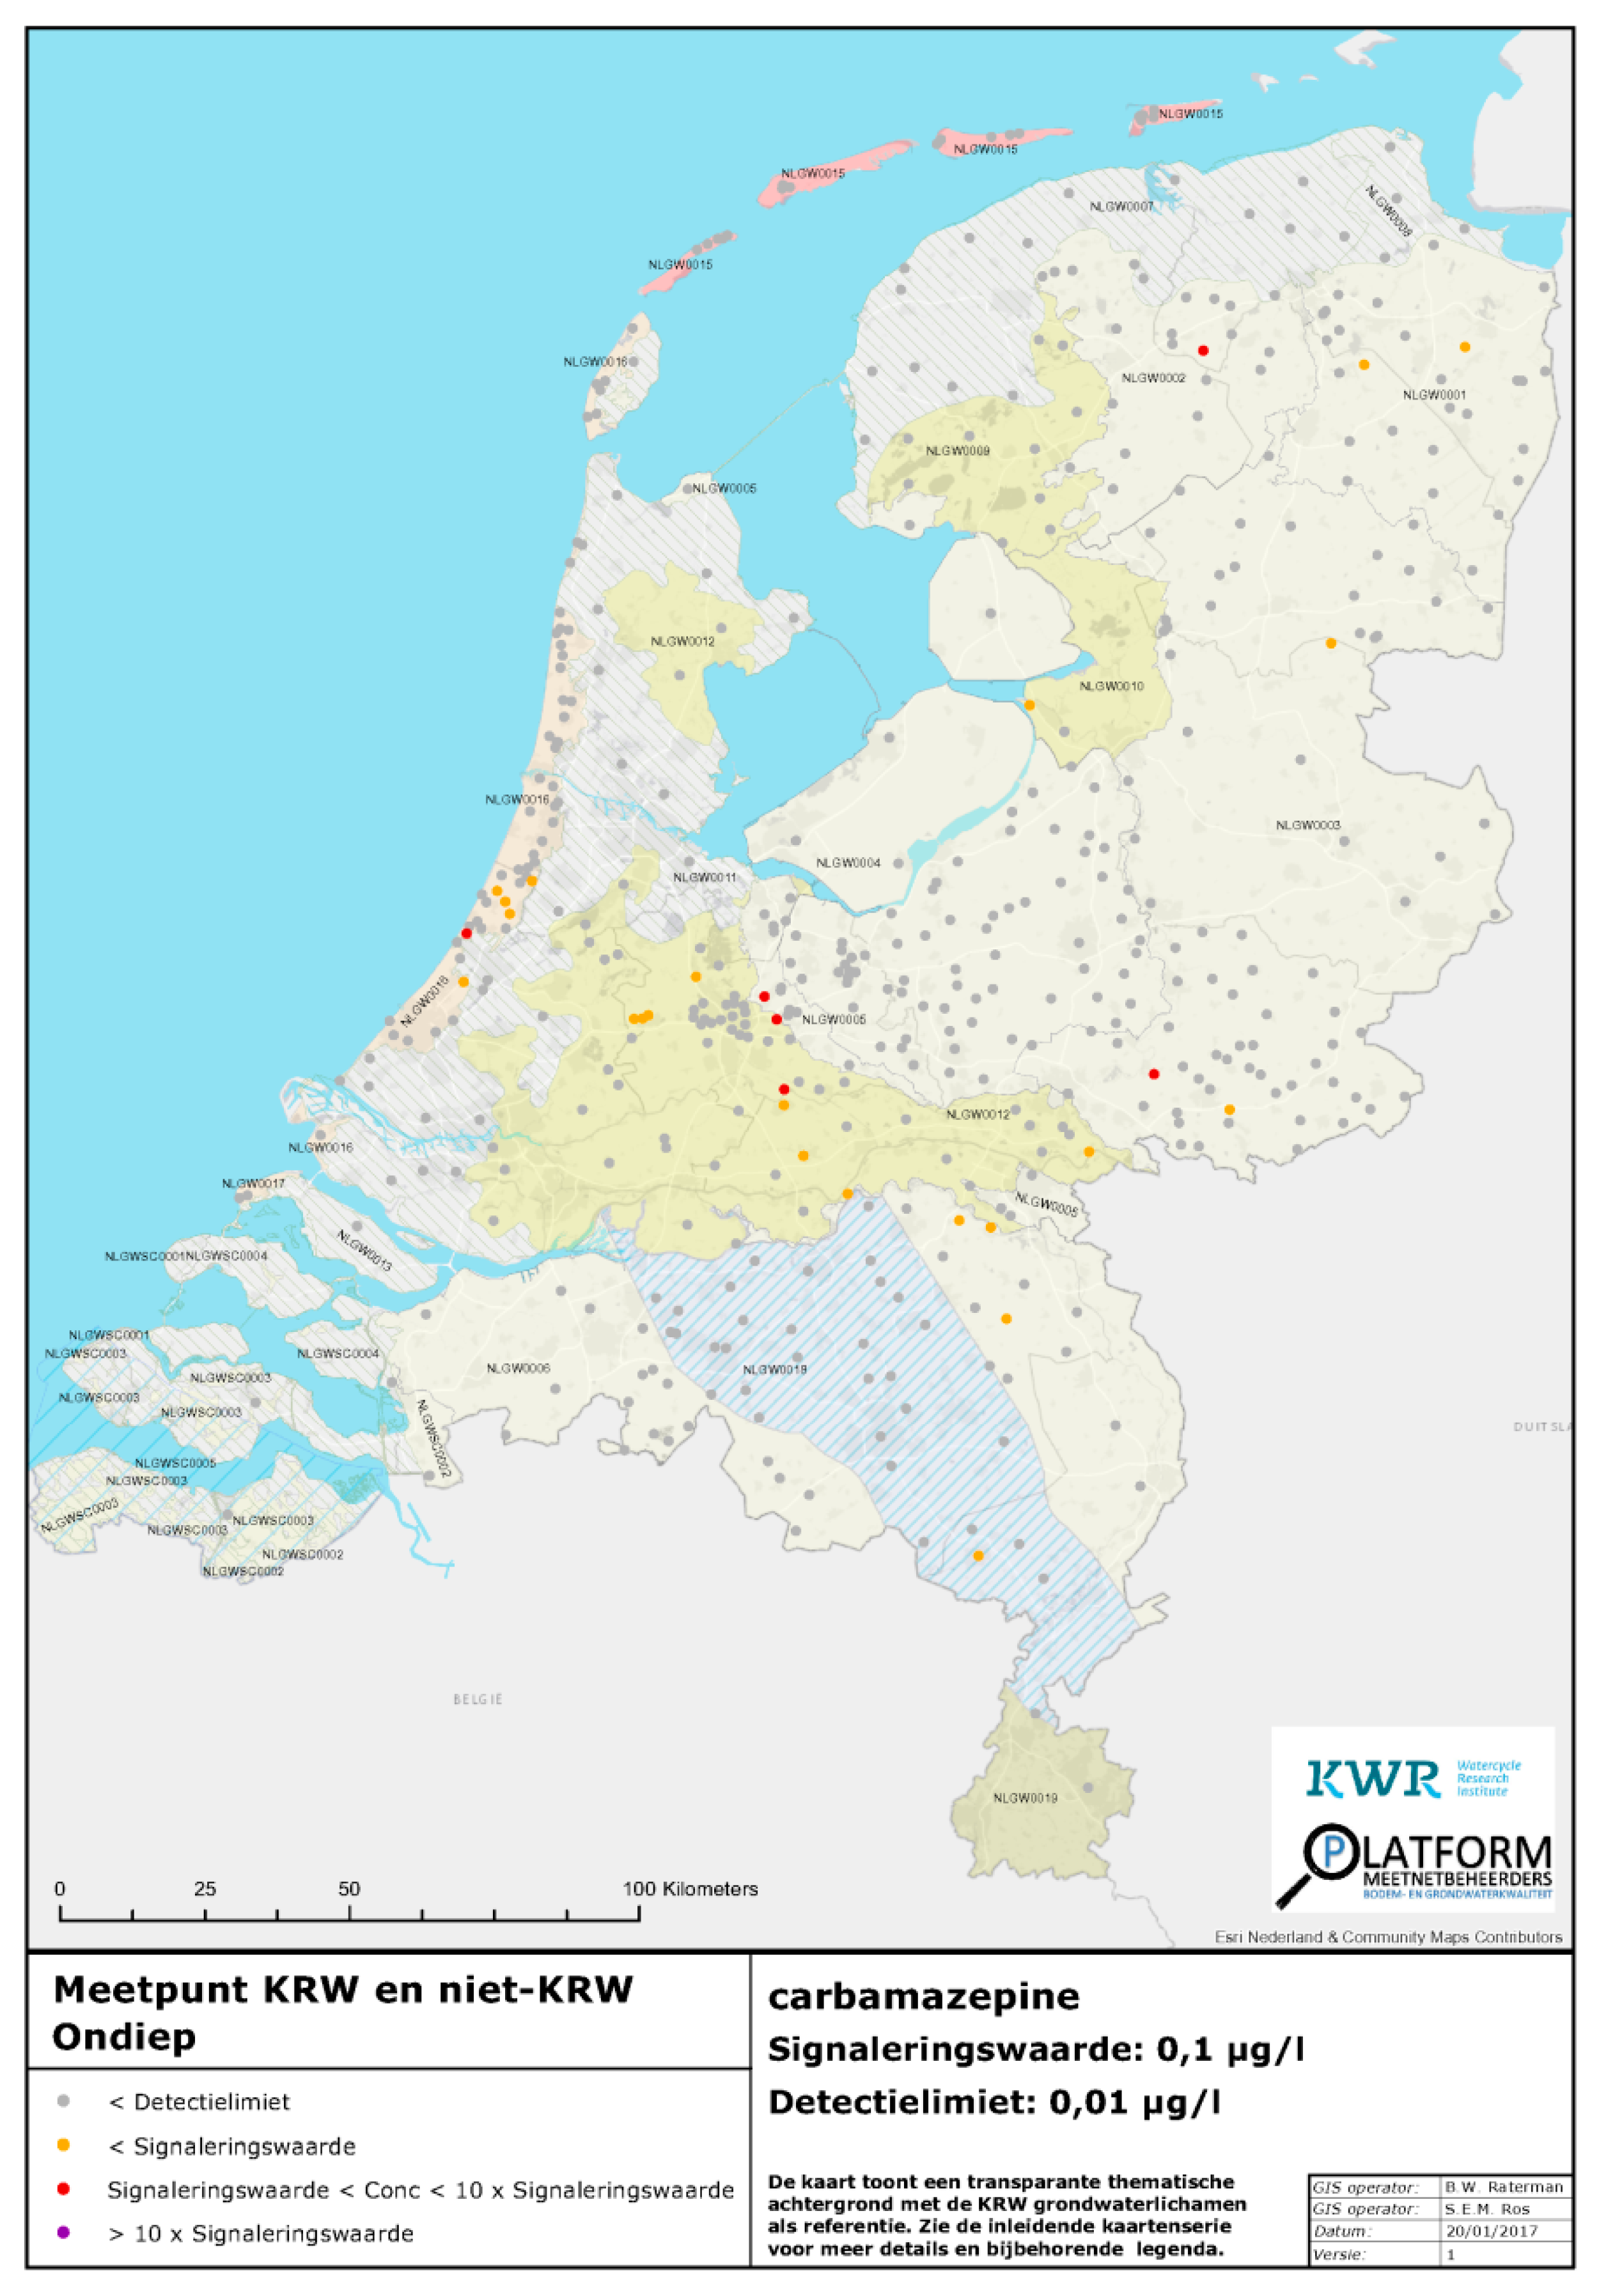
It is difficult to compare these results with others, as they represent the first of their kind in terms of linking TWW emissions to agricultural irrigation. It is, however, worth noting that a recent study on the contamination of groundwater by pharmaceuticals (see Appendix E, Figure A5) detected CBZ in groundwater samples in the same area of concern hereby identified in the western Netherlands (Zuid Holland, #2). This may therefore indicate some link between de facto wastewater reuse for agriculture and contamination of the subsurface by pharmaceuticals.
4. Discussion
4.1. Model Successes, Limitations, Uncertainties
The framework used in this paper helps provide an insight into the distribution of TWW within surface water bodies in the Netherlands, and the flow components (Dutch WWTPs, TRs) which influence this. This assessment was performed on a national scale, differentiating it from other studies which have been employed at the catchment [3] or reach [17] scales. The study also provides a first step towards linking WWTP emissions to de facto reuse within the Netherlands. Indeed, this is one of very few studies to explore this problem [1,3,31], and to date, the only one that follows initial TWW emissions to the planar surface of agricultural fields. This is an important step in that it outlines a pathway by which TWW associated contaminants may spread through the surface water network and even to the subsurface.
The evaluation of model results is far from ideal in that it is only possible for the combined model and the data used is only partial in terms of both space (low coverage) and time (only dry period). It does, however, indicate that the framework is indeed accurate at predicting areas of high TWW impaction. Comparison with a number of existing datasets and studies also indicates a good level of agreement, with maximum impaction values in the same ranges [1,2,3,31,32]. Moreover, all assumptions included in this framework have been carefully considered and grounded as much as possible in best practice or examples given in leading literature on the topic. It would certainly be preferable to validate model results using targeted field samples and therefore in future, a larger dataset of CBZ measurements would be useful to further assess model performance in other areas of the Netherlands. The expansion of current monitoring programmes with more extensive sampling of CBZ concentrations and increased integration of water quality databases will undoubtedly improve future research on this topic. Uncertainty is also introduced by conflicting literature on average values and ranges of CBZ concentrations in pure TWW effluent [32,33,34]. This may be further constrained in future studies via a multiple tracer approach [35,36], or a more complex model relating CBZ to TWW discharges which include the likely effects of decay after discharge from WWTPs. These steps would help to better constrain uncertainty in approximating impaction values for TR inputs and further improve model performance.
A key limitation to this study resides in the fact that it does not explicitly account for different irrigation practices. This is important, as the dominant form in the lower parts of the Netherlands is sub-surface irrigation using polder networks to supply water directly to the root zone [37,38]. A better representation of de facto reuse in agriculture would therefore identify inlets to polder networks from surface water bodies and attach this value to the entire polder area. Data on these inlet points, however, is only partially available through regional water boards; therefore, the steps taken in this study represent a best estimate based upon openly-available national scale datasets. It is likely that the inclusion of this effect would produce larger areas of impact, hence suggesting that estimates of the extent of de facto reuse hereby predicted are conservative.
4.2. Practical Implications
The key result of the study is indicating the extent of de facto reuse of TWW in Dutch agriculture, negating discussions over whether TWW should be reused in the Netherlands [11] by indicating that this practice is already occurring. The next logical step in this discussion is whether this is necessarily problematic. It may be that the reuse of water in areas along the Rhine-Meuse corridor and in Noord Holland is in breach of guidance by the JRC [16] on water quality requirements for irrigation, but without closer monitoring, this is not possible to discern. This necessitates future research on the quality of surface water used for irrigation. A national-scale review of irrigation water quality akin to studies by STOWA [32] and KWR [10] tracing common TWW-related contaminants (CBZ, chloride-bromide ratios among others) would be highly valuable to better inform farmers and water managers on de facto reuse. Targeted measurements of these contaminants in soil water samples and groundwater would directly characterise the impacts of de facto reuse on agricultural areas through tracing the movement of wastewater through the entire hydrological system. This study could be of use in guiding key areas for these monitoring programmes to be located; areas in which high TWW concentrations are predicted (Zuid Holland, Overijssel) should be prioritised in this effort.
Crucially, this issue should be discussed by Dutch water managers, with regulations being created regarding de facto reuse and the quality of irrigation water. This may include the designation of water bodies as extraction-free zones, and the establishment of minimum distances from WWTPs for extractions to occur. An important dimension of this discussion is the agreement of what represents an acceptable risk; in many areas globally (notably including Spain, Italy and Greece), TWW is widely reused in agriculture [3]; therefore, it may be deemed that current levels of reuse within the Netherlands are acceptable within this context. Moreover, risk is dependent on irrigation practices and crop types, with drip and sub-surface irrigation systems reducing the chances of the contamination of produce [39]. The adoption of these irrigation practices and further treatment at WWTPs could represent mitigation strategies if the level of risk is deemed unacceptable.
A key finding of this study is the effects of surface water discharge on impaction and reuse dynamics, which has important implications given the increased occurrence of drought conditions in the Netherlands observed in recent years and predicted for the future [40]. This paper suggests that during drought conditions, TWW is a pervasive component of surface water flow; supporting studies which show surface water quality issues to be more prevalent in dry periods [41,42]. De facto reuse is also shown to be more prevalent during drought owing to increased relative impaction paired with a higher demand for irrigation. TWW is therefore likely to have increased negative impacts in terms of surface and subsurface water contamination, but conversely will represent an increasingly important freshwater resource when other sources are restricted [43]. This lends further weight to arguments for increasing treatment at WWTPs into the future to increase access to sustainable water resources in surface water channels. The current freshwater plan of the Netherlands [28] fails to assess de facto reuse which this study indicates is already occurring and therefore should incorporate this into future reworkings.
A final consideration is the identification in this study of “wastewater dominated” streams [4]; characterised as such when 80–100% of flow is constituted by TWW in dry conditions. Several such streams are indicated throughout the Netherlands, especially in Eastern areas (Overijssel). It is intuitive that these are highly impacted with very short average travel times, suggesting a range of problems in terms of water quality. This study fortunately indicates that extractions from these streams for agricultural irrigation are limited, but other considerations are still applicable; literature on this topic identifies wastewater-dominated streams as ecologically unique since variation in flow is much lower annually [44]. Indeed, in drought periods, the streams may be important in supporting key species in channels which would otherwise be dry [4]. These areas should therefore be carefully monitored, with water use restricted to preserve ecological functioning and prevent the spread of TWW-related contaminants. Other impacts from these streams should also be considered, including whether they may contribute to the transfer of contaminants to pristine groundwater [9].
5. Conclusions
This paper has successfully applied a model framework to simulate the spread of wastewater through the surface water network of the Netherlands, generating data on impaction characteristics for large surface water bodies. It has also succeeded in relating – for the first time – the distribution of wastewater and other flow components within the surface water network to agricultural extractions, creating a picture of de facto wastewater reuse on a national scale.
Key results include the finding that wastewater is present in many surface water bodies, with the areas of highest wastewater impaction identified in Zuid Holland and Overijssel. Levels of impaction are shown to be higher in dry conditions, suggesting that reuse will increase with more common incidences of drought predicted in a changing climate. Extremely high percentages of wastewater (90–100%) are indicated in several small streams close to WWTPs, which may be characterised as “wastewater dominated”. Crucially, this paper allows for a first assessment of de facto reuse in the Netherlands, indicating that the practice is widespread, with notable areas of reuse occurring in the central Netherlands (along the Rhine) and Zuid Holland.
Several key conclusions may be drawn from this study: firstly, that wastewater is a pervasive component of the surface hydrology of the Netherlands during dry/low flow periods, with 100% of flow originating from wastewater discharge in some surface water bodies; and secondly, that wastewater is indeed being widely reused through de facto practices. Acknowledging the occurrence of de facto reuse will allow for surface water resources to be better managed, with extractions and treatment taking place at better informed locations. This supports the creation and enforcement of guidelines for indirect wastewater reuse within the Netherlands, and the establishment of monitoring programmes for irrigation water quality.
Author Contributions
Conceptualization, J.E.B., M.F.P.B. and R.P.B.; Methodology, J.E.B., M.F.P.B. and R.P.B.; Software, J.E.B.; Validation, J.E.B. and R.P.B.; Formal analysis, J.E.B.; Investigation, J.E.B.; Data curation, J.E.B. and R.P.B.; Writing—original draft preparation, J.E.B.; Writing—review and editing, R.P.B. and M.F.P.B.; Visualization, J.E.B.; Supervision, R.P.B. and M.F.P.B.
Funding
This study was carried out within the theme ‘Water in the Circular Economy’ of the joint research program of the Dutch Water Utility sector.
Acknowledgments
Authors want to thank Tessa Pronk (KWR) for support and data relating to WFD-Explorer.
Conflicts of Interest
The authors declare no conflict of interest.
Appendix A
Figure A1.
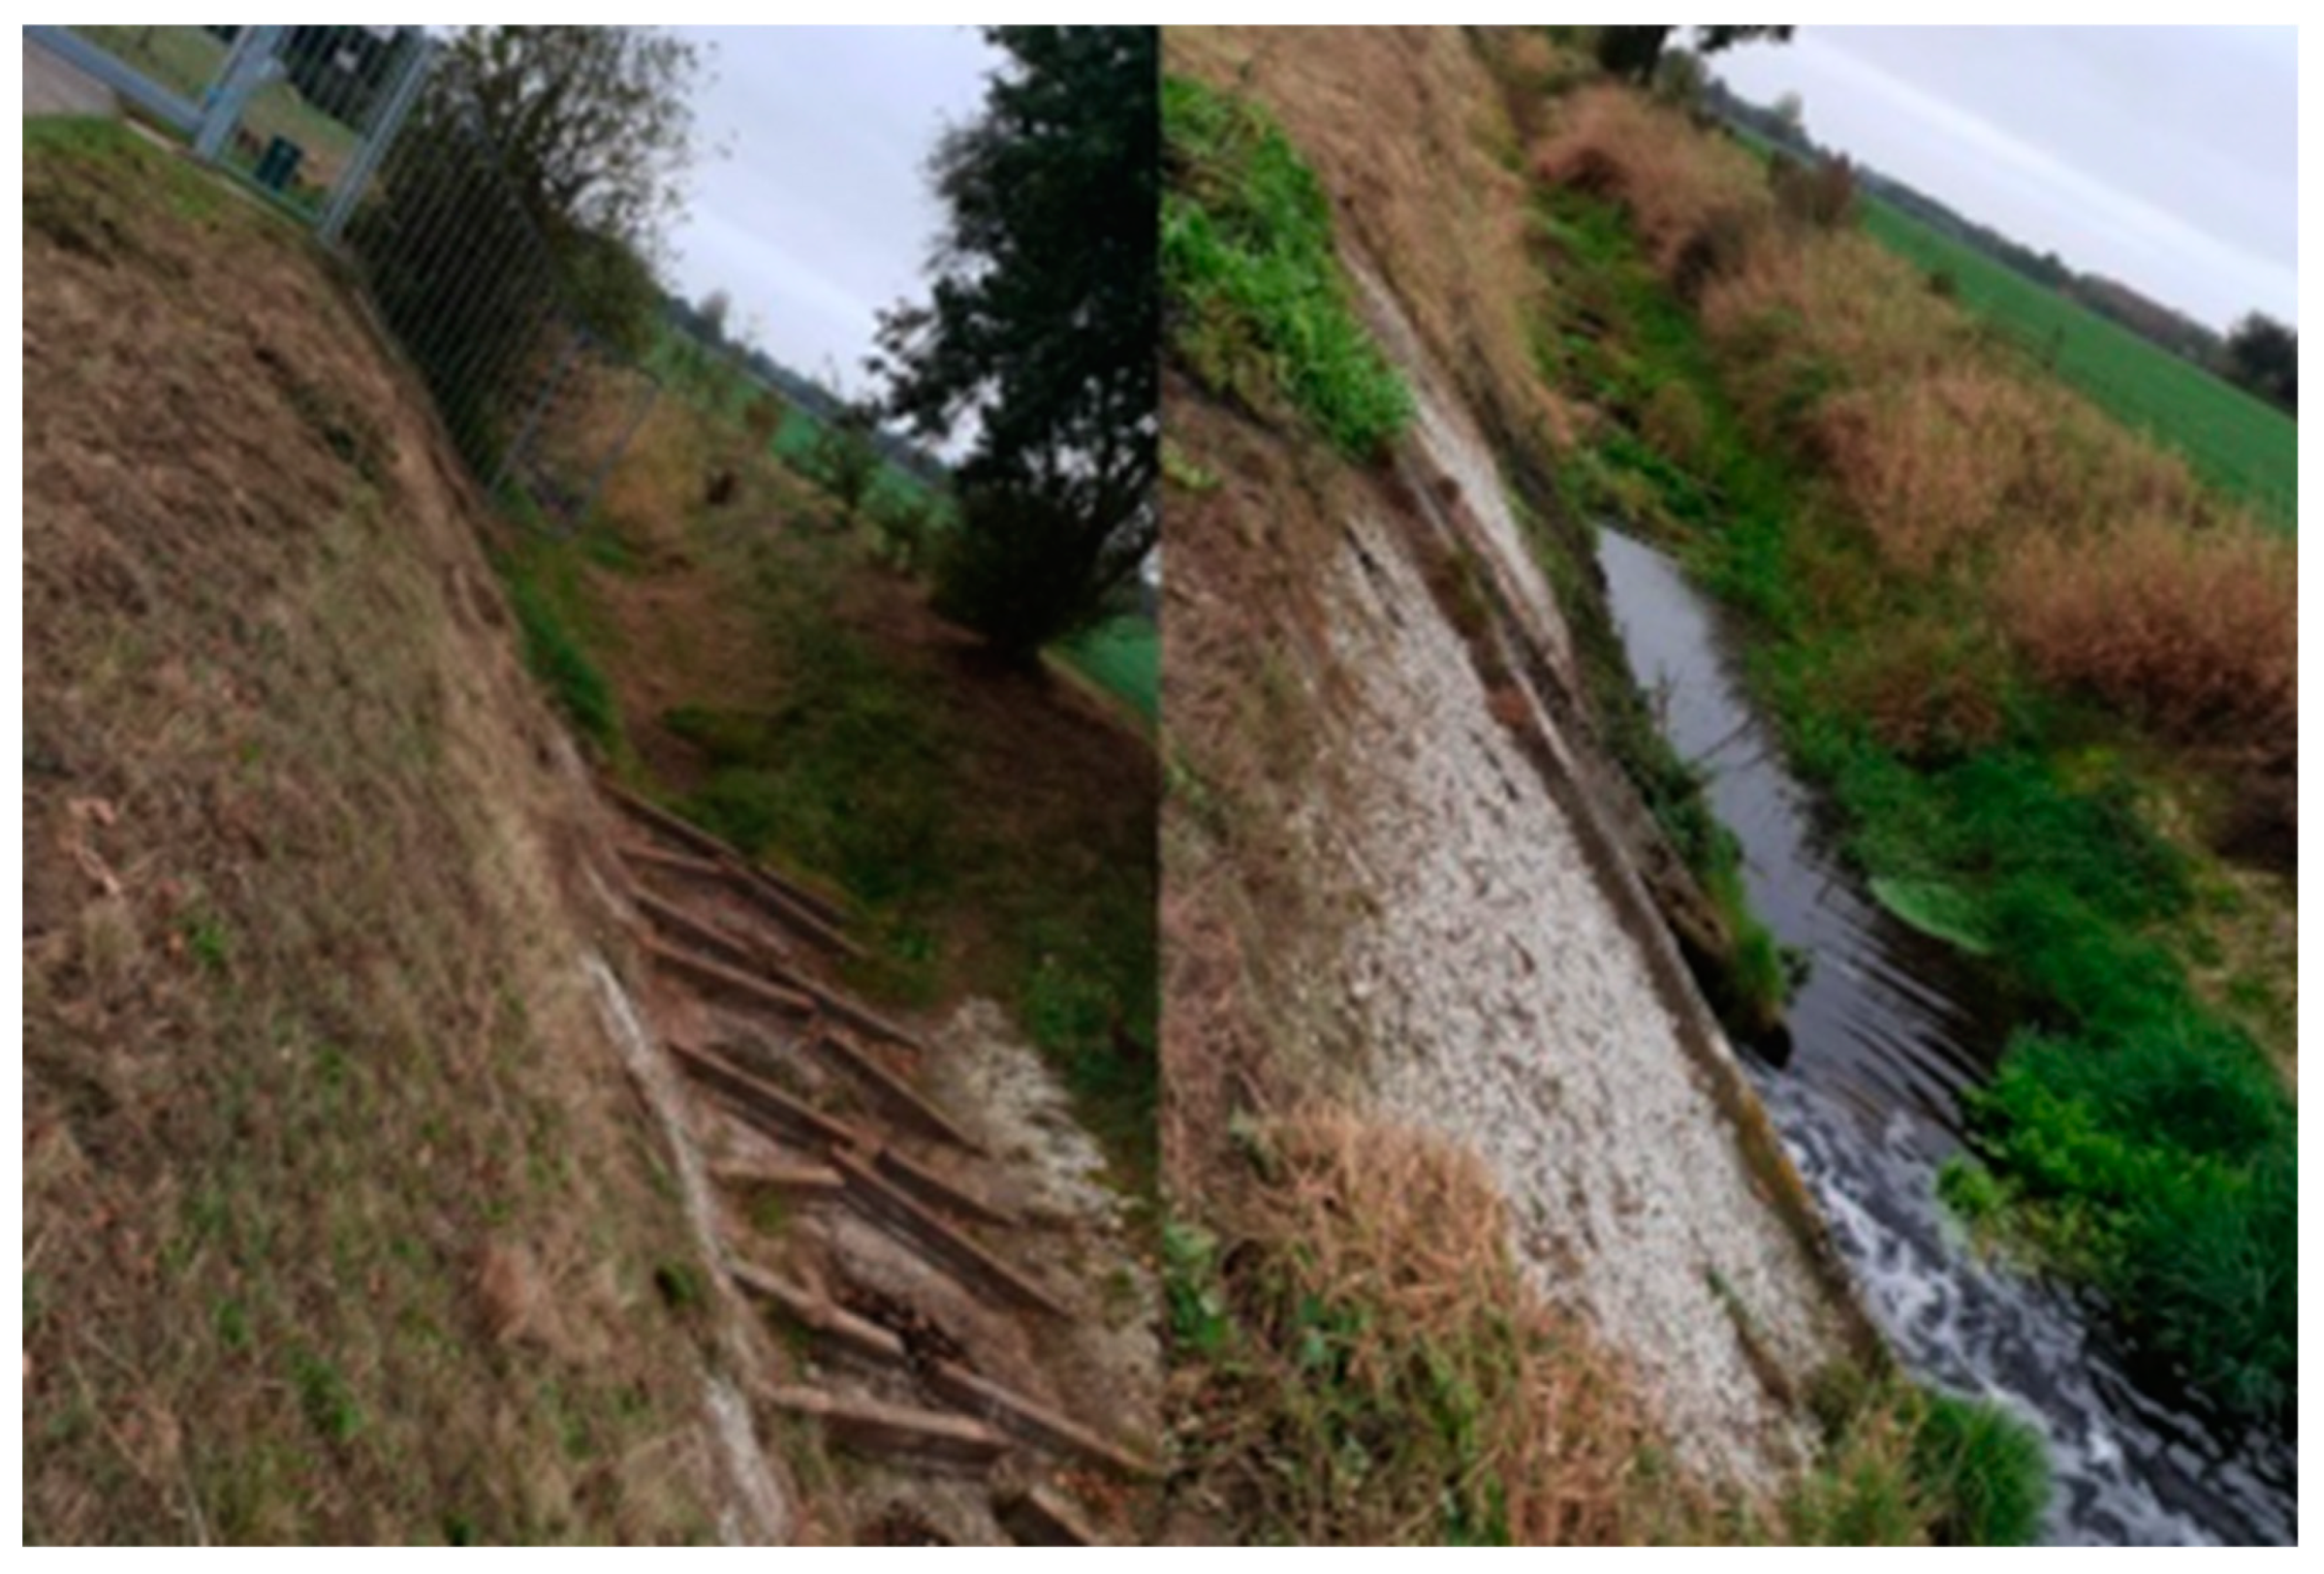
Discharge of TWW from the Haaksbergen WWTP into the Bolscherbeek (right) with dry stream bed shown upstream (left). Taken in drought conditions experienced in 2018.
Figure A1.
Discharge of TWW from the Haaksbergen WWTP into the Bolscherbeek (right) with dry stream bed shown upstream (left). Taken in drought conditions experienced in 2018.

Appendix B
Figure A2.
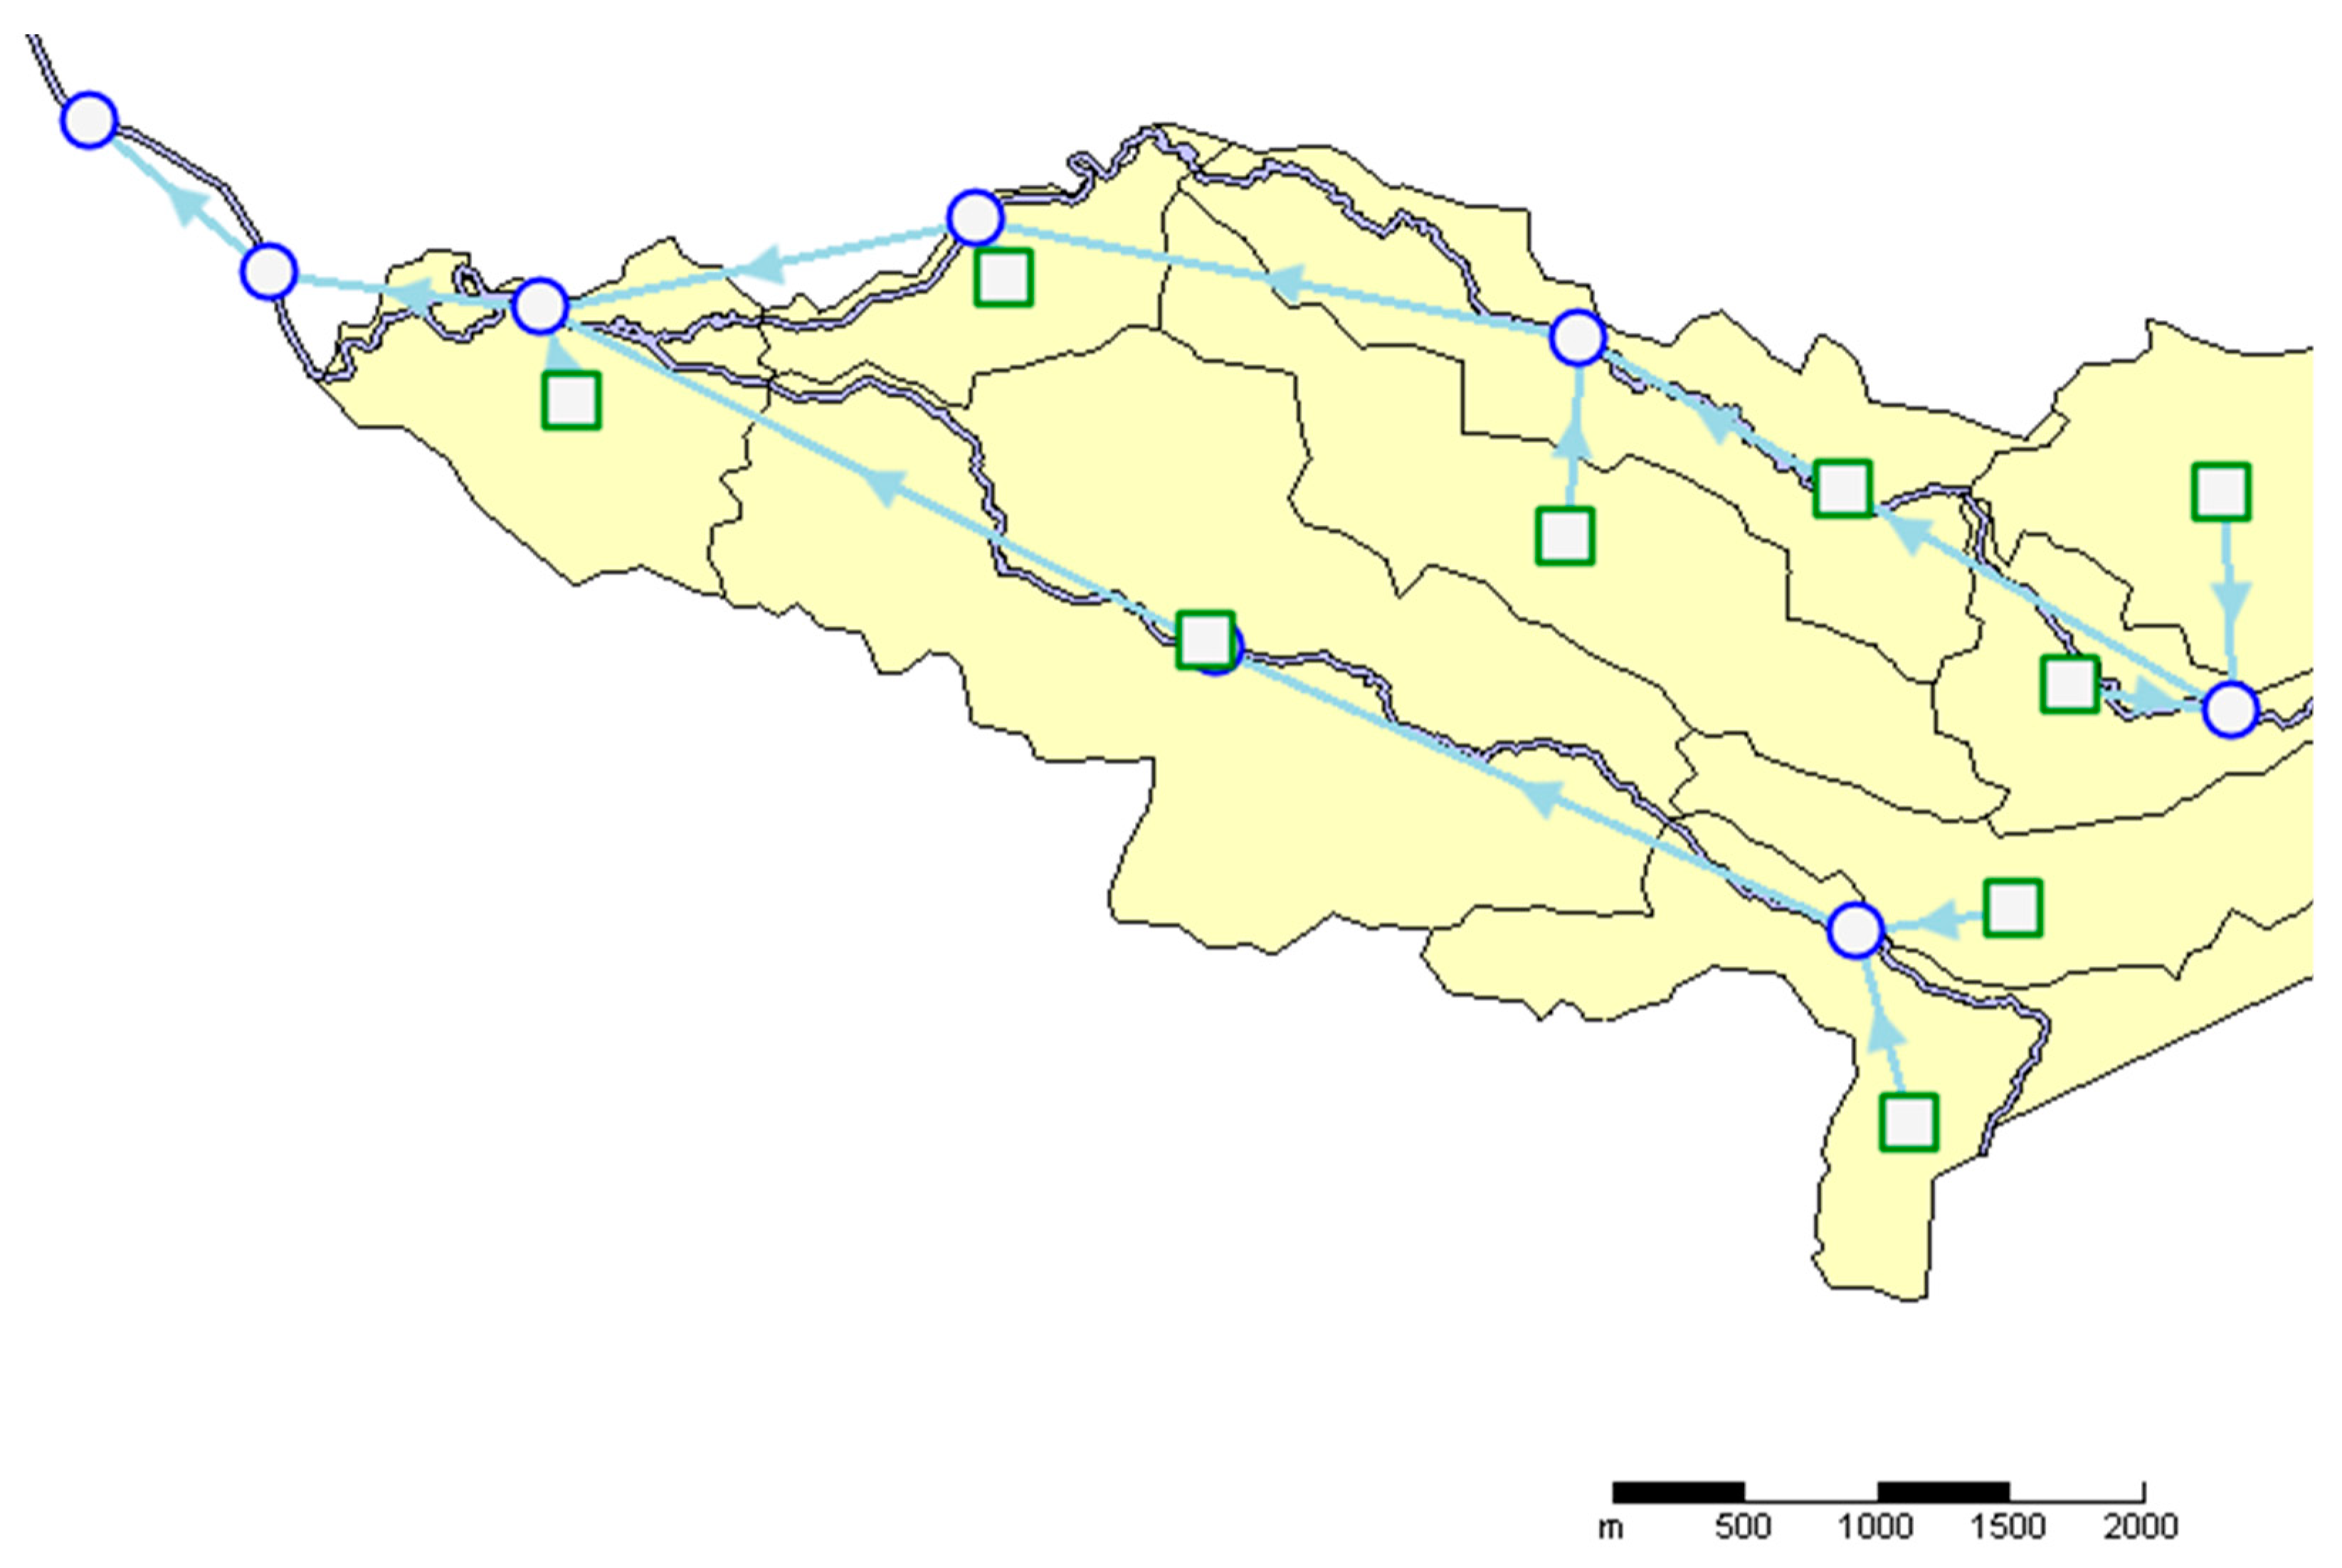
Schematisation of the WFD explorer model, with SWUs as blue circles, point sources of discharge as green squares and links in blue. Taken from Deltares Wiki [20].
Figure A2.
Schematisation of the WFD explorer model, with SWUs as blue circles, point sources of discharge as green squares and links in blue. Taken from Deltares Wiki [20].

Appendix C

Table A1.
Calculated equivalent wastewater discharge values for transboundary inputs at the point at which each river crosses the border.
Table A1.
Calculated equivalent wastewater discharge values for transboundary inputs at the point at which each river crosses the border.
| River | 2007 Q1 (Wet) | 2011 Q2 (Dry) | ||||
|---|---|---|---|---|---|---|
| Average Concentration CBZ (CCBM,obs) [µg l−1] | Average Q (QTOTAL,obs) [m3 s−1] | Equivalent Derived WWQ (QWW) [m3 s−1] | Average Concentration CBZ (CCBM,obs) [µg l−1] | Average Q (QTOTAL,obs) [m3 s−1] | Equivalent Derived WWQ (QWW) [m3 s−1] | |
| Rhine (Lobith) | 0.02 | 3140 | 101.29 | 0.17 | 1180 | 323.55 |
| Meuse (Eijsden) | 0.018 | 637 | 18.49 | 0.07 | 78.8 | 8.9 |
| Vecht | 0.06 | 43.8 | 4.24 | 0.07 | 5.85 | 0.66 |
| Dommel | 0.069 | 3.28 | 0.37 | 0.275 | 1.44 | 0.64 |
| Niers | 0.17 | 13.7 | 3.76 | 0.31 | 5.9 | 2.95 |
| Roer | 0.09 | 29.6 | 4.3 | 0.22 | 10.7 | 3.8 |
| Tongelreep | 0.02 | 1.64 | 0.05 | 0.1 | 0.71 | 0.11 |
| Dinkel | 0.08 | 2.28 | 0.29 | 0.24 | 1.14 | 0.44 |
| Berkel | 0.04 | 5.38 | 0.35 | 0.32 | 2.23 | 1.15 |
| Bocholter | 0.1 | 6.77 | 1.09 | 0.23 | 2.24 | 0.83 |
| Ijssel | 0.08 | 3.06 | 0.39 | 0.39 | 0.75 | 0.47 |
Appendix D
Figure A3.
Visual representation of datasets used in spatial analysis step. The three datasets shown are used to connect surface water bodies to irrigated agricultural areas.
Figure A3.
Visual representation of datasets used in spatial analysis step. The three datasets shown are used to connect surface water bodies to irrigated agricultural areas.

Appendix E
Figure A4.
Results of STOWA study on CBZ concentrations in surface water bodies. Figure taken from “Landelijke Screening Nieuwe Stoffen” report [33].
Figure A4.
Results of STOWA study on CBZ concentrations in surface water bodies. Figure taken from “Landelijke Screening Nieuwe Stoffen” report [33].

Figure A5.
Results of KWR study on CBZ concentrations in shallow groundwater samples. Figure taken from KWR databases made to accompany “Grondwaterkwaliteit Nederland 2015-2016” report [10].
Figure A5.
Results of KWR study on CBZ concentrations in shallow groundwater samples. Figure taken from KWR databases made to accompany “Grondwaterkwaliteit Nederland 2015-2016” report [10].

References
- Thebo, A.L.; Drechsel, P.; Lambin, E.F.; Nelson, K.L. A global, spatially-explicit assessment of irrigated croplands influenced by urban wastewater flows. Environ. Res. Lett. 2017, 12, 074008. [Google Scholar] [CrossRef]
- Coppens, L.J.C.; van Gils, J.A.G.; ter Laak, T.L.; Raterman, B.W.; van Wezel, A.P. Towards spatially smart abatement of human pharmaceuticals in surface waters: Defining impact of sewage treatment plants on susceptible functions. Water Res. 2015, 81, 356–365. [Google Scholar] [CrossRef] [PubMed]
- Drewes, J.E.; Hübner, U.; Zhiteneva, V.; Karakurt, S. Characterization of Unplanned Water Reuse in the EU; Publications Office of the European Union: Luxembourg, 2017. [Google Scholar]
- Luthy, R.G.; Sedlak, D.L.; Plumlee, M.H.; Austin, D.; Resh, V.H. Wastewater-effluent-dominated streams as ecosystem-management tools in a drier climate. Front. Ecol. Environ. 2015, 13, 477–485. [Google Scholar] [CrossRef]
- Hubbard, L.E.; Keefe, S.H.; Kolpin, D.W.; Barber, L.B.; Duris, J.W.; Hutchinson, K.J.; Bradley, P.M. Understanding the hydrologic impacts of wastewater treatment plant discharge to shallow groundwater: Before and after plant shutdown. Environ. Sci. Water Res. Technol. 2016, 2, 864–874. [Google Scholar] [CrossRef]
- Akpor, O.B.; Otohinoyi, D.A.; Olaolu, D.T.; Aderiye, B.I. Pollutants in Wastewater Effluents: Impacts and Remediation Processes. Int. J. Environ. Res. Earth Sci. 2014, 3, 50–59. [Google Scholar]
- Vajda, A.M.; Barber, L.B.; Gray, J.L.; Lopez, E.M.; Woodling, J.D.; Norris, D.O. Reproductive Disruption in Fish Downstream from an Estrogenic Wastewater Effluent. Environ. Sci. Technol. 2008, 42, 3407–3414. [Google Scholar] [CrossRef]
- Gallegos, E.; Warren, A.; Robles, E.; Campoy, E.; Calderon, A.; Sainz, M.G.; Bonilla, P.; Escolero, O. The effects of wastewater irrigation on groundwater quality in Mexico. Water Sci. Technol. 1999, 40, 45–52. [Google Scholar] [CrossRef]
- Kass, A.; Gavrieli, I.; Yechieli, Y.; Vengosh, A.; Starinsky, A. The impact of freshwater and wastewater irrigation on the chemistry of shallow groundwater: A case study from the Israeli Coastal Aquifer. J. Hydrol. 2005, 300, 314–331. [Google Scholar] [CrossRef]
- Sjerps, R.M.A.; Maessen, M.; Raterman, B.W.; Laak, T.L.; ter Stuyfzand, P.J. Grondwaterkwaliteit Nederland 2015–2016; KWR: Nieuwegein, The Netherlands, 2017. [Google Scholar]
- Rietveld, L.C.; Norton-Brandão, D.; Shang, R.; Van Agtmaal, J.; Van Lier, J.B. Possibilities for Reuse of Treated Domestic Wastewater in The Netherlands. Water Sci. Technol. 2011, 64, 1540–1546. [Google Scholar] [CrossRef]
- Ricart, S.; Rico, A.M. Assessing technical and social driving factors of water reuse in agriculture: A review on risks, regulation and the yuck factor. Agric. Water Manag. 2019, 217, 426–439. [Google Scholar] [CrossRef]
- EU. Closing the Loop—An EU Action Plan for the Circular Economy; Publications Office of the European Union: Luxembourg, 2015. [Google Scholar]
- UNESCO. Wastewater: The Untapped Resource: The United Nations World Water Development Report 2017; UNESCO: Paris, France, 2017. [Google Scholar]
- Jeong, H.; Kim, H.; Jang, T.; Jeong, H.; Kim, H.; Jang, T. Irrigation Water Quality Standards for Indirect Wastewater Reuse in Agriculture: A Contribution toward Sustainable Wastewater Reuse in South Korea. Water 2016, 8, 169. [Google Scholar] [CrossRef]
- Alcalde-Sanz, L.; Gawlik, B.M. Minimum Quality Requirements for Water Reuse in Agricultural Irrigation and Aquifer Recharge Towards a Legal Instrument on Water Reuse at EU Level; Publications Office of the European Union: Luxembourg, 2017. [Google Scholar]
- STOWA. Landelijke Hotspotanalyse Geneesmidden RWZI’s; STOWA: Utrecht, The Netherlands, 2017. [Google Scholar]
- Van Wezel, A.P.; van den Hurk, F.; Sjerps, R.M.A.; Meijers, E.M.; Roex, E.W.M.; ter Laak, T.L. Impact of industrial waste water treatment plants on Dutch surface waters and drinking water sources. Sci. Total Environ. 2018, 640–641, 1489–1499. [Google Scholar] [CrossRef] [PubMed]
- Pachepsky, Y.; Shelton, D.R.; Mclain, J.E.T.; Patel, J.; Mandrell, R.E. Irrigation Waters as a Source of Pathogenic Microorganisms in Produce: A Review. In Advances in Agronomy; Academic Press: Cambridge, MA, USA, 2011. [Google Scholar]
- Harezlak, V.; Meijers, E. WFD Explorer an Interactive Water Quality Tool; Deltares: Delft, The Netherlands, 2017. [Google Scholar]
- KNMI. Historisch Verloop Neerslagtekort. Available online: https://www.knmi.nl/nederland-nu/klimatologie/geografische-overzichten/historisch-neerslagtekort (accessed on 17 August 2019).
- Tran, N.H.; Li, J.; Hu, J.; Ong, S.L. Occurrence and suitability of pharmaceuticals and personal care products as molecular markers for raw wastewater contamination in surface water and groundwater. Environ. Sci. Pollut. Res. 2014, 21, 4727–4740. [Google Scholar] [CrossRef] [PubMed]
- Lim, F.; Ong, S.; Hu, J.; Lim, F.Y.; Ong, S.L.; Hu, J. Recent Advances in the Use of Chemical Markers for Tracing Wastewater Contamination in Aquatic Environment: A Review. Water 2017, 9, 143. [Google Scholar] [CrossRef]
- RIVM. Environmental Risk Limits for Pharmaceuticals Derivation of WFD Water Quality Standards for Carbamazepine, Metoprolol, Metformin and Amidotrizoic Acid; RIVM: De Bilt, The Netherlands, 2014. [Google Scholar]
- HydroNET. HydroNET Portal. Available online: https://portal.hydronet.com/default.aspx?page=6&appid=99 (accessed on 23 July 2019).
- Deltares Irrigation Water—Location Irrigation Withdrawals from Groundwater and Surface Water. Available online: https://data.overheid.nl/dataset/49675-irrigatiewater---locatie-beregeningsonttrekkingen-uit-grondwater-en-oppervlaktewater (accessed on 23 July 2019).
- Ministry for Economic Affairs and Climate Dataset: Basic Registration of Crop Plots (BRP). Available online: https://www.pdok.nl/introductie/-/article/basisregistratie-gewaspercelen-brp (accessed on 23 July 2019).
- Klijn, F.; Ter Maat, J.; Van Velzen, A. Zoetwatervoorziening in Nederland; Deltares: Delft, The Netherlands, 2012. [Google Scholar]
- Dickenson, E.R.V.; Snyder, S.A.; Sedlak, D.L.; Drewes, J.E. Indicator compounds for assessment of wastewater effluent contributions to flow and water quality. Water Res. 2011, 45, 1199–1212. [Google Scholar] [CrossRef] [PubMed]
- Brooks, Y.; Aslan, A.; Tamrakar, S.; Murali, B.; Mitchell, J.; Rose, J.B. Analysis of the persistence of enteric markers in sewage polluted water on a solid matrix and in liquid suspension. Water Res. 2015, 76, 201–212. [Google Scholar] [CrossRef] [PubMed]
- Rice, J.; Westerhoff, P. Spatial and Temporal Variation in De Facto Wastewater Reuse in Drinking Water Systems across the U.S.A. Environ. Sci. Technol. 2015, 49, 982–989. [Google Scholar] [CrossRef]
- STOWA. LandeLijke Screening Nieuwe Stoffen; STOWA: Utrecht, The Netherlands, 2015. [Google Scholar]
- RIVM. Geneesmiddelen en Waterkwaliteit; RIVM: De Bilt, The Netherlands, 2016. [Google Scholar]
- Brunsch, A.F.; ter Laak, T.L.; Rijnaarts, H.; Christoffels, E. Pharmaceutical concentration variability at sewage treatment plant outlets dominated by hydrology and other factors. Environ. Pollut. 2018, 235, 615–624. [Google Scholar] [CrossRef]
- Gasser, G.; Pankratov, I.; Elhanany, S.; Glazman, H.; Lev, O. Calculation of wastewater effluent leakage to pristine water sources by the weighted average of multiple tracer approach. Water Resour. Res. 2014, 50, 4269–4282. [Google Scholar] [CrossRef]
- Guillet, G.; Knapp, J.L.A.; Merel, S.; Cirpka, O.A.; Grathwohl, P.; Zwiener, C.; Schwientek, M. Fate of wastewater contaminants in rivers: Using conservative-tracer based transfer functions to assess reactive transport. Sci. Total Environ. 2019, 656, 1250–1260. [Google Scholar] [CrossRef]
- Frank, M.D.; Belcher, H.W. Some Results of Subirrigation in the Ijsselmeerpolders in the Netherlands. In Subirrigation and Controlled Drainage; CRC Press: Boca Raton, FL, USA, 1994. [Google Scholar]
- Hagan, R.M.; Haise, H.R.; Edminster, T.W.; Criddle, W.D.; Kalisvaart, C. Subirrigation Systems. In Irrigation of Agricultural Lands; American Society of Agronomy: Madison, WI, USA, 1967. [Google Scholar]
- Navarro, I.; Chavez, A.; Barrios, J.A.; Maya, C.; Becerril, E.; Lucario, S.; Jimenez, B. Wastewater Reuse for Irrigation—Practices, Safe Reuse and Perspectives. In Irrigation and Drainage—Sustainable Strategies and Systems; InTech: London, UK, 2015. [Google Scholar]
- Feyen, L.; Dankers, R. Impact of global warming on streamflow drought in Europe. J. Geophys. Res. 2009, 114, D17116. [Google Scholar] [CrossRef]
- Mosley, L.M. Drought Impacts on the Water Quality of Freshwater Systems; Review and Integration. Earth Sci. Rev. 2015, 140, 203–214. [Google Scholar] [CrossRef]
- Van Vliet, M.T.H.; Zwolsman, J.J.G. Impact of summer droughts on the water quality of the Meuse river. J. Hydrol. 2008, 353, 1–17. [Google Scholar] [CrossRef]
- Pedrero, F.; Kalavrouziotis, I.; Alarcón, J.J.; Koukoulakis, P.; Asano, T. Use of treated municipal wastewater in irrigated agriculture—Review of some practices in Spain and Greece. Agric. Water Manag. 2010, 97, 1233–1241. [Google Scholar] [CrossRef]
- Brooks, B.W.; Riley, T.M.; Taylor, R.D. Water Quality of Effluent-dominated Ecosystems: Ecotoxicological, Hydrological, and Management Considerations. Hydrobiologia 2006, 556, 365–379. [Google Scholar] [CrossRef]
Figure 1.
Methodological setup: following the (waste)water from emission to application.

Figure 2.
Proportion discharge through SWUs originating from each component for 2011 Q2 (top) and 2007 Q1 (bottom), representing dry and wet conditions respectively. Black dots represent an absence of data. Numbers represent specific points of interest referred to in the text.
Figure 2.
Proportion discharge through SWUs originating from each component for 2011 Q2 (top) and 2007 Q1 (bottom), representing dry and wet conditions respectively. Black dots represent an absence of data. Numbers represent specific points of interest referred to in the text.

Figure 3.
Proportion discharge through SWUs originating from TWW effluent from both Dutch and international WWTPs for 2011 Q2 (top) and 2007 Q1 (bottom), representing dry and wet conditions respectively. Numbers represent specific points of interest referred to in the text.
Figure 3.
Proportion discharge through SWUs originating from TWW effluent from both Dutch and international WWTPs for 2011 Q2 (top) and 2007 Q1 (bottom), representing dry and wet conditions respectively. Numbers represent specific points of interest referred to in the text.

Figure 4.
Relationship between modelled and observed results from Hydronet and RIWA data with the locations of measurement points for CBZ inset.
Figure 4.
Relationship between modelled and observed results from Hydronet and RIWA data with the locations of measurement points for CBZ inset.

Figure 5.
Average travel times [days] between Dutch wastewater treatment plants and receiving surface water bodies for 2011 Q2 (top) and 2007 Q1 (bottom), representing dry and wet conditions respectively. Numbers represent specific points of interest referred to in the text.
Figure 5.
Average travel times [days] between Dutch wastewater treatment plants and receiving surface water bodies for 2011 Q2 (top) and 2007 Q1 (bottom), representing dry and wet conditions respectively. Numbers represent specific points of interest referred to in the text.

Figure 6.
TWW impaction of surface water extracted and used to irrigate the agricultural fields for the dry period considered (2011 Q2). Fields with impaction values of lower than 10% are not plotted. Numbers represent specific points of interest referred to in the text.
Figure 6.
TWW impaction of surface water extracted and used to irrigate the agricultural fields for the dry period considered (2011 Q2). Fields with impaction values of lower than 10% are not plotted. Numbers represent specific points of interest referred to in the text.

Table 1.
Simplified transfer matrix considering 3 WWTPs and 3 SWUs, indicating how a flux from each WWTP becomes distributed in the surface water network.
Table 1.
Simplified transfer matrix considering 3 WWTPs and 3 SWUs, indicating how a flux from each WWTP becomes distributed in the surface water network.
| SWU | Point Sources | ∑flux through SWU [g/s] | ||
|---|---|---|---|---|
| Flux from WWTP1 [g/s] | Flux from WWTP2 [g/s] | Flux from WWTP3 [g/s] | ||
| SWU1 | 100 | 200 | 500 | 800 |
| SWU2 | 200 | 0 | 300 | 500 |
| SWU3 | 700 | 800 | 200 | 1700 |
| ∑flux | 1000 | 1000 | 1000 |
Table 2.
Simplified scaling procedure (applied to the first two WWTPs detailed in Table 1) in order to estimate percentage of TWW impaction of SWUs (Iww).
Table 2.
Simplified scaling procedure (applied to the first two WWTPs detailed in Table 1) in order to estimate percentage of TWW impaction of SWUs (Iww).
| SWU | WWTP1 (WWQ = 2 [m3s−1]) | WWTP2 (WWQ = 0.5 [m3s−1]) | ∑WWQs through SWU (QWW) [m3s−1] | Total Q SWU (QTOTAL) [m3s−1] | Percentage TWW Impaction (IWW) [%] | ||
|---|---|---|---|---|---|---|---|
| Scaling Fraction [-] | WWQ Equivalent [m3s−1] | Scaling Fraction [-] | WWQ Equivalent [m3s−1] | ||||
| SWU1 | 0.1 | 0.2 | 0.1 | 0.05 | 0.25 | 0.5 | 50 |
| SWU2 | 0.2 | 0.4 | 0 | 0 | 0.4 | 40 | 1 |
| SWU3 | 0.7 | 1.4 | 0.4 | 0.2 | 1.6 | 1.6 | 100 |
© 2019 by the authors. Licensee MDPI, Basel, Switzerland. This article is an open access article distributed under the terms and conditions of the Creative Commons Attribution (CC BY) license (http://creativecommons.org/licenses/by/4.0/).
Share and Cite
MDPI and ACS Style
Beard, J.E.; Bierkens, M.F.P.; Bartholomeus, R.P. Following the Water: Characterising de facto Wastewater Reuse in Agriculture in the Netherlands. Sustainability 2019, 11, 5936. https://doi.org/10.3390/su11215936
AMA Style
Beard JE, Bierkens MFP, Bartholomeus RP. Following the Water: Characterising de facto Wastewater Reuse in Agriculture in the Netherlands. Sustainability. 2019; 11(21):5936. https://doi.org/10.3390/su11215936
Chicago/Turabian StyleBeard, Jack E., Marc F.P. Bierkens, and Ruud P. Bartholomeus. 2019. "Following the Water: Characterising de facto Wastewater Reuse in Agriculture in the Netherlands" Sustainability 11, no. 21: 5936. https://doi.org/10.3390/su11215936
Note that from the first issue of 2016, this journal uses article numbers instead of page numbers. See further details here.