1. Introduction
The use of a robot team or fleet to execute time critical or modular missions, such as search and rescue operations, can offer more possibilities than using a single robot, including more robustness and adaptability. The main reason is that a group of robots can execute several tasks in parallel, allocating each robot to the specific task that it is best suited to it and allowing the risk of having a single point of failure. Nevertheless, using a group of robots introduces some additional challenges. One of the most complex is supervising and controlling every robot in the fleet. In fact, operators have to receive data from every robot, discover or filter the most relevant information, make appropriate decisions, and then send commands back to the robots. Furthermore, as the number of robots in the fleet increases, the aforementioned tasks also increase in difficulty and require more effort from the operator. In addition to this complexity, it is a fact that most operators usually rely on conventional interfaces that consist of screens, keyboards, mice, and joysticks. The work presented here is motivated by these difficulties, and its broad intention is to facilitate the work of controlling robot fleets in search and rescue missions by reducing the operator’s workload and improving its situational awareness, which have been reported in the literature as some of the most important human factors’ challenges for multi-robot operation [
1].
Workload can be defined as the sum of the amount of work, the working time, and the subjective experience of the operator [
2]. More specifically, the study of workload usually takes into account multiple attributes (input load, operator effort, and work performance) [
3] and dimensions (physical and mental demand) [
4]. Situational awareness can be defined as the perception of elements in the environment within a volume of time and space (level 1), the comprehension of their meaning (level 2), and the projection of their status in the near future (level 3) [
5].
The challenges faced by multi-robot operators can be addressed by developing immersive and adaptive interfaces. The former apply virtual or augmented reality to introduce operators into the environment, improving their perception of the agents and their mission awareness [
6]. The latter take on some of the operator’s tasks and provide the worker with the most relevant information and the most suitable decisions available, thus reducing the operators’ workload and improving their performance [
7].
In particular, adaptive interfaces change their configuration according to the mission and the operator’s preferences. Therefore, such interfaces require adequate models to track the state and evolution of missions [
8], as well as knowing the state and preferences of operators. Currently, operators are trained to use interfaces, but in the near future this can be turned inside out: the interfaces will adapt to operators so as to facilitate their work, possibly by adapting the information and available commands displayed to operators.
This paper addresses the study of an approach to improve teleoperated multi-robot missions. To address this study, a videogame inspired by a search and rescue scenario was designed. In this videogame, a team of and aerial and ground robots have to explore a maze and locate victims. The movements and plays of several users were recorded and used as input data for the modeling and prediction of the operators’ behaviors. To do this, clustering techniques are used to separate the operators into different groups according to their behaviors, and then an evaluation is made to select which target group is the best for predicting the operators’ behavior. This strategy helps to predict new strategies and improve teleoperated multi-robot missions.
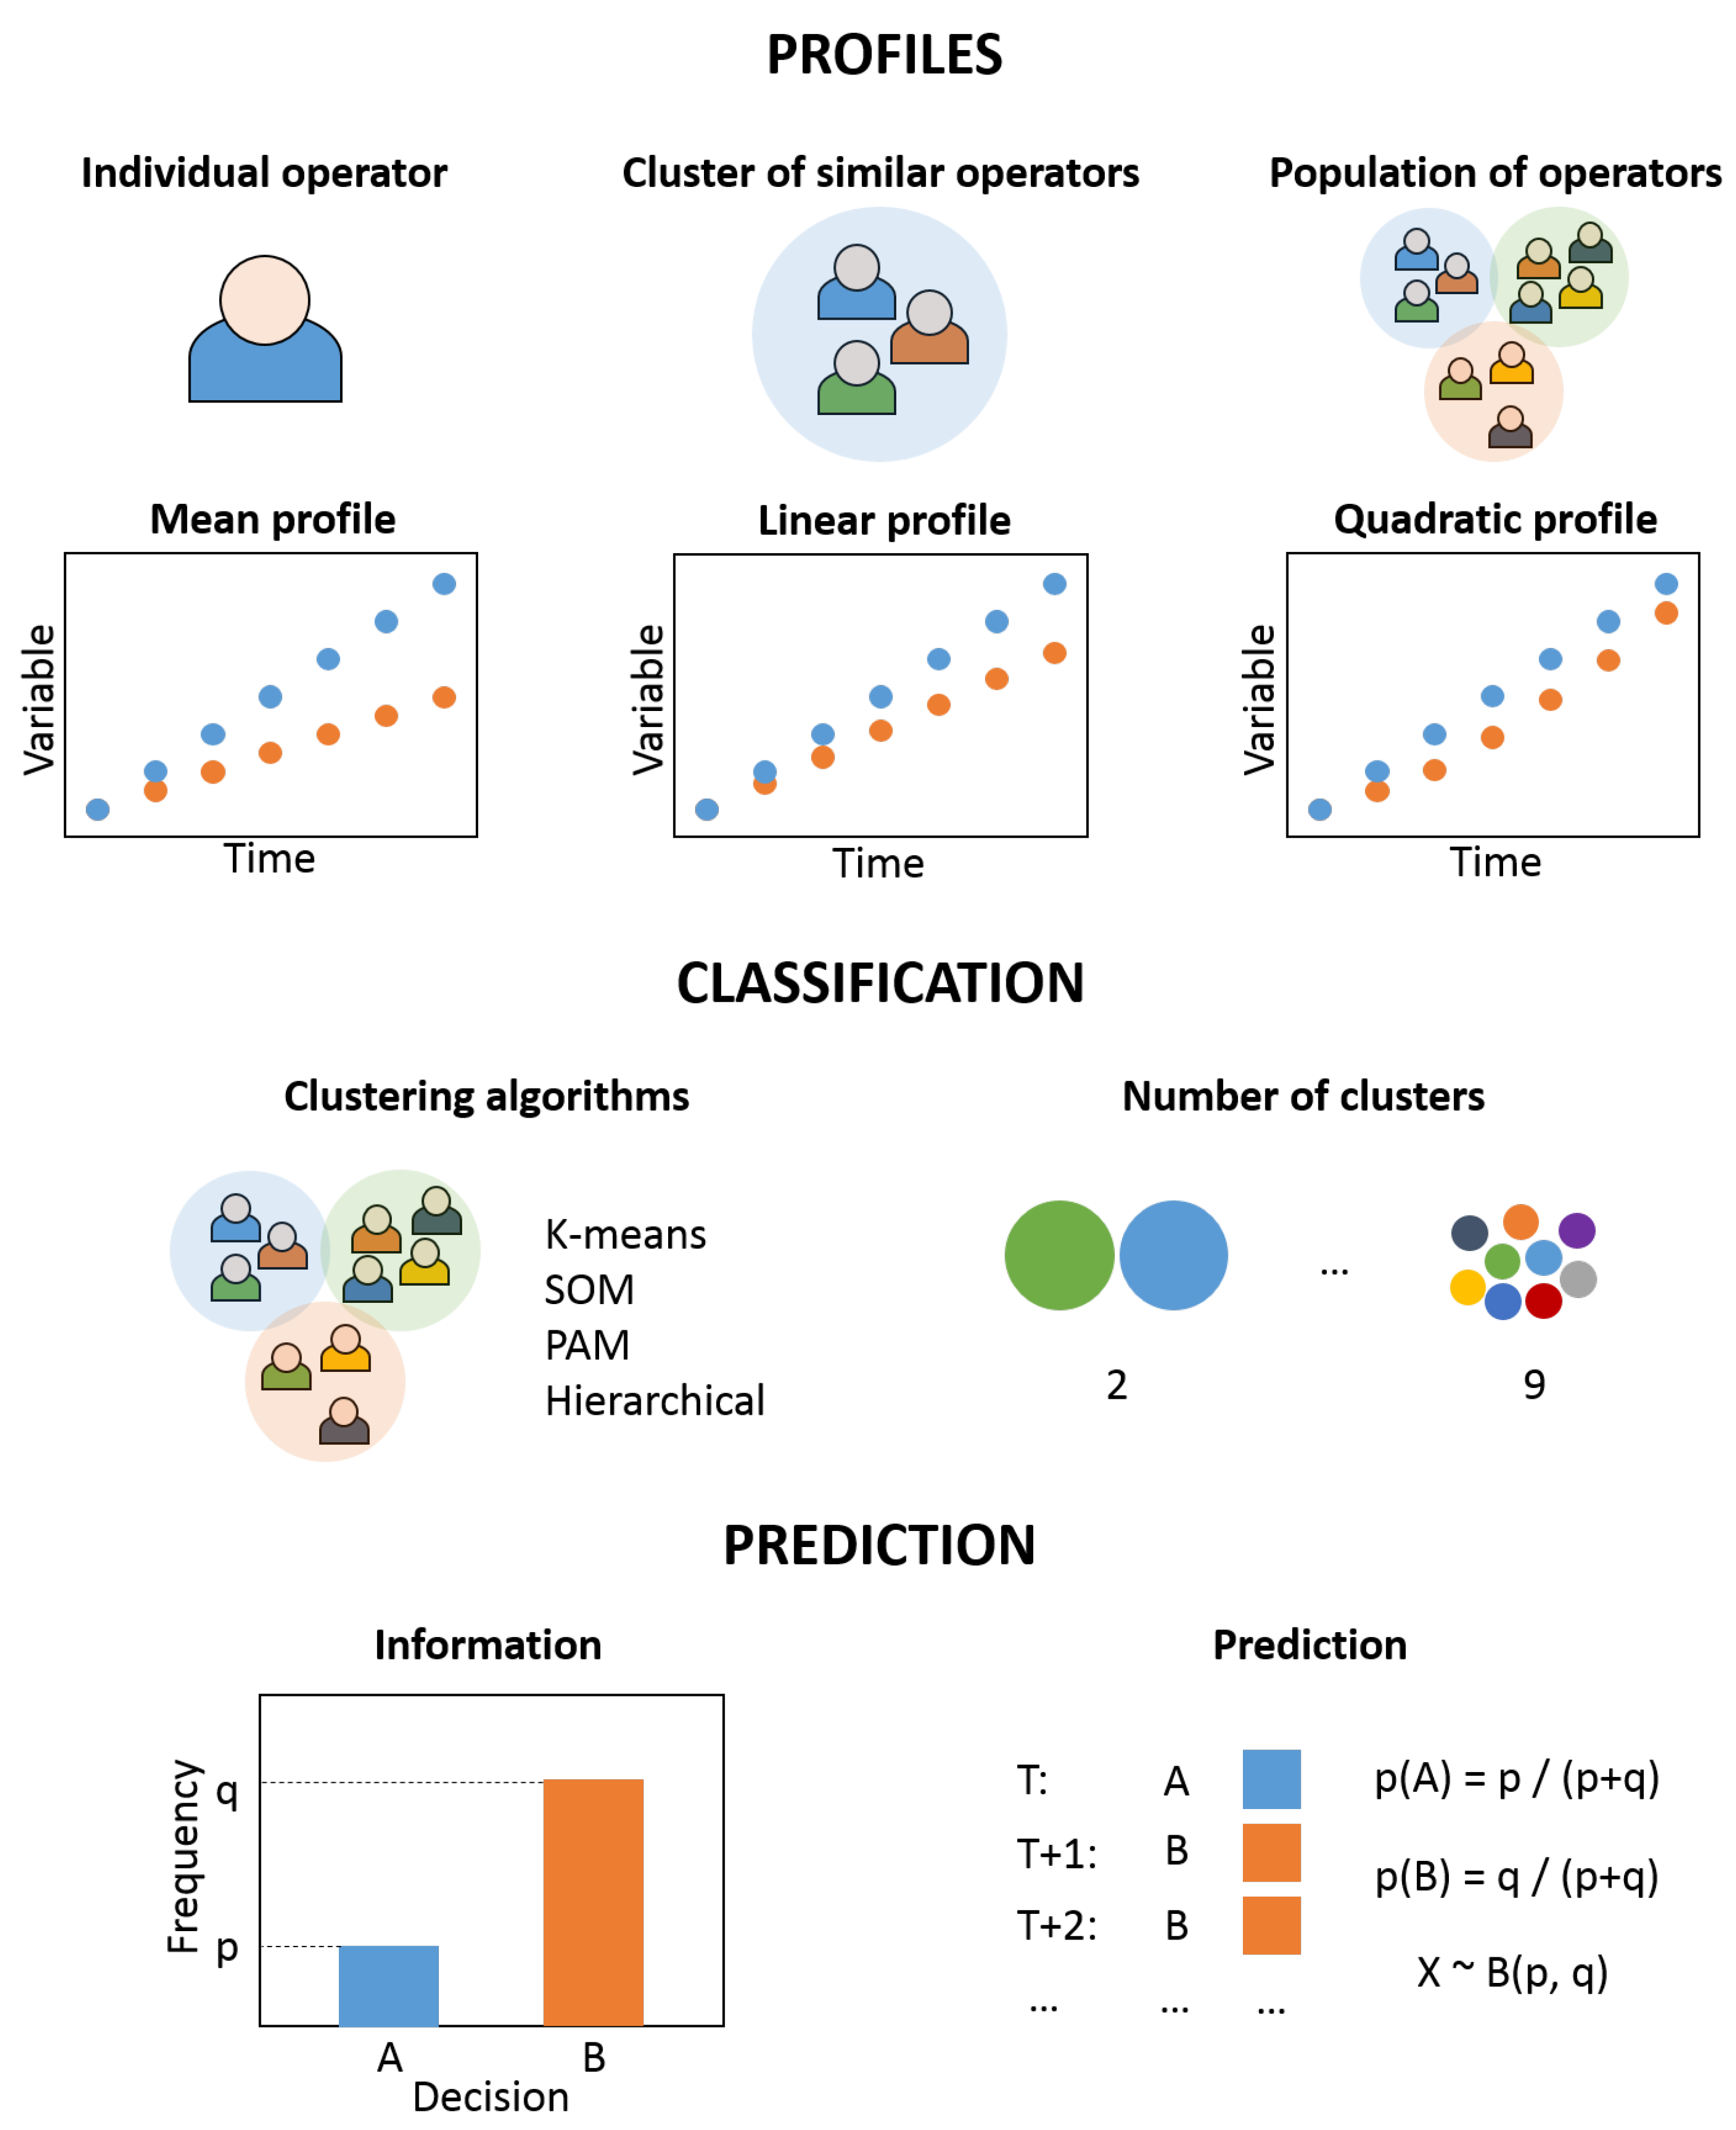
As shown in
Figure 1, this study includes the classification of the operators (players) according to their behavior during the missions (games), as well as the prediction of the operators’ strategies in a certain mission based on the previously obtained data.
This work aims to answer the following research questions:
Is there a trend in multi-robot operators’ behaviors?
Can we find groups of operators according to their behaviors?
Is it possible to predict the actions of operators?
Can we improve multi-robot interfaces by modeling operators?
The rest of this paper is organized as follows:
Section 2 analyzes the background of the work.
Section 3 describes the serious game developed to generate relevant data.
Section 4 addresses the data analysis with classification and prediction techniques. Finally,
Section 5 summarizes the main conclusions of the work.
2. Background
As pointed out above, this work aims to study operators in order to be able to improve current interfaces in multi-robot missions. Yanco et al. [
9] analyzed the human–robot interaction in the Defense Advanced Research Projects Agency (DARPA) Robotics Challenge, where eight teams with different numbers of operators using various types of interfaces controlled humanoid robots in a complex mission. As a conclusion, they recommend reducing the number of operators, developing more integrated and immersive interfaces, decreasing the required interactions between operators and robots, and adapting the interfaces to the intended users. In [
10], Cummings et al. studied the capacity of operators to supervise multiple robots, concluding that there is an optimal number of agents depending on the mission: while too few imply a lack of resources to accomplish the task, too many robots might present an excessive workload for operators.
As also noted, multiple-robots-single-operator scenarios imply some challenges related to workload, situational awareness, stress, and trust. Some of the most promising strategies to address these issues involve the development of adaptive interfaces: selection of relevant information, adaptation to operator preferences, and guidance of operator attention [
11]. In previous works, the positive impact of immersion and prediction on operator workload, situational awareness, and performance was demonstrated in a mission with multiple drones [
6] and another mission with ground, aerial, and manipulator robots [
12].
In order to perform this study, a serious game has been developed, taking as reference real multi-robot missions. Serious games are created for other purposes than entertainment, such as training and learning [
13], evaluating systems or processes [
14], and collecting massive amounts of behavioral data [
15]. The latter application is closely related to this work since the objective is to gather a complete and relevant set of data from operators. Serious games have been used in robotics, among other things, for studying the mission planning problem with multiple unmanned aerial vehicles (UAVs) [
16], analyzing human–robot interactions in collaborative tasks [
17], and training operators for laparoscopic surgeries [
18]. Therefore, these kinds of games can be a suitable tool to analyze the behavior of humans when controlling robots. The aforementioned works have been taken as references to develop the videogame based on multi-robot missions.
Two aspects are especially relevant for this work: classification, addressed in
Section 2.1, and prediction, tackled in
Section 2.2.
2.1. Classification
Cluster analysis is aimed at grouping objects such that those in the same group are more similar than those in other groups [
19]. This technique is commonly used in unsupervised learning since it allows one to automatically classify unlabeled data. Clustering is a well-known resource that has been widely applied in diverse fields such as biology [
20], social sciences [
21], medicine [
22], and computer science [
23]. The proposal of this work is to apply clustering techniques to classify people according to their behavior. This kind of application is relatively common in psychology [
24], but there are also cases in robot missions [
25,
26,
27]. The main contribution of the present work against these latter ones is that it applies operator profiles to predict future behaviors, instead of analyzing processes and operator performance.
There are multiple types of clustering algorithms according to their work and application [
28]:
K-means (KM) [
29]: This is the most common centroid-based clustering algorithm and allows one to classify
N observations with
D dimensions into
K clusters, in such a way that each observation belongs to the cluster with the nearest mean. Although the problem is computationally hard (NP-hard), there are efficient heuristic algorithms to solve it. Most of the proposed K-means algorithms initialize the centroids with a certain criterion and perform two steps iteratively, namely assignment and update. The assignment step involves the classification of observations into clusters defined by their centroids, whereas in the update stage, the clusters’ centroids are recomputed by calculating the mean of the observations within a group. The algorithm converges if there are no significant changes between iterations, but the optimality of the solution is not ensured.
Self-Organizing Maps (SOM) [
30]: This technique is based on an unsupervised neural network that is trained to produce a low-dimensional, discretized representation of the observation space. The algorithm has two modes: training and mapping. Training involves the generation of maps from the inputs by using competitive learning, while mapping refers to the classification of new inputs by means of the obtained maps. Two relevant parameters to be considered are the initialization method and the distance metric for the optimization.
Partition Around Medoids (PAM) [
31]: This is a centroid-based clustering similar to K-means, but it uses medoids instead of mean values as centers for clusters. Medoids are representative points of clusters, so the differences between observations and medoids of clusters are minimal. In contrast to means, medoids must be observations, which is useful when a mean value cannot be defined or does not represent observations. The algorithm is similar to K-means, initializing medoids with a certain pattern and making iterations of assignment and update steps.
Hierarchical (H) [
32]: This technique iteratively builds the clusters by combining similar observations (agglomerative) or separating dissimilar ones (divisive). For this purpose, two parameters are defined: metric and linkage criteria. The metric is required to compute the distances between observations and has an impact on the shapes of clusters, whereas the linkage criterion is used to compute the distances between the observation sets as a function of the distances between observation pairs.
Multiple methods exist to evaluate the quality of the clustering algorithm:
Calinski–Harabasz (CH) [
33]: As shown by Equation (
1), this is defined as the division between the overall intercluster and intracluster variances (
and
), multiplied by a factor that depends on the number of observations,
N, and clusters,
K. The higher the CH metric, the higher the quality of a set of clusters.
Davies–Bouldin (DB) [
34]: This criterion is described by Equation (
2), where
K is the number of clusters,
is the average distance from every point in the cluster
i to its centroid,
is the average distance from every point in the cluster
j to its centroid, and
is the distance between the centroids of both clusters. In contrast to CH, the lower the DB metric, the higher the quality of the clusters.
Silhouette (S) [
35]: As shown by Equation (
3), the silhouette of a point is a function of the average distance from this point to those in the same cluster (
) and to those in other clusters (
). The higher the sum of all points’ silhouettes, the higher the quality of the clusters.
2.2. Prediction
A prediction is a statement of a future event based on previous knowledge. This definition can be formulated as shown in Equation (
4), which estimates the value of the variable
V at time
through its values at the previous times
.
Probability distributions provide the likelihood of occurrence of a possible outcome in the experiments. There are two types of probability distributions: discrete and continuous. While the former present a finite set of possible outcomes and are represented by probability mass functions, continuous probability distributions can output values in continuous ranges and are represented by probability density functions. Therefore, the adequate probability distribution depends on the possible values of the outcomes. A list of the most common probability distributions obtained from [
36] is reproduced below:
Uniform (): This is a continuous probability distribution that assigns equal probability to all the values of x between a and b.
Normal/Gaussian (): This is a continuous probability distribution that has two parameters: a mean that defines its location and a variance that defines its scale. It is widely used because many variables in nature and society are distributed normally or can be approximated to a normal distribution.
Student’s t (): This is a continuous probability distribution that has three parameters: mean , precision , and degrees of freedom .
Binomial (): This is a discrete probability distribution that estimates the number of successes in a set of experiments with two possible outcomes as a function of the number of experiments n and the success probability p.
Bernoulli (): This is a special case of the binomial distribution with a single experiment (), where the probability of success is p and the probability of failure is .
3. Experiments
In this work, a videogame for mobile devices is proposed to study multi-robot operators. Why a videogame instead of a simulator? The reasons for this choice are threefold. First, a game can be designed to reproduce multi-robot missions with reduced complexity by avoiding unnecessary details, thus bringing down the experimentation costs. Second, a game for mobile devices can facilitate the dissemination of the study and, therefore, increase the amount of available data. Finally, a competitive game can motivate users to play more times and pay more attention during the game, producing data of higher quality.
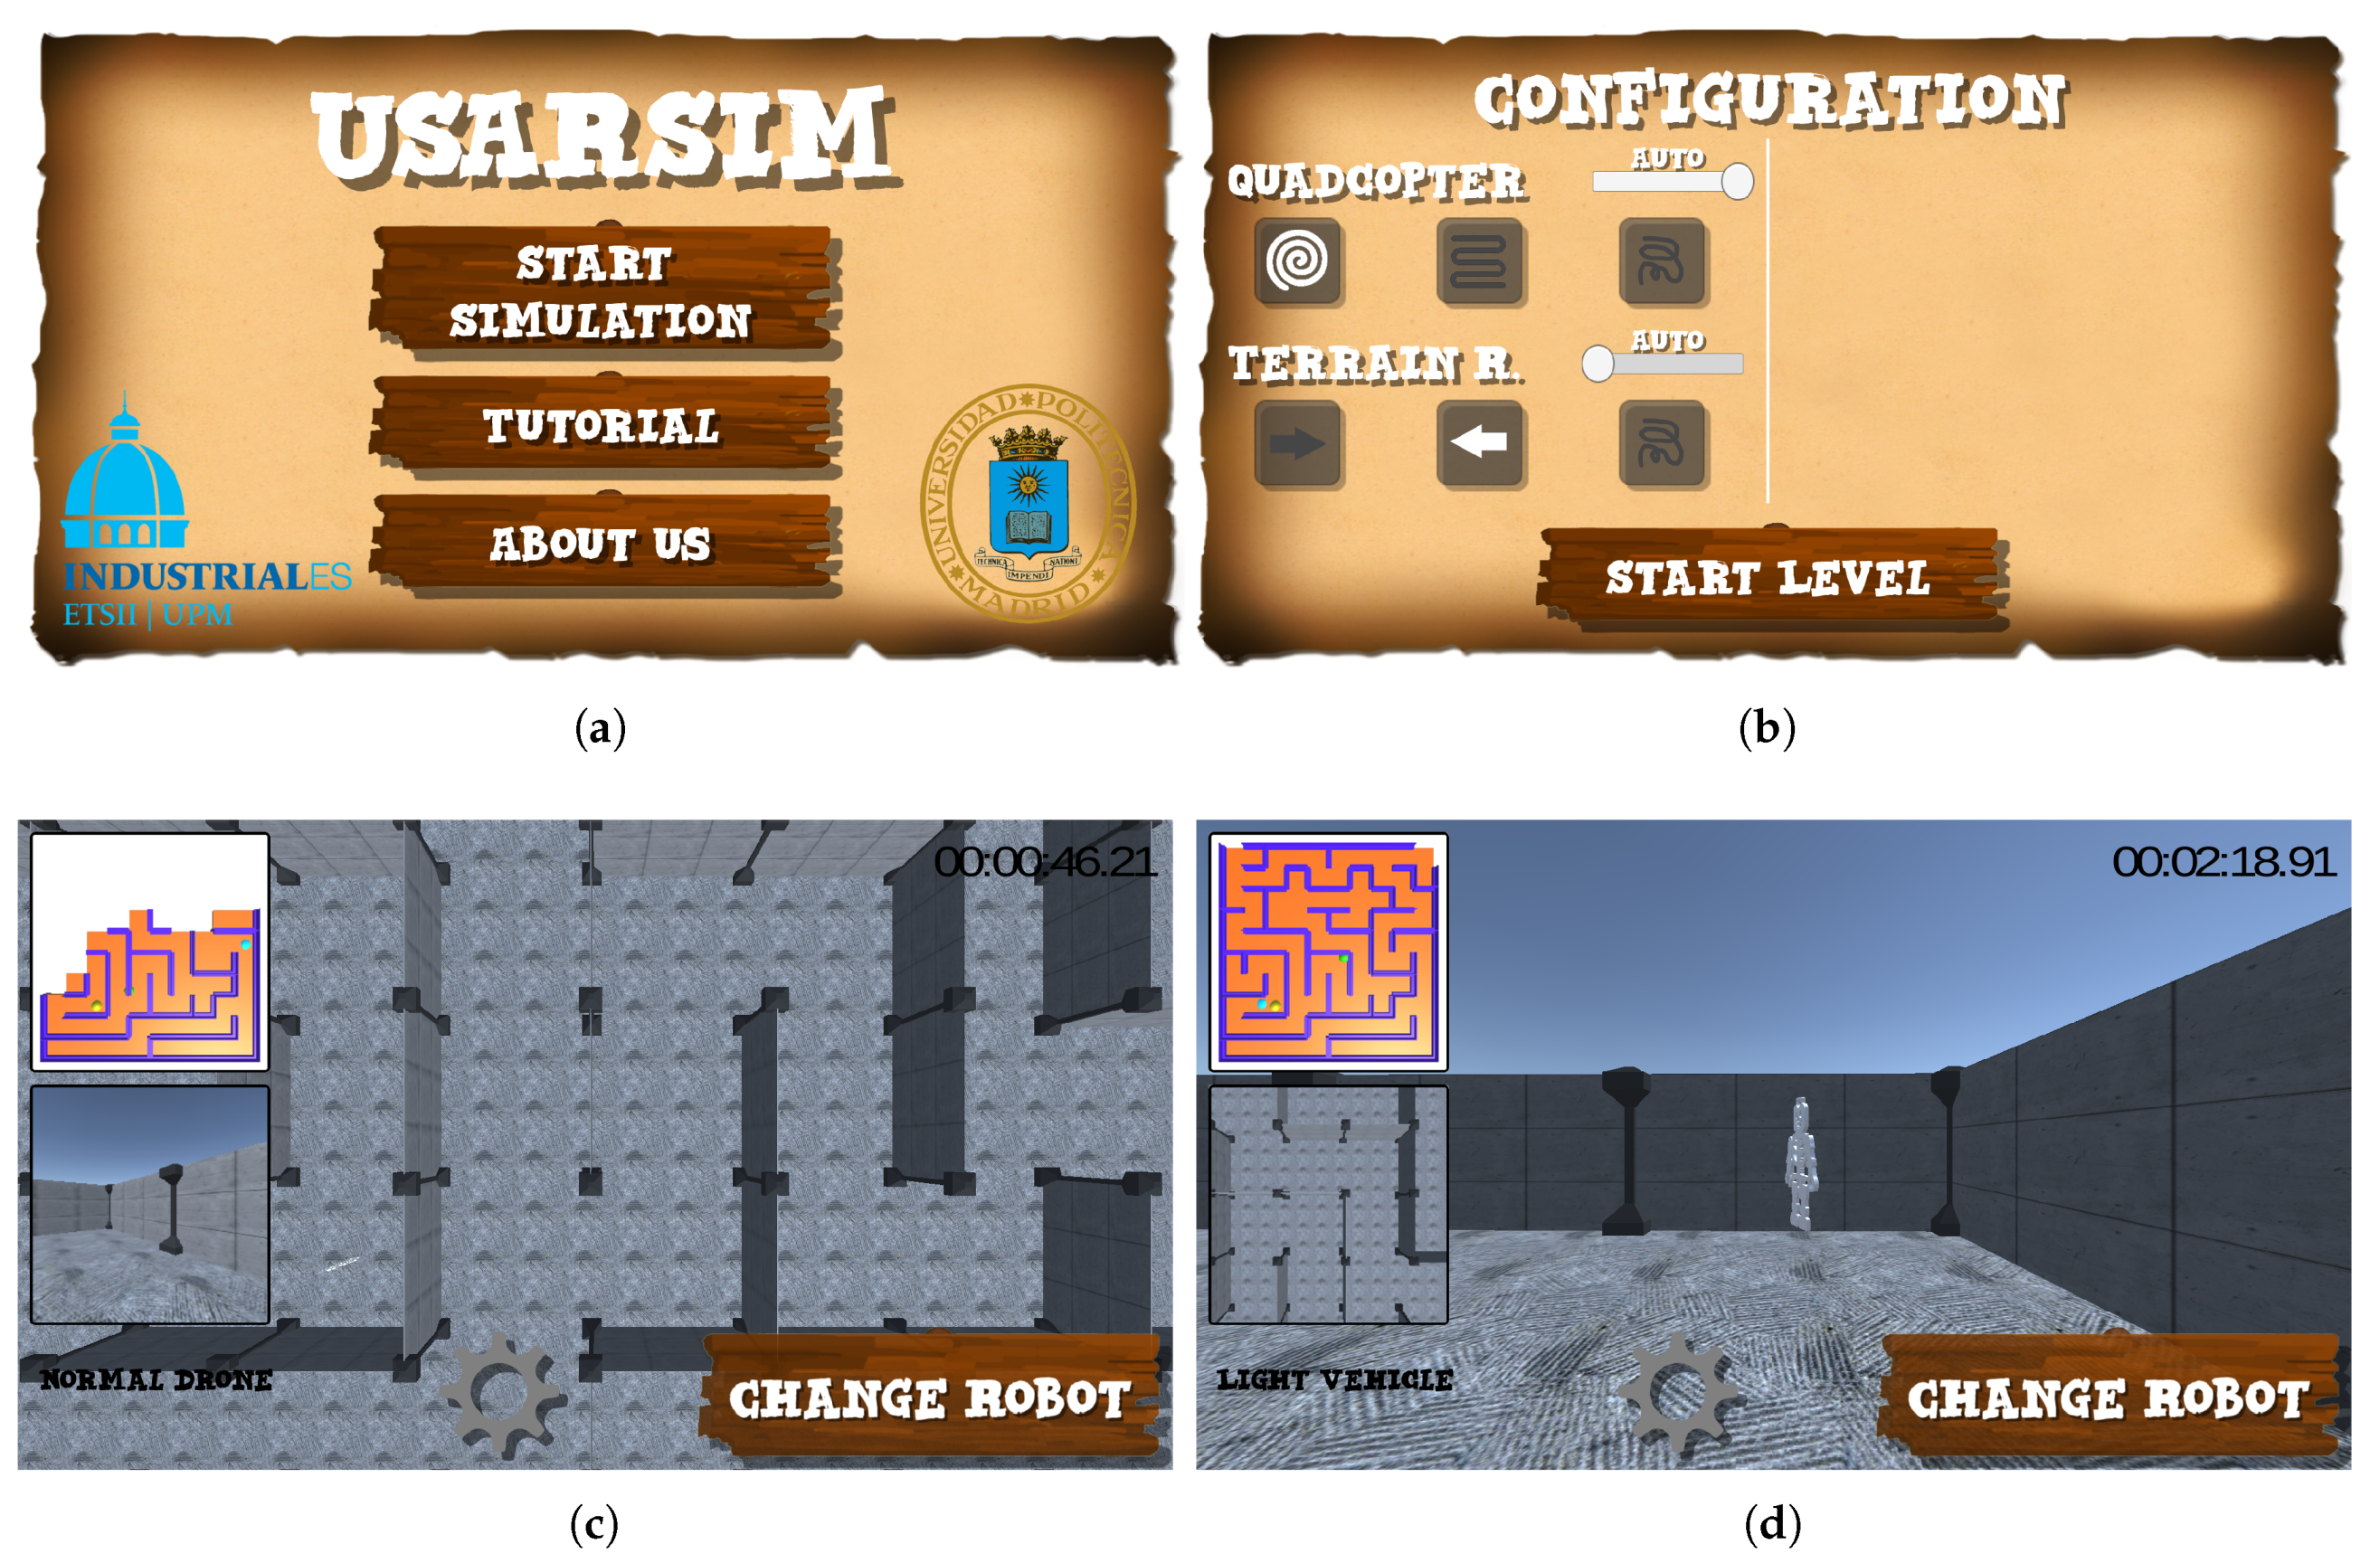
The developed game is dubbed USARSIM, since it reproduces an urban search and rescue (USAR) mission [
37]. It was designed looking for a compromise between a videogame (to be played by the general public) and a simulator (to make conclusions about robot missions). For this reason, it combines elements from robot missions (e.g., definition of plans, robot control, and use of cameras) and features common in videogames (e.g., rewards and penalties, tracking of the score, and mazes). The videogame can be downloaded from
https://play.google.com/store/apps/details?id=com.VDMS.USARSim, and a video demonstrating a real gameplay of the videogame can be found through
https://youtu.be/eU1PY2QZuSs.
Figure 2 visualizes screenshots of the game.
In USARSIM, the player has to use two robots (drone and rover) to search for victims in a maze. To this end, multiple strategies can be defined by the user before the game starts: (1) selection of which robot to control manually (the other robot will autonomously follow a certain pattern); (2a) selection of the drone’s behavior, which can explore either by moving back and forth or by following a spiral trajectory; (2b) selection of the rover’s behavior to either follow the left or the right wall of the maze. During the game, the player watches the camera of the selected robot, the currently explored map, and a miniature of the camera view of the other robot.
The game has four levels with different features: level 1 uses a standard drone and rover; level 2 employs a light rover that is faster; in level 3 a heavy rover that can break the walls is featured; and level 4 offers a “magic” rover that not only is faster but can also break through walls. The design of these levels aims to reproduce the variability in real USAR missions.
4. Analysis
A total of 136,858 events in 259 levels of 72 games developed by 21 players were collected during one month. This data was split into training and test sets (80% and 20%, respectively) in order to develop and validate the algorithms. Tactical, technical, and performance data was stored in logs by the game server.
The analysis is split into three steps: definition of profiles (
Section 4.1), classification of operators (
Section 4.2), and prediction of preferences (
Section 4.3).
4.1. Definition of Profiles
In the context of this work, a profile is a set of features that define the style of a player, whereas a variable is each one of these features. It must be noted that the profiles and variables can be used not only to describe a player, but also to describe a level of the game.
The profiles are defined through ten variables related to the tactics, technique, and performance of the operators. These variables must be bounded between 0 and 1 to facilitate later study, since they have to be compared with each other in the following steps of the analysis. Some of the variables extend a continuous range of values between 0 and 1, such as the selection of autonomous/manual robot, whereas others must be split into two variables (e.g., the displacement strategies for drone and rover) or normalized (e.g., games and scores). The ten variables of study considered in the profiles are described below:
Number of games: Ratio between the number of games played by a given player and the number of games played by the player who played the most. Therefore, the frequent players will have values close to 1, and the infrequent ones close to 0.
Auto. Rover/Drone: This defines the robot that is acting autonomously from 0 (the rover is always autonomous) to 1 (the drone is always autonomous).
Drone Random/Strategy: This indicates whether the drone is moving randomly (0), following a strategy (1), or a balance between these. This latter situation occurs when there are strategy changes during the game or when multiple games are considered.
Drone Spiral/Scan: This indicates whether the drone is following a spiral path (0), a back and forth path (1), or a balance between them. Again, this latter situation occurs when there are strategy changes during the game or when multiple games are considered.
Rover Random/Strategy: This indicates whether the rover is moving randomly (0), following a strategy (1), or a balance between these. Again, this latter situation occurs when there are strategy changes during the game or when multiple games are considered.
Rover Left/Right: This indicates whether the drone is following the left walls (0), right walls (1), or a balance between them. Again, this latter situation occurs when there are strategy changes during the game or when multiple games are considered.
Strategy changes: This shows the number of strategy changes of a player divided by the maximum number of strategy changes for all players, where 0 means that the player did not change their strategy, and 1 means that this player was the one who changed their strategy the most.
Number of touches: Ratio between the number of times the user touched the screen and the maximum number of touches for all players, computed in the same way as the strategy changes variable.
Wall crashes: Ratio between the number of collisions with walls by a player and the maximum number of collisions with walls by all players.
Score: Ratio between the total time needed by a player to complete the mission and the worst time for completing the mission for all players, which is computed in the same way than the previous variables.
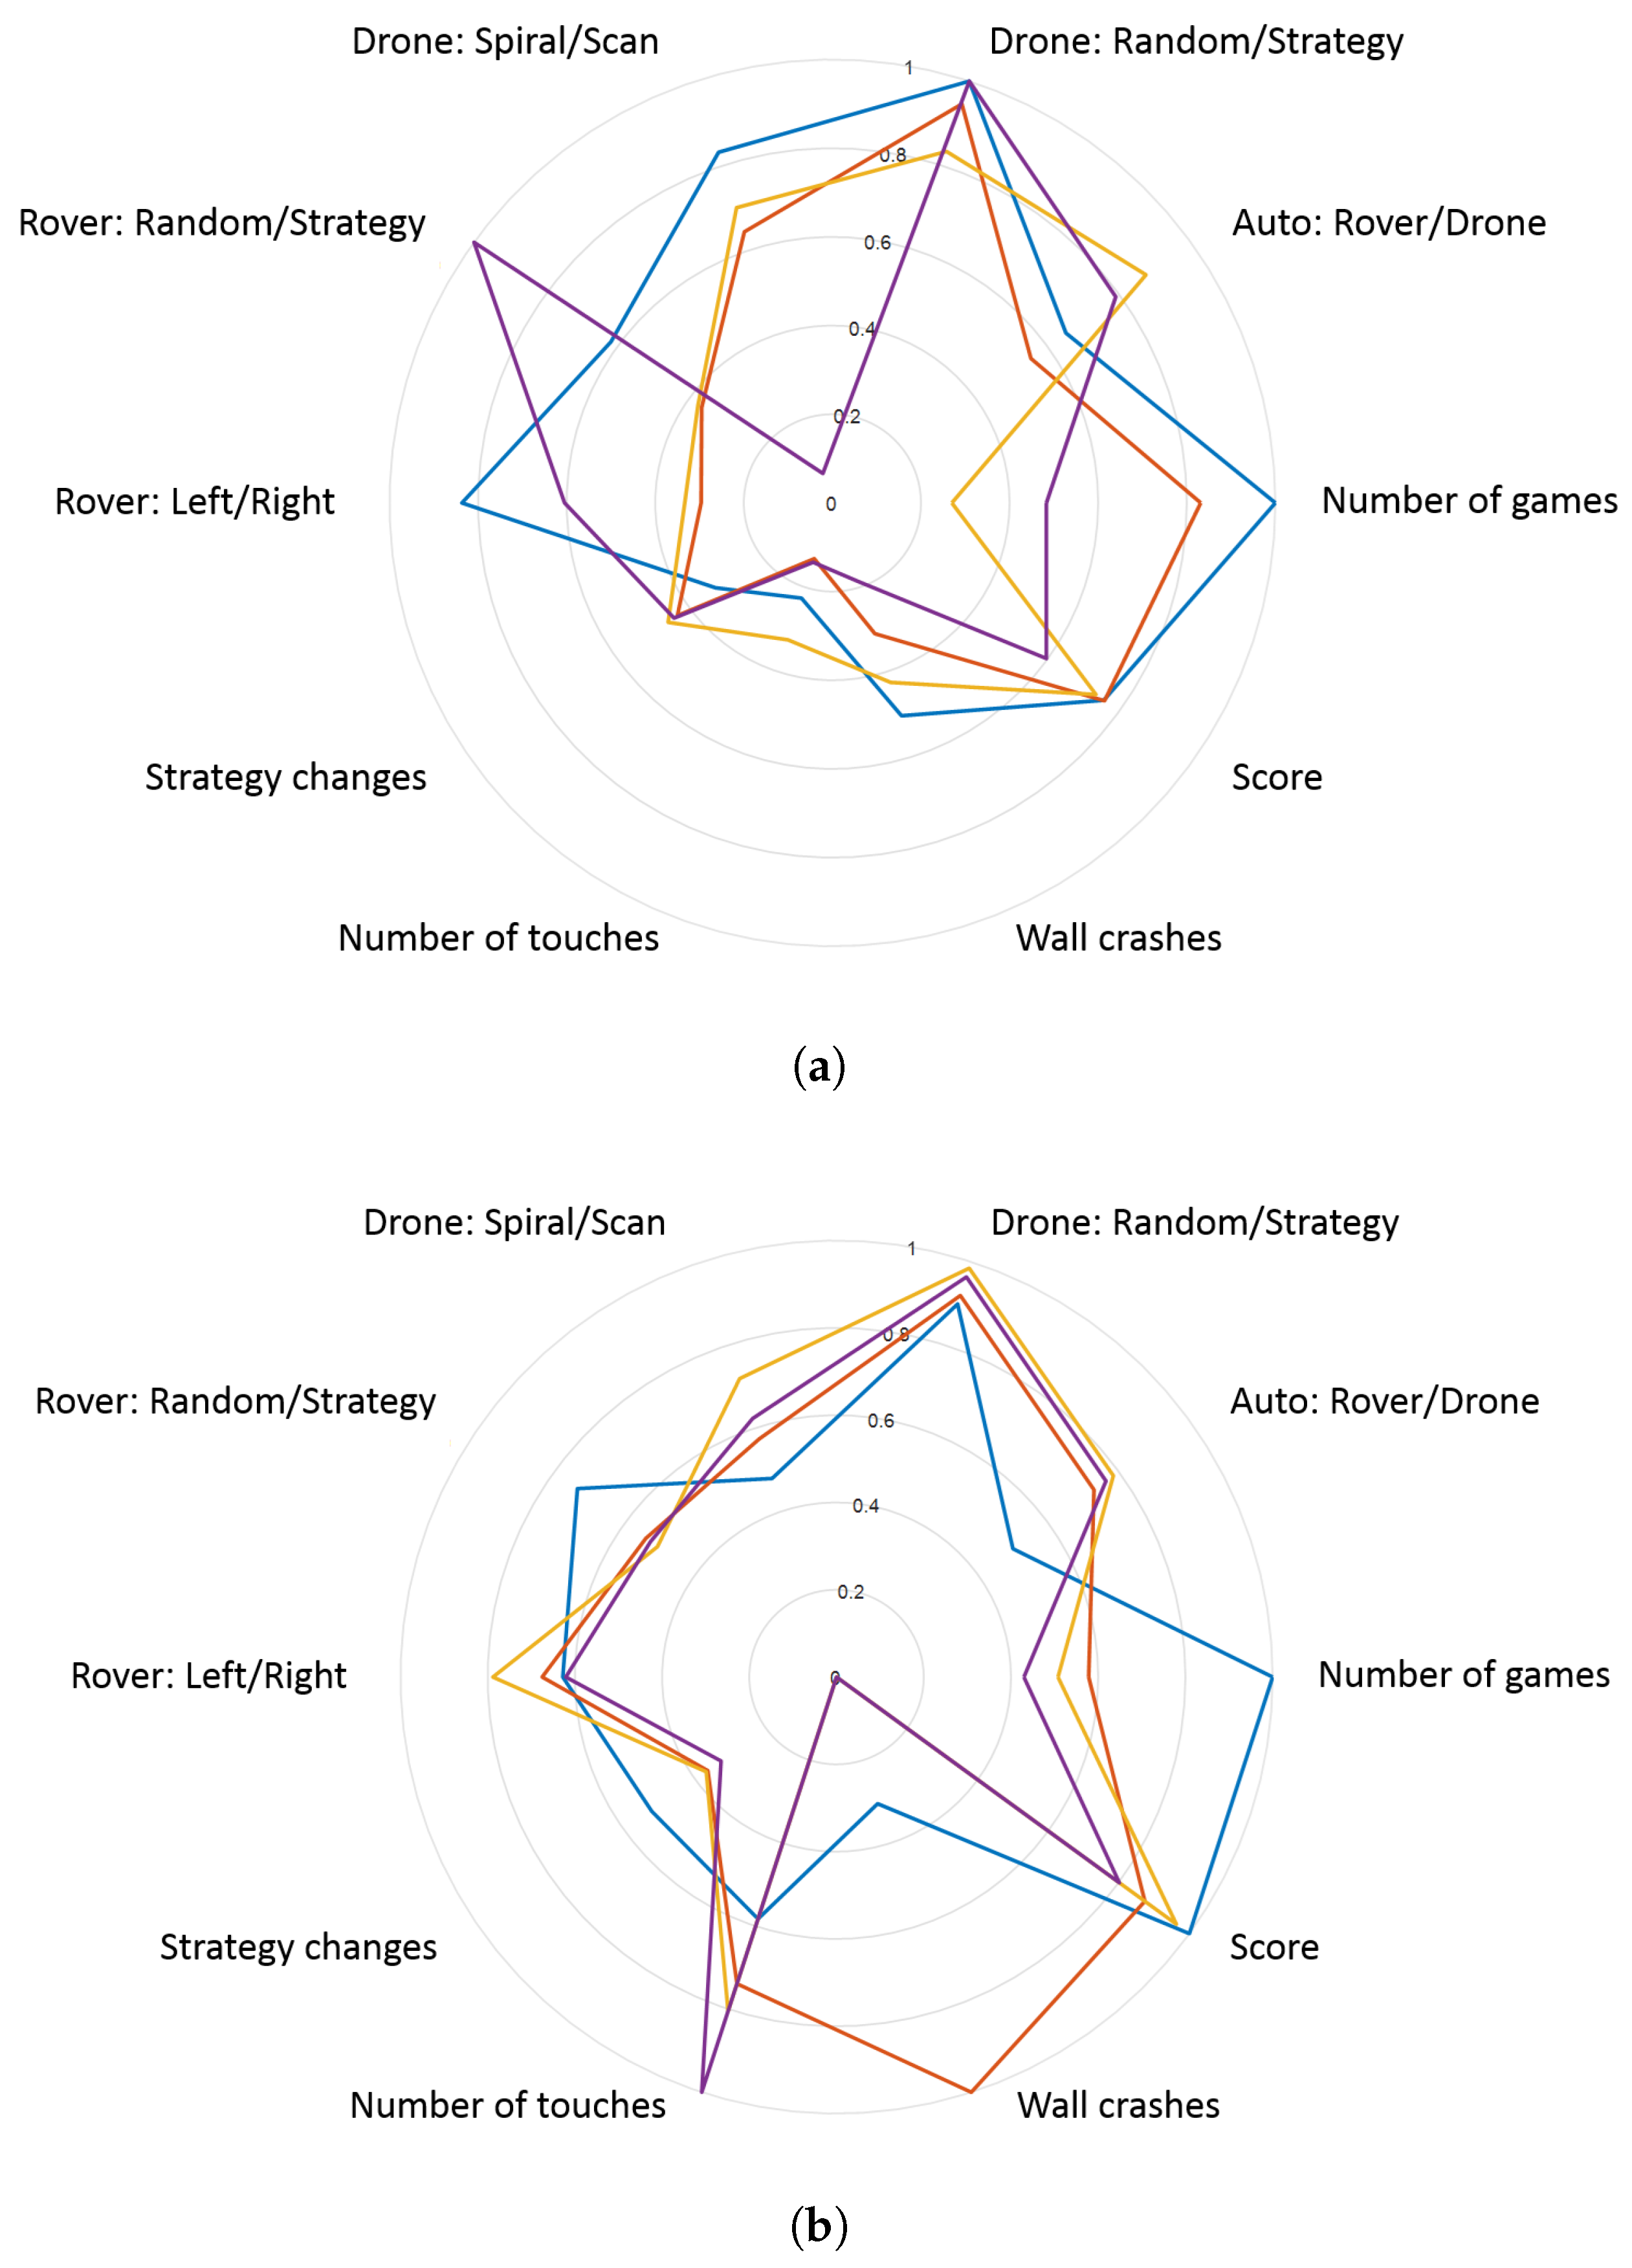
Figure 3 shows the average profiles computed for the four top players and the four levels of the game. These graphics reveal that there are differences between the different players and levels in multiple variables of profiles. For instance, the most relevant differences between players belong to game strategy (configuration of drone and rover), whereas the most important differences between levels are related to playing style (touches and wall crashes).
The variability of the profiles was studied to determine if the differences in their variables can be explained by operators, missions, or both factors.
Table 1 shows the standard deviations of these variables for players and levels. As shown in the data, players present more variability than levels in all the variables except wall crashes. This exception can be explained because there are two levels where the walls can be broken, whereas in the two remaining levels this is not possible.
The overall standard deviation, obtained by computing the mean of the trace of the covariance matrix [
38], demonstrates that players have more variability than levels. The difference between the means of players and levels is significant, according to a
t-test (
) and an analysis of variance (ANOVA) (
,
) performed with a significance level of
.
Additionally, the evolution of profiles as a function of time was studied to find the best information to make predictions. As shown in
Figure 4, the values of variables oscillate throughout games, thus rendering such information not useful for making predictions. Therefore, three profiles were computed taking into account not only the last but also the previous data: mean (Equation (
5)), linear (Equation (
6)) and quadratic (Equation (
7)). Each one of these profiles makes the evolution smoother and gives more relevance to recent values.
Moreover, given an individual operator controlling a multi-robot mission, a profile may contain (1) the previous actions of this operator, (2) the actions of a cluster of similar operators, or (3) those of the whole population of operators. In the first case, the data is more adapted to the particular operator, but it may not be enough to make accurate predictions. In the latter case, all the information is available to make predictions, but it may be too general to produce correct predictions for particular operators. The second case is explained in
Section 4.2 and can be considered as a compromise to meet both required information and precision criteria.
4.2. Classification of Operators
The classification of operators is performed taking into account their tactics (the selection strategy done before the mission), techniques (the actions taken during the mission), and performance (the achieved scores). The four clustering techniques described in
Section 2—K-means (KM), self-organizing maps (SOM), partition around medoids (PAM), and hierarchical (H)—are applied to find between 2 and 9 clusters in every case. These clusters are evaluated by means of the metrics presented in
Section 2— Calinski–Harabasz (CH), Davies–Bouldin (DB), and Silhouette (S)—and a global metric computed from CH, DB, and S through Equations (
8) and (
9). Equation (
8) obtains the global metric
G of cluster
through a weighted sum of the
metrics for cluster
. Equation (
9) defines the weight
for each variable
by multiplying the average values of the rest of the variables
in all of the clusters
. In this manner, the metrics are normalized and their differences compensated.
All of these clustering techniques and evaluation criteria were implemented in MATLAB R2017a, in order to simplify the preparation of data, integration of clustering and prediction algorithms, and analysis of results.
Table 2 summarizes the results of operator classification and cluster evaluation. The best score is obtained by the PAM algorithm for all methods (mean, linear, and quadratic), followed by SOM, K-means, and hierarchical. Regarding the number of clusters, the best scores depend on the specific algorithm and dataset, but they are obtained by considering from 6 to 9 clusters. Therefore, the results provided by the PAM algorithm with 9 clusters are used hereinafter.
4.3. Prediction of Preferences
The prediction of operator preferences is performed by considering different data (previous data of the specific operator, cluster of similar operators, and the whole population of operators) and methods (considering simple and weighted means of previous data). As the variables of this study range from 0 to 1, the predictions are performed by building Bernoulli distributions from the three types of profiles computed by means of three methods (mean, linear, and quadratic). The predictions are performed with the training set, which contains 80% of samples, and validated with test set, which contains the other 20%, and each of them is repeated a hundred times to generate significant results.
Table 3 shows the results of the predictions with different configurations. Note that the best result is obtained by using clusters of similar operators and linear profiles. The predictions that leverage clusters of operators clearly dominate the predictions employing individuals and population. Moreover, predictions that rely on linear profiles slightly outperform those that use mean and quadratic profiles. The success rate of the best result is 65.77% (27.56% better than random prediction), whereas the success rate of the average result is 61.45% (18.54% better than random prediction).
Table 4 shows these results splitting the players into infrequent (those that played less than or exactly 10 games) and frequent (those that played more than 10 games). This table shows that using clusters of similar operators is the best option to predict the preferences of infrequent operators, reaching 66.52% success versus 57.11% with individuals and 60.50% with population. Nevertheless, the results are different with frequent operators: 63.04% with individuals, 61.63% with clusters, and 59.39% with population.
4.4. Discussion
Going back to the research questions asked at the beginning of this paper, the study has provided enough information to answer them. The first question asks whether there is a trend in the behavior of multi-robot operators. The analysis performed with the game data demonstrates that players have different styles and show more variability than levels. This connects to the second question: “Can we find groups of operators according to their behaviors?” The clusters obtained in this work group operators that have similar tactics, techniques, and performances, and separate those that present differences in those variables. The third question is whether it is possible to predict the actions of operators. The predictions performed with previous data are 19% better than random, whereas the predictions performed with operator clusters and linear profiles are 28% better than random ones. Therefore, we can affirm that classifying the operators and predicting their preferences is suitable in the context of multi-robot missions. The final question is more open: “Can we improve multi-robot interfaces by modeling operators?” This work demonstrates that operators have different styles and that their preferences can be predicted using this data. This study can be a first step toward developing interfaces that can adapt the displayed information and available commands to every operator.
5. Conclusions
The modeling of the behavior of multi-robot operators during a simulated search and rescue mission has been carried out. This study helps to prove that it is possible to have an adequate prediction of their preferences during the mission, which can be very useful for the development of an adaptive interface.
To obtain the models and predictions, a systematic methodology consisting of three steps was used: first, the definition of profiles, then the classification of operators, and finally, the prediction of their preferences. The data was obtained during a set of extensive experiments performed by means of a multi-robot search and rescue videogame and then processed using the aforementioned methodology.
The results demonstrate that predictions based on the previously collected data increase the probability of success by 19% when compared to a random. Additionally, the use of clusters of similar operators is useful to deal with the lack of information on specific operators, whereas leveraging linear profiles improves the robustness of predictions as they give more relevance to recent data. The combination of both methods enables a 28% increase in the ratio of success.
However, these results also reveal some limitations of this work and challenges for future ones. First, there are some factors that are not related to operators and have an influence on the profiles, such as the mission itself and the capabilities of the robots. Although the analysis shows that variability is less relevant across levels than across players, the levels produce disturbances in some variables of the players. The second challenge is related to changes in tactics, techniques, and performance due to the learning curve of missions: some players modify their preferences along different tries.
In future work, we are going to apply the methodologies developed with the videogame to real multi-robot missions. The project aims to develop an interface that combines the immersion of operators in missions with the prediction of their preferences and automatic configuration of displays and controls.
Author Contributions
J.J.R. conceived the idea, performed the data analysis, coordinated the work, and wrote the paper; V.D.-M. developed the videogame; J.R. implemented the clustering algorithms; P.R.P. reviewed the structure and language, J.V. and M.G. helped to improve the statistical study and the description of the paper, and A.B. give advice during the work.
Funding
This research was funded by SAVIER (Situational Awareness VIrtual EnviRonment) Project of Airbus Defence & Space; RoboCity2030-DIH-CM, Madrid Robotics Digital Innovation Hub, S2018/NMT-4331, funded by “Programas de Actividades I+D en la Comunidad de Madrid” and co-funded by Structural Funds of the EU; and DPI2014-56985-R project (Protección robotizada de infraestructuras críticas) funded by the Ministerio de Economía y Competitividad of Gobierno de España.
Conflicts of Interest
The authors declare no conflict of interest.
Abbreviations
The following abbreviations are used in this manuscript:
| CH | Calinski–Harabasz |
| DARPA | Defense Advanced Research Projects Agency |
| DB | Davies–Bouldin |
| H | Hierarchical |
| KM | K-means |
| S | Silhouette |
| SOM | Self-organizing maps |
| PAM | Partition around medoids |
| UAV | Unmanned aerial vehicle |
| USAR | Urban search and rescue |
References
- Wong, C.Y.; Seet, G. Workload, awareness and automation in multiple-robot supervision. Int. J. Adv. Robot. Syst. 2017, 14. [Google Scholar] [CrossRef] [Green Version]
- Lysaght, R.J.; Hill, S.G.; Dick, A.O.; Plamondon, B.D.; Linton, P.M. Operator Workload: Comprehensive Review and Evaluation of Operator Workload Methodologies (No. TR-2075-3); Analytics Inc.: Willow Grove, PA, USA, 1989. [Google Scholar]
- Moray, N. Mental Workload: Its Theory and Measurement; Springer Science & Business Media: Berlin/Heidelberg, Germany, 2013; Volume 8. [Google Scholar]
- Hart, S.G.; Staveland, L.E. Development of NASA-TLX (Task Load Index): Results of empirical and theoretical research. Adv. Psychol. 1988, 52, 139–183. [Google Scholar]
- Endsley, M.R. Design and evaluation for situation awareness enhancement. In Proceedings of the Human Factors Society Annual Meeting; SAGE Publications: Los Angeles, CA, USA, 1988; Volume 32, pp. 97–101. [Google Scholar]
- Roldán, J.J.; Peña-Tapia, E.; Martín-Barrio, A.; Olivares-Méndez, M.A.; Del Cerro, J.; Barrientos, A. Multi-robot interfaces and operator situational awareness: Study of the impact of immersion and prediction. Sensors 2017, 17, 1720. [Google Scholar] [CrossRef] [PubMed]
- Hou, M.; Zhu, H.; Zhou, M.; Arrabito, G.R. Optimizing operator–agent interaction in intelligent adaptive interface design: A conceptual framework. IEEE Trans. Syst. Man Cybern. Part C (Appl. Rev.) 2011, 41, 161–178. [Google Scholar] [CrossRef]
- Roldán, J.J.; Olivares-Méndez, M.A.; del Cerro, J.; Barrientos, A. Analyzing and improving multi-robot missions by using process mining. Auton. Robots 2018, 42, 1187–1205. [Google Scholar] [CrossRef]
- Yanco, H.A.; Norton, A.; Ober, W.; Shane, D.; Skinner, A.; Vice, J. Analysis of human-robot interaction at the darpa robotics challenge trials. J. Field Robot. 2015, 32, 420–444. [Google Scholar] [CrossRef]
- Cummings, M.L.; Nehme, C.E.; Crandall, J.; Mitchell, P. Predicting operator capacity for supervisory control of multiple UAVs. In Innovations in Intelligent Machines; Springer: Berlin/Heidelberg, Germany, 2007; Volume 1, pp. 11–37. [Google Scholar]
- Hocraffer, A.; Nam, C.S. A meta-analysis of human-system interfaces in unmanned aerial vehicle (UAV) swarm management. Appl. Ergon. 2017, 58, 66–80. [Google Scholar] [CrossRef]
- Roldán, J.J.; Peña-Tapia, E.; Garcia-Aunon, P.; del Cerro, J.; Barrientos, A. Bringing adaptive & immersive interfaces to real-world multi-robot scenarios: Application to surveillance and intervention in infrastructures. IEEE Access 2019. [Google Scholar] [CrossRef]
- Loh, C.S.; Sheng, Y.; Ifenthaler, D. Serious Games Analytics: Methodologies for Performance Measurement, Assessment, and Improvement; Springer International Publishing: Cham, Switzerland, 2015. [Google Scholar]
- Van Ruijven, T.W.J. Serious games as experiments for emergency management research: A review. In Proceedings of the 8th International Conference on Information Systems for Crisis Response and Management (ISCRAM 2011), Lisbon, Portugal, 8–11 May 2011. [Google Scholar]
- Wood, R.T.; Griffiths, M.D.; Eatough, V. Online data collection from video game players: Methodological issues. CyberPsychology Behav. 2004, 7, 511–518. [Google Scholar] [CrossRef]
- Rodriguez-Fernandez, V.; Ramirez-Atencia, C.; Camacho, D. A multi-uav mission planning videogame-based framework for player analysis. In Proceedings of the 2015 IEEE Congress on Evolutionary Computation (CEC), Sendai, Japan, 25–28 May 2015; pp. 1490–1497. [Google Scholar]
- Jerčić, P.; Hagelbäck, J.; Lindley, C. Physiological Affect and Performance in a Collaborative Serious Game Between Humans and an Autonomous Robot. In International Conference on Entertainment Computing; Springer: Cham, Switzerland, 2018; pp. 127–138. [Google Scholar]
- IJgosse, W.M.; van Goor, H.; Luursema, J.M. Saving robots improves laparoscopic performance: Transfer of skills from a serious game to a virtual reality simulator. Surg. Endosc. 2018, 32, 3192–3199. [Google Scholar] [CrossRef]
- Bailey, K.D. Typologies and Taxonomies: An Introduction to Classification Techniques; Sage: New York, NY, USA, 1994; Volume 102. [Google Scholar]
- Eisen, M.B.; Spellman, P.T.; Brown, P.O.; Botstein, D. Cluster analysis and display of genome-wide expression patterns. Proc. Natl. Acad. Sci. USA 1988, 95, 14863–14868. [Google Scholar] [CrossRef] [PubMed]
- Rupp, A.A.; Sweet, S.J. Analysis of Multivariate Social Science Data. 2011, pp. 686–693. Available online: https://www.tandfonline.com/doi/abs/10.1080/10705511.2011.607725?journalCode=hsem20 (accessed on 20 May 2019).
- Haldar, P.; Pavord, I.D.; Shaw, D.E.; Berry, M.A.; Thomas, M.; Brightling, C.E.; Green, R.H. Cluster analysis and clinical asthma phenotypes. Am. J. Respir. Crit. Care Med. 2008, 178, 218–224. [Google Scholar] [CrossRef] [PubMed]
- Bensaid, A.M.; Hall, L.O.; Bezdek, J.C.; Clarke, L.P. Partially supervised clustering for image segmentation. Pattern Recognit. 1996, 29, 859–871. [Google Scholar] [CrossRef]
- Billieux, J.; Thorens, G.; Khazaal, Y.; Zullino, D.; Achab, S.; Van der Linden, M. Problematic involvement in online games: A cluster analytic approach. Comput. Hum. Behav. 2015, 43, 242–250. [Google Scholar] [CrossRef]
- Rodríguez-Fernández, V.; Menéndez, H.D.; Camacho, D. A study on performance metrics and clustering methods for analyzing behavior in UAV operations. J. Intell. Fuzzy Syst. 2017, 32, 1307–1319. [Google Scholar] [CrossRef] [Green Version]
- Rodríguez-Fernández, V.; Menéndez, H.D.; Camacho, D. Automatic profile generation for uav operators using a simulation-based training environment. Prog. Artif. Intell. 2016, 5, 37–46. [Google Scholar] [CrossRef]
- Rodríguez-Fernández, V.; Menéndez, H.D.; Camacho, D. Analysing temporal performance profiles of UAV operators using time series clustering. Expert Syst. Appl. 2017, 70, 103–118. [Google Scholar] [CrossRef] [Green Version]
- Fahad, A.; Alshatri, N.; Tari, Z.; Alamri, A.; Khalil, I.; Zomaya, A.Y.; Bouras, A. A survey of clustering algorithms for big data: Taxonomy and empirical analysis. IEEE Trans. Emerg. Top. Comput. 2014, 2, 267–279. [Google Scholar] [CrossRef]
- Hartigan, J.A.; Wong, M.A. Algorithm AS 136: A k-means clustering algorithm. J. R. Stat. Soc. Ser. C (Appl. Stat.) 1979, 28, 100–108. [Google Scholar] [CrossRef]
- Kohonen, T. The self-organizing map. Proc. IEEE 1990, 78, 1464–1480. [Google Scholar] [CrossRef]
- Kaufman, L.; Rousseeuw, P.J. Partitioning around medoids (program pam). Finding Groups in Data: An Introduction to Cluster Analysis; John Wiley & Sons, Inc.: Hoboken, NJ, USA, 1990; pp. 68–125. [Google Scholar]
- Blashfield, R.K. Mixture model tests of cluster analysis: Accuracy of four agglomerative hierarchical methods. Psychol. Bull. 1976, 83, 377–388. [Google Scholar] [CrossRef]
- Calinski, T.; Harabasz, J. A dendrite method for cluster analysis. Commun. Stat.-Theory Methods 1974, 3, 1–27. [Google Scholar] [CrossRef]
- Davies, D.L.; Bouldin, D.W. A cluster separation measure. IEEE Trans. Pattern Anal. Mach. Intell. 1979, 2, 224–227. [Google Scholar] [CrossRef]
- Rousseeuw, P.J. Silhouettes: A graphical aid to the interpretation and validation of cluster analysis. J. Comput. Appl. Math. 1987, 20, 53–65. [Google Scholar] [CrossRef] [Green Version]
- Bishop, C. Pattern Recognition and Machine Learning (Information Science and Statistics); Springer: New York, NY, USA, 2007. [Google Scholar]
- Casper, J.; Murphy, R.R. Human-robot interactions during the robot-assisted urban search and rescue response at the world trade center. IEEE Trans. Syst. Man Cybern. Part B (Cybern.) 2003, 33, 367–385. [Google Scholar] [CrossRef] [PubMed]
- Peña, D. Análisis de Datos Multivariante; McGraw-Hill: Madrid, Spain, 2002; Volume 24. [Google Scholar]
© 2019 by the authors. Licensee MDPI, Basel, Switzerland. This article is an open access article distributed under the terms and conditions of the Creative Commons Attribution (CC BY) license (http://creativecommons.org/licenses/by/4.0/).

 ,
, 


