1. Introduction
Food security among the rural poor in India is tightly linked to poverty and production sustainability. Both low agricultural productivity and low income are perennial forces in the poverty cycle in India [
1,
2]. Food security comprises not only the availability of food, but of its access by vulnerable populations in adequate quantity and quality. It is also a question of whether a farmer can increase food production to meet the needs of her/his family and can do so in a sustainable manner. It is imperative for a nation like India to develop a long-term strategy that will reduce the vulnerability of the farming community and sustainably intensify agricultural productivity while minimizing the degradation of land and natural resources.
In Odisha India, 33% of the population lives in poverty [
3]. Poverty is especially prevalent among the scheduled tribes that live as smallholder farmers in the semi-arid uplands of the state, such as Kendjuhar [
4,
5]. These smallholder farmers grow primarily rice and maize in a rain-fed system with minimal nutrient input. They plow the soil multiple times before planting. The livestock resources of these smallholder farmers include cows, oxen, goats, and chickens. They also gather and extract resources from the forest. Traditionally, shifting cultivation was employed, however, over recent decades lands are under continual cultivation. The loss of forest cover, intense mining activities, tillage practices, and accelerated soil erosion have led to an unsustainable agricultural situation. As tribal people in Odisha, these smallholder farmers live off nutrient-poor agricultural land and have few opportunities for income generation. These smallholder farmers face great food insecurity.
Food security for smallholder farmers in Odisha, as well as in other parts of the world, depends upon socio-economic and environmental factors. Consequently, movement towards a solution to greater food security requires a transdisciplinary approach. Enhancing agricultural production necessitates a well-designed cropping system suited to the land, the environment, and the people who derive their livelihood from it. Sustainable agricultural systems must be based on principles that restrict land degradation, conserve natural resources, and increase food and nutritional security for the smallholder farmers. Among the many sustainable cropping systems available to smallholder farmers limited to rain-fed practices, conservation agriculture (CA) can reverse soil degradation, improve crop production, and enhance the socio-economic condition of smallholder farmers. Reduced tillage and leaving crop residue in the field improves the soil while crop diversification, intercropping and rotation can provide food, income, and nutritional security. However, smallholder farmers achieve different economic efficiencies while employing the same CA techniques [
6]. A step towards greater food security and sustainability then is to maximize technical efficiency of an adopted CA developed via a transdisciplinary approach.
Technical efficiency relates to the condition of which a farmer produces the maximum feasible output resulting from a given bundle of inputs or uses the minimum feasible amount of inputs to produce the optimum level of output [
7,
8]. Traditional productivity measures, such as yield per hectare or cost per unit of output, fail to explain observed differences among smallholder farmers practicing the same cropping system. Simple cost comparisons do not elucidate what portion of the differences is due to the inefficient use of a given input bundle nor what part is due to the incorrect choice of input ratios, i.e., the allocative efficiency. Quantitative survey data can document the amounts of non-land inputs, such as labor, seeds and fertilizers, used by farms that result in differences in yield among the smallholder farmers and aid in understanding the differences in inefficiencies among smallholder farmers.
Conservation agriculture practices have been developed and promoted to offset climate change and improve natural resource conditions in Africa and south Asia [
9]. Currently, CA is being practiced on over 125 million hectares world-wide [
10] and has studies indicating reduced production costs, improved water use efficiency, and sustained or increased crop productivity across the globe [
11,
12,
13,
14,
15]. Studies have shown that intercropping and rotation practices improve the nutritional security of the farm households and reduces the risk of total crop failure in unfavorable or erratic weather [
16]. Labor requirements can be reduced by about 50% for male-driven work of soil tillage, but CA can increase the female-driven work of weeding [
17]. However, despite the documented benefits, the broad applicability of CA around the globe remain contested [
18]. Furthermore, implementation and adoption of CA in resource poor and vulnerable smallholder farming systems face various issues and challenges, most notably the retention of crop residues due to its strong competition as livestock feed [
18]. Considering various arguments on justifying the implementation of CA, it must obviously be adapted to local agro-ecological conditions.
The goal of this study was to identify entry points for improvement of smallholder farmers’ economic livelihoods through evaluating the technical efficiency of farm communities using CA practices of reduced tillage and a maize-cowpea intercrop system. Specifically, the objectives were to: (i) evaluate the technical efficiency of CA practices of two tribal villages in Odisha, India; (ii) evaluate the determinants of production under CA; and (iii) provide recommendations on how food security for smallholder farmers can be enhanced.
2. Materials and Methods
2.1. Study Site
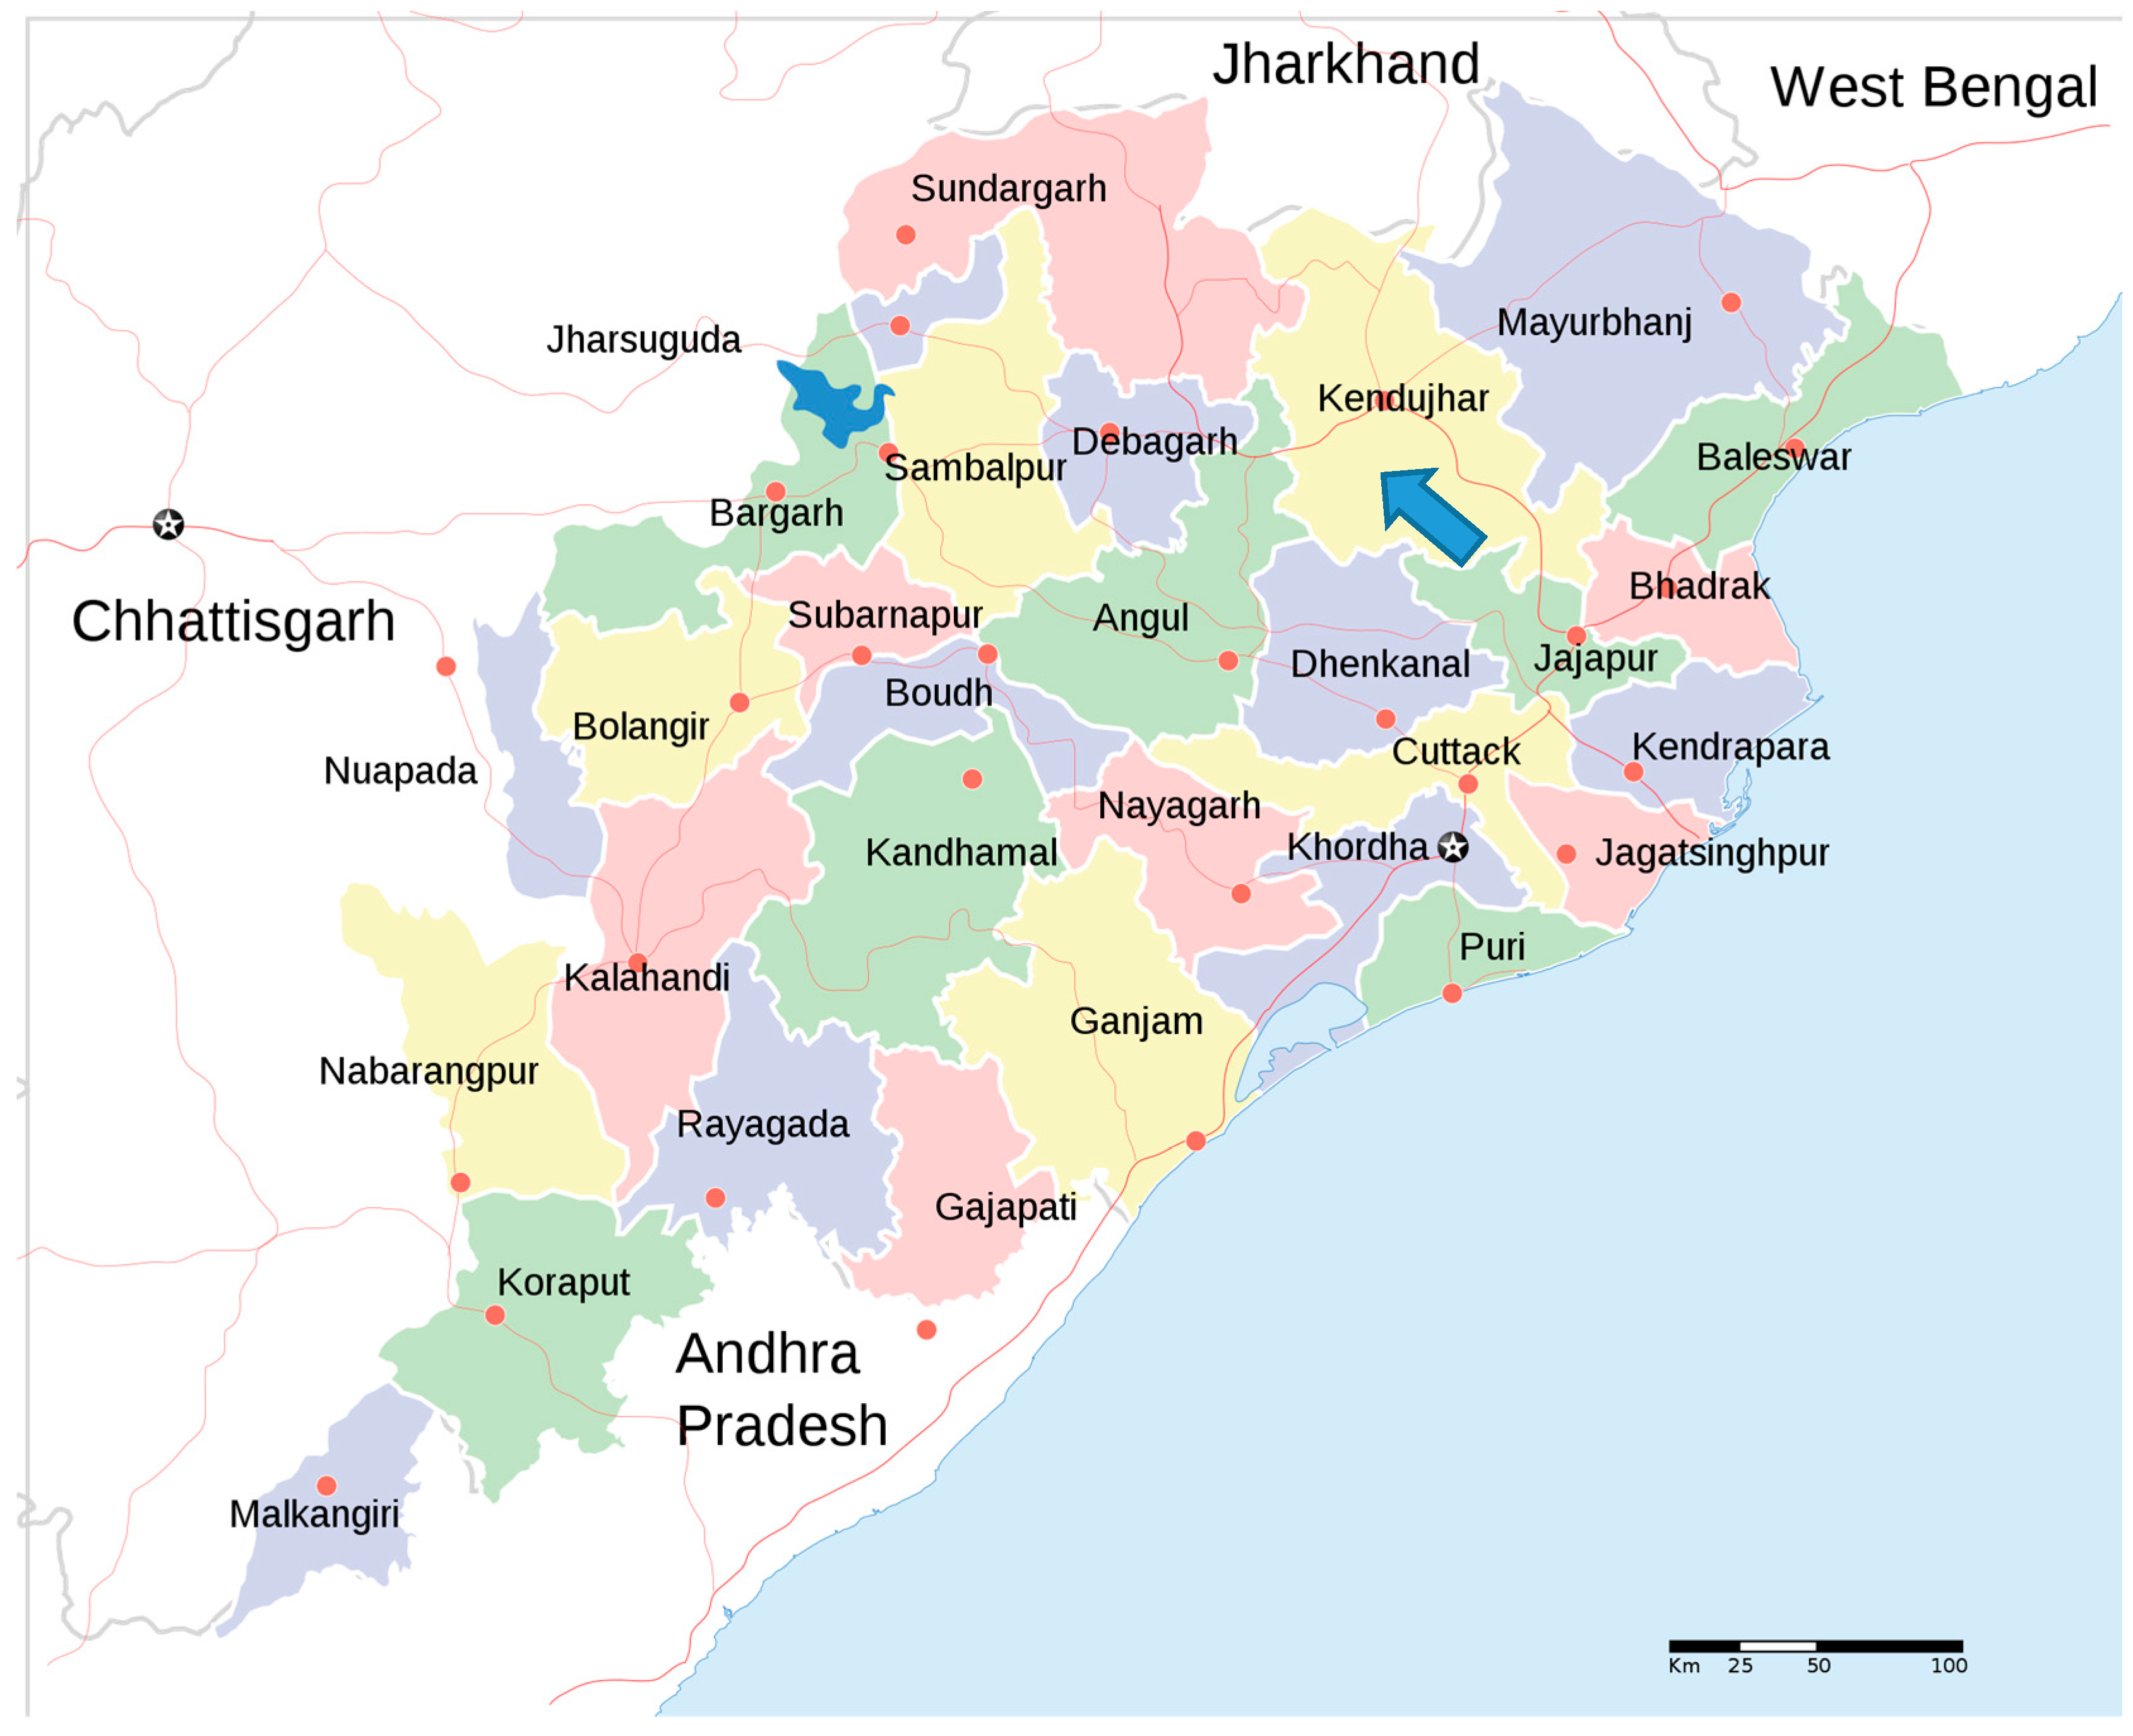
The study was conducted in the North-Central Plateau zone in the Kendujhar district of Odisha, India (
Figure 1). Kendujhar district is the highest tribal population in Odisha, consisting of illiterate and resource-poor farmers, has the greatest area under rain-fed cultivation (27,580 ha), and currently faces problems of poor yield, soil erosion, and land degradation due to intensive tillage practices with a poor level of agricultural management [
19]. The study ran from 2014 to 2016. The soil is mainly developed from colluvial-alluvial deposits in a piedmont plain with soil texture ranging from sandy clay loam to sandy loam and classified as Fluventic Haplustepts (Inceptisol). The climate, Aw on the Köppen Climate Classification or Tropical Savanna, is hot, moist, and sub-humid tropic with average an annual rainfall of 1500 mm, with more than 75% of the rainfall received from May to September. The district’s usual cropping system is broadcasting of local low-yielding cultivars of maize during the rainy season (mid-June to September) followed by mustard (
Brassica campestris) as a post-rainy season crop (October–January) without any residue retention practice or cover crop (February–May). Through expert advice from scientists, local extension and NGO personnel, and local farmers along with baseline surveys, the villages of Rudhiapada and Badamahulidiha were chosen for on-farm CA trials. The villages were selected based on willingness to participate in the study, accessibility of field sites, and similarity of farm size and cultivation systems with other smallholder tribal communities in the region.
2.2. Quantitative Data Survey
Surveys were conducted in 56 households in Rudhiapada and Badamahulidiha comprising the entire population in the villages. Local partners selected these two villages based on their poor socio-economic situation for tribal communities, the potential for improvements to their agricultural production systems, and existing NGO presence. Primary data were collected using face-to-face interviews with local enumerators employed by our India partners from Orrisa University of Agriculture and Technology (OUAT). Baseline surveying took place in 2014 and inputs and outputs data from the treatment took place in 2016. The questionnaire consists of sections on farm characteristics, input use, output and income performances. Yield performances and input use were collected in 2016 after the CA experiments were implemented. Collected data were used to construct representative maize-based production system profiles and evaluate technical efficiency and productivity determinants.
2.3. Experimental Design
Two CA maize-based production systems were designed jointly by our local partners and farmers after assessing their current practices and future potentials. The experiment was managed by farmers in 23 adjacent fields in Rudhiapada and in 33 adjacent fields in Badamahulidiha. The experiment was implemented during the 2015 kharif growing season. Each farmer represented a replication. Plots within each farmers’ field were established in a randomized design with treatments consisting of: conventional tillage (plow twice) with the local cultivar of maize (Zea mays L.) broadcast in the field (CT-M); a CA of reduced tillage (plow once) with the improved maize cultivar ‘Nilesh’ planted in rows at a 60 × 30 cm2 spacing (MT-M); and a CA of reduced tillage with improved maize cultivar intercropped with cowpea (Vigna unguiculata L.) cultivar ‘Hariyalli Bush’ in rows at 30 × 15 cm2 spacing (MT-M+C). The recommended fertilization for maize was 80, 40, 40 kg/ha N, P2O5, and K2O, respectively. Cowpea was fertilized at 20, 40, 20 kg/ha N, P2O5, and K2O, respectively. Nitrogen was applied as urea, phosphate as single super phosphate, and potassium as muriate of potash.
In each field, conventional tillage was achieved by animal-assisted plowing of plots twice, while in reduced tillage plots, the plot was plowed once. Seeds were sown along lines drawn with the help of a trench hoe in CA treatments. In the intercropped plots, cowpea was sown in between maize rows in a 1:1 ratio. In the post-rainy season, the CT-M treatment was plowed, whereas for the MT treatments, the crop ridges were cut at ground level, the field leveled and planting lines demarcated for the seeds. The CT-M included a broadcast application of farm yard manure when available to the farmers. The fertilizer applied for maize + cowpea was based on an additive series, taking into consideration 100% of the maize stand and 50% of the cowpea stand. The fertilizers were applied inline at seeding except for maize where nitrogen was applied in three split applications with 25% applied at planting, 50% at first weeding, and the remainder at the second weeding.
Farmers recorded inputs of actual seed and fertilizer used, hours of labor by gender, and maize and cowpea yield. Maize and cowpea prices were determined by a market survey conducted in Kendjuhar. The cowpea yield was converted to maize equivalent yield (MEY) based on market price of cowpea and maize [
20].
2.4. Production Function and Efficiency Frontier Analysis
For the production function, an ordinary least squares (OLS) technique was used to estimate a Cobb-Douglas production function with a log-log functional form given by:
where MEY = the maize equivalent yield (t/ha) for each field, β
0−β
8 = the parameters to be estimated, Female labor = female adult labor (hours), Male labor = male adult labor (hours), Seed = sum of maize and cowpea seeds (kg/ha), and Nitrogen and Phosphorus = quantities of fertilizer applied by farmers (kg/ha). All quantities represent the amount of inputs used during one growing season at each field from land preparation to harvesting. For example, female labor represents the sum of the reported hours contributed by female adult workers during each stage of the growing season at each field. Three dummy variables were used for this analysis: (1)
Village with 1 denoting that the farm is located in Badamahulidiha and 0 for being located in Rudhiapada; (2)
Tillage with 1 indicating adopting reduced tillage with maize only (MT-M) and 0 with full tillage; and (3)
Intercrop with 1 indicating adopting reduced tillage with intercropping of maize and cowpea (MT-M+C) and 0 without intercropping.
MEY is a measure of intercrop yield converted cowpea to maize yield on the basis of price [
20,
21]. MEY was calculated by converting the cowpea yield as:
where MEY = maize equivalent yield (t/ha), Y
i = yield of the i-
th crop (t/ha), P
i = price of the i-
th crop (US
$/t), and Pm = price of maize (US
$/t). In this study, only maize and cowpea were considered.
For the technical efficiency analysis, a data envelopment analysis (DEA) was conducted. DEA is a non-parametric technique used for frontier estimation [
22], performance measurement [
23] and benchmarking [
24]. DEA identified efficiency frontiers for the different maize cropping systems (current smallholder practice, and the two CA cropping systems) [
25] using linear programming to determine the relative efficiencies of farms. The use of DEA also overcomes some of the problems with traditional performance measurement methods [
26], such as ratio analysis and regression analysis. VRS (variable return to scale) technical efficiencies were calculated using DEAP V2.1 [
27], developed by the Centre for Efficiency and Productivity Analysis (CEPA) at the University of Queensland.
The DEA model was used to estimate the technical efficiencies of farms conducting the CA. We used the VRS specification that allowed for estimation of the frontier function and the pure technical efficiency scores from an output orientation [
26].
The frontier level of production for CA treatment
i is defined by:
where:
Assuming there are N inputs and M outputs for each of I farms. For the i-th farm these are represented by column of vectors xi and qi, respectively.
φ (1 ≤ φ < ∞) is a scalar,
λ is a I × 1 vector of constants,
xi is N × 1 vector of inputs weights of i-th treatments
qi is M × 1 vector of outputs weights of i-th treatments,
X is a N × I input matrix,
Q is a M × I output matrix, and
I1 is a I × 1 vector of ones [
25].
Assuming that the quantities of inputs are kept constant, φ − 1 represents the proportional increase in outputs by the i-th farmer (the DMUs in the study), and TE score is equal to 1/φ.
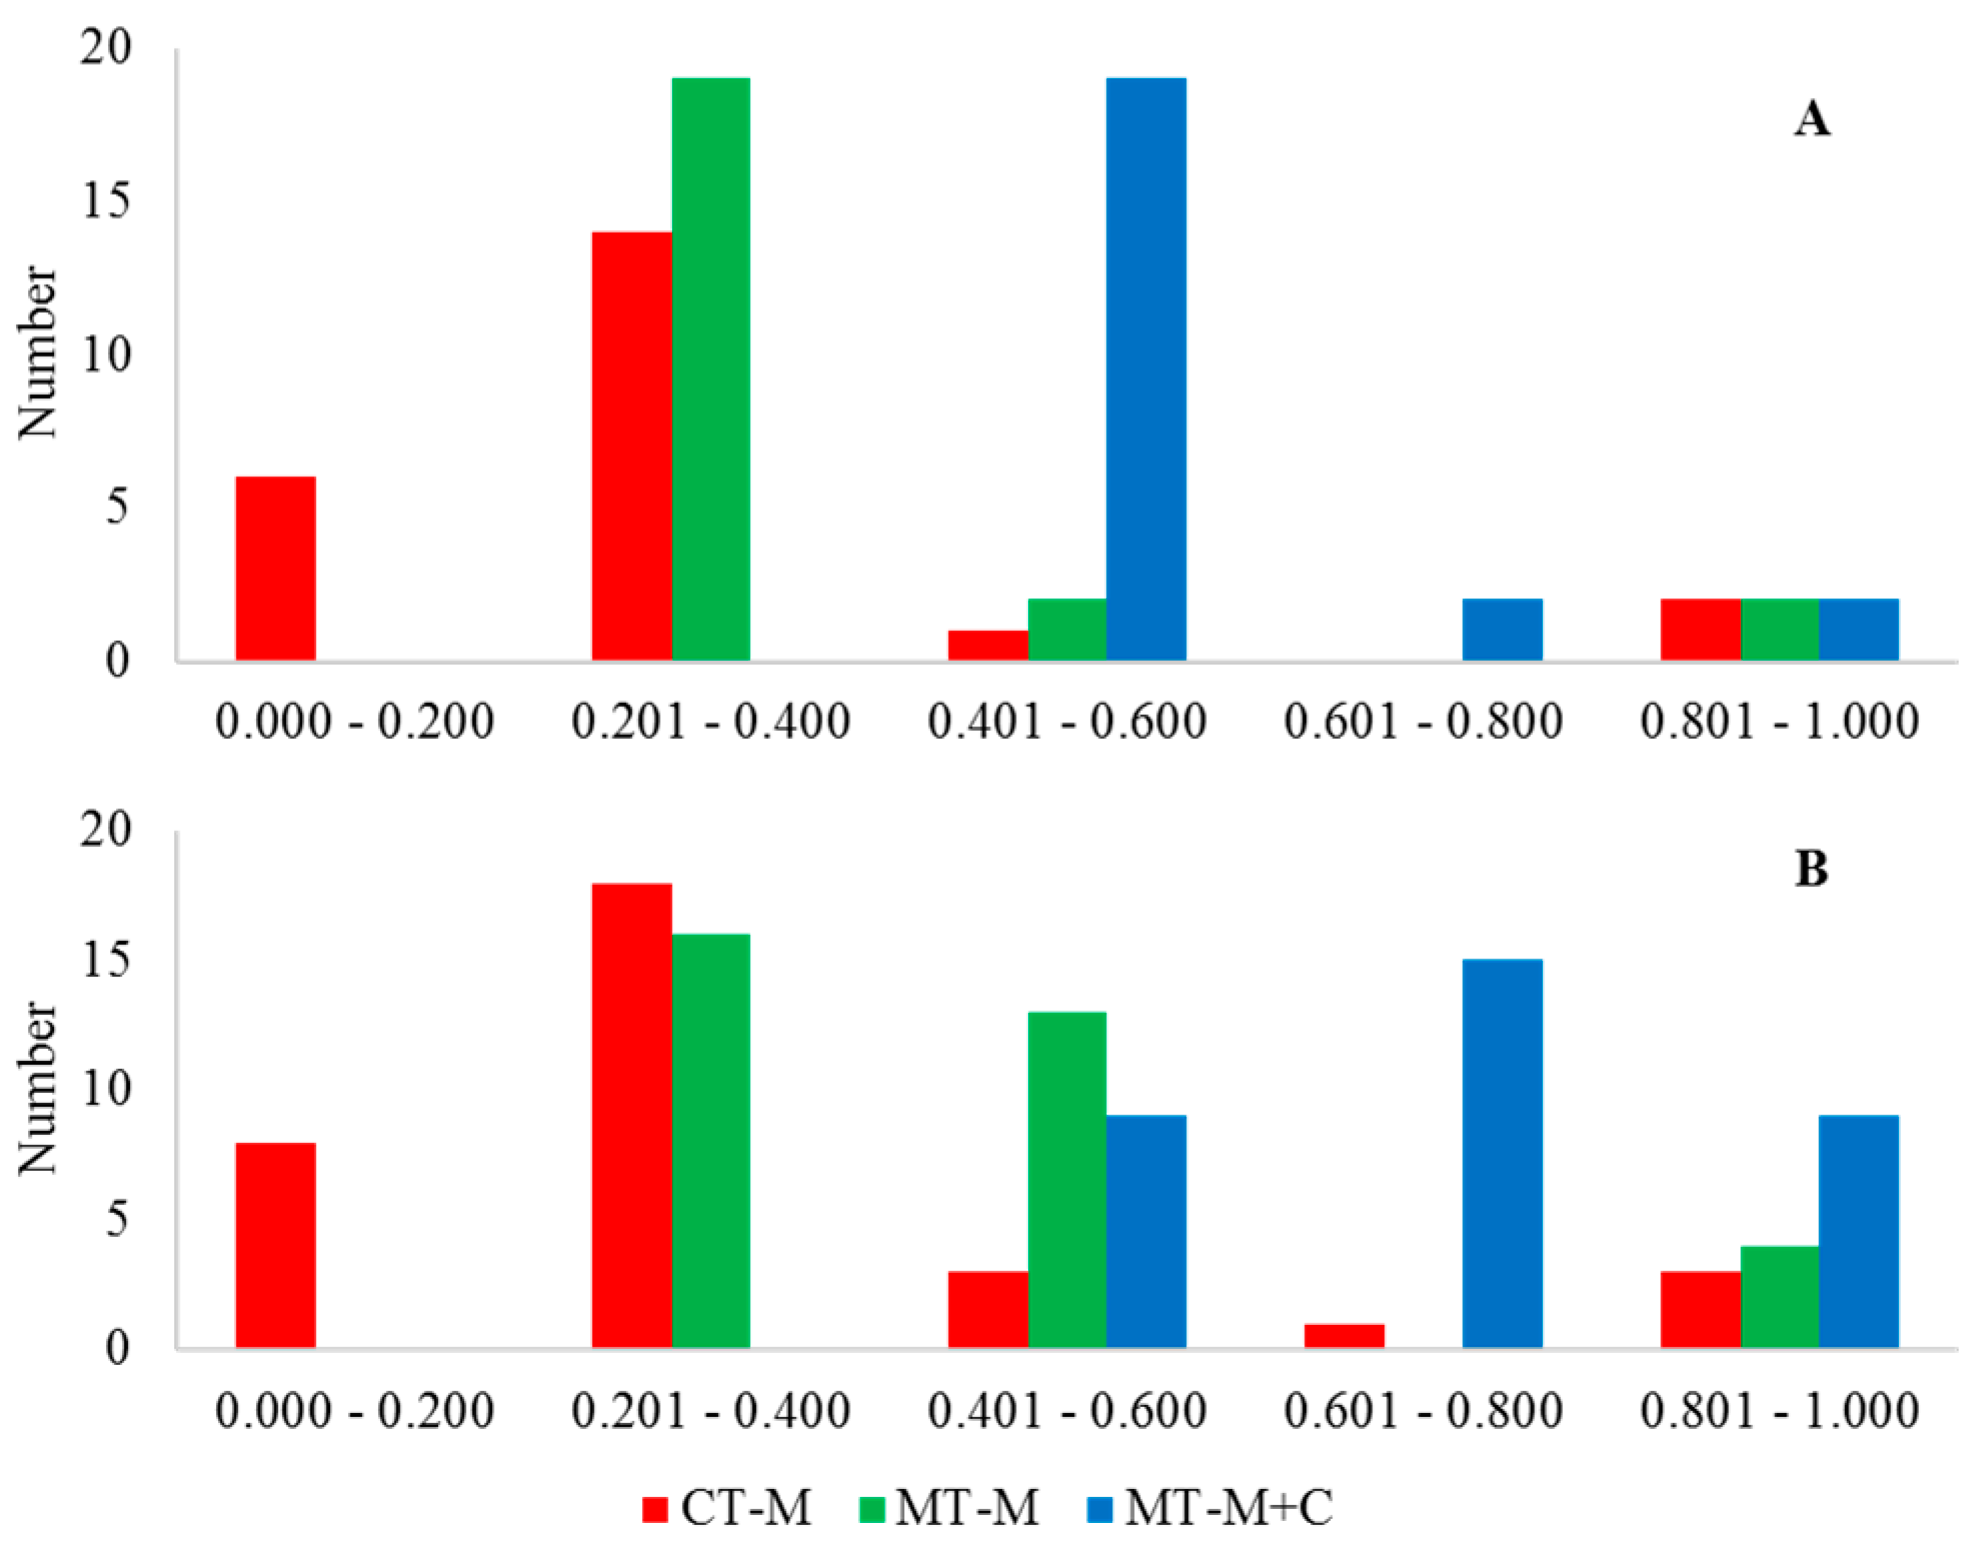
The VRS scores from the DEA model were placed into categories of 0–0.2, 0.21–0.4, 0.41–0.6, 0.61–0.8, and 0.81–1.0 and the VRS frequency among the farmers plotted to estimate the distribution of farmer’s efficiencies (
Figure 1). The slacks, i.e., the increase in outputs and/or the decrease in inputs needed for a farm unit to become efficient, were compared between two farmers to demonstrate how individual farmer can improve efficiency.
3. Results
3.1. Farm Profile and Descriptive Statistics
The average village household family size in Rudhiapada and Badamahulidiha consisted of 5–6 members (
Table 1). A household generally consists of two to three generations of family members. Farm household incomes varied from US
$400 to US
$1000 per year. The higher incomes were associated with families having employment outside the farm. Livestock husbandry included cattle, oxen, goats, and chickens. The majority of households depended on, and had oxen for, plowing operations. On average, the villagers reported limited formal education, on average of 2.5 years. The average farm size was 0.06 ha and average yield of maize in these villages was about 2–2.5 t/ha (
Table 1).
The households in these villages are highly dependent on agriculture to sustain their livelihood. Off-farm employment opportunities are limited particularly for women and the elderly. Both the villages cultivated maize followed by mustard as their major cropping system with 40% of the surveyed population producing maize solely for household consumption and livestock feed. The remaining 60% of the population sold on average 50% of their maize output in the local market. Such dependency on maize production for both household food security and income generation indicates a demand for agricultural practices to improve maize yields. Further use of traditional cultivation practices, i.e., intensive tillage practices, no legume cultivation in the cropping system, and an absence of year-round residue cover, require a conservation agricultural approach to be sustainable.
The villages also differed in their MEY and inputs in the CA cropping systems. MEY was greater in Badamahuilidiha than Rudhiapada by 30% (
Table 2). Labor differed between villages with female labor higher than male labor in both villages (
Table 2). In general, more labor was reported in Rudhiapada than Badamahulidiha for both females and males. Female labor in Rudhiapada was nearly 40% higher than male labor whereas female labor was 20% higher than male labor in Badamahulidiha.
Many of the inputs, such as seed and fertilizer, were similar between villages for the CA cropping systems because these inputs were either provided by the project or recommended by the project. The smallholder farmers in Rudhiapada had greater variation in their use of inputs as compared to those in Badamahuilidiha.
3.2. Production Function Analysis
The estimated production function model with MEY as a function of inputs, village, and treatments (Equation (1)) has an adjusted R
2 = 0.876. Data were subjected to a stepwise regression analysis using Stata [
28]. To test for multicollinearity, the variance inflation factor (VIF) index was used. Fertilizers were found to be correlated, so the variable Potassium was dropped. Dropping the Potassium variable which was not significant in the initial model did not change model estimated parameter values and significance except for making the Nitrogen parameter significant, which is expected. No significant multicollinearity was identified for the final model without Potassium and the R
2 did not change.
Eight out of nine estimated parameters are significant at least at the
p ≤ 0.10 level. Most parameters are positive as expected, except for female labor and phosphate, indicating a decreasing return for these two inputs. (
Table 3).
Whereas the villages differed in their average yields (
Table 2), the CA cropping systems, especially MT-M+C’s yield, were superior to the conventional practice. Intercropping with cowpea significantly increase MEY (
p < 0.01). Yield by CA treatment was higher when compared to the conventional farm practice with MT-M+C cropping system having the highest yield. The different farm inputs had an impact on MEY. Labor was important. A significant positive sign for male labor, indicating more male labor would increase MEY, while additional female labor would significantly decrease MEY. Nitrogen contributes positively to MEY and was probably applied at appropriate levels for the crop. Village makes a difference to MEY, Badamahuilidiha significantly outperformed Rudhiapada in MEY possibly indicating being exposed to more positive environmental factors, such as NGO training or greater income (
Table 3).
3.3. Technical Efficiency
Variable return to scale (VRS) differed among the different CA cropping systems by villages (
Table 4). VRS pure technical efficiency scores significantly differed among CA cropping systems within a village (F(1,44) = 16.15,
p < 0.0001 for for Rudhiapada and F(1,64) = 30.00,
p < 0.0001 for Badamahulidiha). In Rudhiapada, the VRS scores averaged 0.3, 0.4, and 0.6 in cropping systems CT-M, MT-M, and MT-M+C, respectively. In Badamahulidiha, the VRS scores averaged 0.3, 0.5, and 0.7 in cropping systems CT-M, MT-M, and MT-M+C, respectively. The average efficiency levels of the smallholder farmers, as expected, were lowest on average in the CT-M cropping system, followed by the MT-M and MT-M+C cropping systems. The MT-M+C cropping system resulted in the highest average efficiency among farmers (
Table 4,
Figure 1). This higher VRS could be indicative of the training farmers received prior to conducting their trials. The technical efficiency scores by village reflected the greater MEY in Badamahulidiha compared to Rudihiapada. Badamahulidiha. TE scores shifted higher by treatments in Badamahulidiha compared to Rudhiapada indicating as a whole the farmers there were quicker and adaptive to implementing the CA technologies. In terms of TE scores by treatments, the spread towards greater efficiencies from CT-M to MT-M to MT-M+C increases. This could be attributed to CA technologies’ ability to withstand climate change conditions and maintain a higher yield as more CA components are added, such as reduced tillage plus intercropping.
The number of farmers achieving the increasing, constant and decreasing return to scale differed between the two villages and by treatments (
Table 5). For Rudhiapada, most farmers are operating on the decreasing returns to scale for the CA treatments indicating that the output increase, though positive, is decreasing with an increase of input indicating increasing costs in the long run. In this situation, farmers can either decrease inputs to achieve the same output or use the same amount of input to increase outputs. However, for Badamahulidiha, most farmers practicing MT-M+C are experiencing constant returns to scale suggesting that for the same input, the output amount increases proportionally. Farmers in this category can opt to keep increasing inputs to obtain the same increase in outputs up to the point of decreasing return to scale. For MT-M on the other hand, farmers in Badamahulidiha are experiencing increasing return to scale. In this case farmers should increase inputs to obtain higher outputs (
Table 5).
The CA cropping systems increased the overall efficiencies of the farmers in both villages (
Figure 1). The number of farmers in the lower ranges of efficiencies decreased in both villages with CA cropping systems. Similar to MEY, the farmers in Badamahulidiha had higher efficiencies than those in Rudhiapada (
Figure 1). The differences in efficiencies between the villages were especially evident in the MT-M+C cropping systems (
Figure 1). Most of the Rudhiapada farmers for this CA cropping system were in the 0.401–0.600 range, whereas the Badamahulidiha farmers were in the 0.601–0.800 range, suggesting farmers in Badamahulidiha are more efficient, in general.
In addition to the estimated technical efficiencies, moreover, the software [
26] is able to estimate the changes in output with changes in input amounts to help individual farmer to improve their technical efficiencies. In
Table 6, the actual, slack columns showing MEY and input quantities, and the projected column showing the changes in input quantity change are provided. The results suggest that the two selected farmers A and B from Badamahulidiha could increase their efficiencies, thus achieving the higher MEY indicated in the slack columns of 3258 kg/ha and 3664 kg/ha by decreasing their inputs, although by different amounts on each farm. Both farmers can decrease fertilizer, seed, and female labor to achieve greater efficiency. Farmer A is applying much more input than is needed than Farmer B (
Table 6 and
Figure 2). The input change projections for these two farmers validate the OLS production function model that highlighted the overuse of female labor, phosphate, and seeds.
4. Discussion
Two typical tribal villages, Badamahulidiha and Rudhiapada in Odisha, India, represented smallholder farms in tropical rain-fed, maize-based cropping system. The outcomes from these farms could be applicable to many parts of India and other tropical environments. Smallholder farmers in these villages, extension personnel in the district and scientists in OUAT were consulted and, in a transdisciplinary, manner designed the cropping systems. This study evaluated the impact of CA cropping systems using a transdisciplinary approach to improve food security in a sustainable manner. The two CA cropping systems selected both introduced reduced tillage and one introduced maize intercrop with cowpea. Cowpea offers diversity in the diet, commands a high market price, and adds nitrogen to the soil. The transdisciplinary approach extended to data analysis and interpretation which provided insights that show greater understanding.
With the global change drivers of increasing population and limited arable land, CA practices have many desirable properties for tropical rain-fed farming systems for highly populated countries like India. CA by itself increases yield and provides resilience to farmers. The addition of an intercrop, in this case cowpea, provide a resource for both home consumption and market selling. In these CA cropping systems, inputs, such as fertilizer, must be optimized for maximum yield. We found that the farmers in the study villages applied more phosphate than needed for crop yield. The over-application of fertilizer can have negative effects on the environment that work against sustainability.
In addition to the traditional production parameters, this study examined the extent of how farmers within communities vary in their production efficiencies. If we introduce innovative technologies and maximize efficiencies at the same time, the impact of the intervention could be much greater than the innovative technology itself can offer. While CA cropping practices improve productivity, farmers are not generally efficient. The added yield from intercropping with cowpea provided substantially more yield and income to the smallholder farmers. However, much of the cowpea yield was not retained for household consumption, but sold in the market. This behavior has implications for food security. Smallholder households are trading off home consumption for income improvement. However, the poor efficiencies of the smallholder farmers, in some cases the average efficiency of the community is less than half that of the most efficient farmer in the community, is disconcerting. The variation of inefficiency within a community could be due to many factors, such as the allocation of inputs that are not optimal. In many cases the inputs are not affordable or the proper technical assistance is not provided. With the proper assistance from extension trainers and government subsidies for inputs and improved seeds, the potential yield gain can be tremendous and sustainable. These effects can help offset the global challenges that smallholder farmers face.
5. Conclusions
CA cropping systems improve productivity and provide resiliency to communities. CA cropping systems are also favorable to females, bringing greater gender equity into the communities. Since farmer efficiency can be greatly improved and, thus, increase yield output with the same input, there is great potential to address food security without adopting even new technologies. Promotion of and policies to encourage CA cropping systems is justifiable and recommended. Additionally, efforts must be made to increase the efficiency of smallholder farmers.
Smallholder farmers no longer have the option of shifting cultivation as their not-so-distant ancestors did. Consequently, the continual cultivation of land requires approaches, such as CA, that maintain productivity, increase yield, and provide resilience to the farm communities. CA provides resilience to changing patterns of rainfall, builds and maintains the soil structure, and adds organic matter for better plant growth and moisture retention. By increasing yields and introducing additional crops, CA can increase food security for smallholder farmers. The farmers may consume the added production or sell the increased yield in the market providing income to purchase food.
CA and training to increase efficiency of smallholder farmers can address many of the challenges deriving from climate change and land use changes that impact food security. Government has a role of promoting CA to ameliorate the global challenges in the short term as CA benefits generally are being realized a few years down the road.
Acknowledgments
We thank the smallholder farmers for their willingness to participate and contributions and efforts in interfacing wit, and facilitating, data collection. We thank the NGO VARRAT for their assistance in identifying villages and working closely with the smallholder farmers in implementing the field tests and recording data. This research was funded in part by the Belmont Forum through a grant from the National Science Foundation Award #1429971.
Author Contributions
C.C., B.S., and P.R. conceived and/or designed the experiments; C.C. came up with the methods of data analysis; A.A. and X.Z performed the DEA analysis; F.F. inputted the data; P.L., X.Z., and A.A. performed the regression analysis; J.C. and A.P. designed the surveys, contributed to data collection and interpretations; and C.C., B.S., A.P., J.C., and P.L. interpreted, wrote, and edited the manuscript.
Conflicts of Interest
The authors declare no conflict of interest.
References
- Kumar, M.D. Food Security and Sustainable Agriculture in India: The Water Management Challenge; Working Paper 60; International Water Management Institute: Colombo, Sri Lanka, 2003. [Google Scholar]
- Varadharajan, K.S.; Thomas, T.; Kurpad, A.V. Poverty and the state of nutrition in India. Asia Pac. J. Clin. Nutr. 2013, 22, 326–339. [Google Scholar] [PubMed]
- Reserve Bank of India, Government of India. Handbook of Statistics on Indian Economy 2013. Available online: https://rbi.org.in/Scripts/AnnualPublications.aspx?head=Handbook%20of%20Statistics%20on%20Indian%20Economy (accessed on 23 May 2017).
- Padhi, S.; Panigrahi, N.; Mishra, A.K. Tribal population and chronic poverty in Orissa: A note on the North-South divide. Mar. New Delhi 2007, 38, 1–81. [Google Scholar]
- Pradhan, A.; Idol, T.; Roul, P.K. Conservation agriculture practices in rainfed uplands of India improve maize-based system productivity and profitability. Front. Plant Sci. 2016, 7, 1–12. [Google Scholar] [CrossRef] [PubMed]
- Debebe, S.; Haji, J.; Goshu, D.; Edriss, A.K. Technical, allocative, and economic efficiency among smallholder maize farmers in Southwestern Ethiopia: Parametric approach. J. Dev. Agric. Econ. 2015, 7, 282–291. [Google Scholar]
- Llewelyn, R.V.; Williams, J.R. Nonparametric analysis of technical, pure technical, and scale efficiencies for food crop production in East Java, Indonesia. Agric. Econ. 1996, 15, 113–126. [Google Scholar] [CrossRef]
- Coelli, T.; Rahman, S.; Thirtle, C. Technical, allocative, cost and scale efficiencies in Bangladesh rice cultivation: A non-parametric approach. J. Agric. Econ. 2002, 53, 607–626. [Google Scholar] [CrossRef]
- Stevenson, J.R.; Serraj, R.; Cassman, K.G. Evaluating conservation agriculture for small-scale farmers in Sub-Saharan Africa and South Asia. Agric. Ecosyst. Environ. 2014, 187, 1–10. [Google Scholar] [CrossRef]
- Friedrich, T.; Derpsch, R.; Kassam, A. Overview of the global spread of Conservation Agriculture. Field Actions Sci. Rep. 2012, 6, 1–7. [Google Scholar]
- Hobbs, P.R. Conservation agriculture: What it is and why it is important for future sustainable food production? J. Agric. Sci. 2007, 145, 127–137. [Google Scholar] [CrossRef]
- Govaerts, B.; Sayre, K.D.; Goudeseune, B.; De Corte, P.; Lichter, K.; Dendooven, L.; Deckers, J. Conservation agriculture as a sustainable option for central Mexican highlands. Soil Tillage Res. 2009, 103, 222–230. [Google Scholar] [CrossRef]
- Kassam, A.; Friedrich, T.; Shaxson, F.; Pretty, J. The spread of conservation agriculture: Justification, sustainability and uptake. Int. J. Agric. Sustain. 2009, 7, 292–320. [Google Scholar] [CrossRef]
- Wall, P. Strategies to overcome the competition for crop residues in southern Africa: Some light at the end of the tunnel. In Proceedings of the 4th World Congress on Conservation Agriculture, New Delhi, India, 4–7 February 2009; pp. 65–70. [Google Scholar]
- Thierfelder, C.; Wall, P. Rotation in conservation agriculture systems of Zambia: Effects on soil quality and water relations. J. Exp. Agric. 2010, 46, 1–17. [Google Scholar] [CrossRef]
- Food and Agriculture Organization. Conservation Agriculture: Case Studies in Latin America and Africa; FAO Soils Bulletin; FAO: Rome, Italy, 2002; Volume 78. [Google Scholar]
- Bishop-Sambrook, C. Labor Saving Technologies and Practices for Farming and Household Activities in Eastern and Southern Africa; IFAD/FAO: Rome, Italy, 2003; p. 62. Available online: http://www.hiproweb.org/fileadmin/cdroms/biblio-reference-0912/documents/RRD-23-labour%20saving%20technologies.pdf (accessed on 20 January 2017).
- Giller, K.E.; Witter, E.; Corbeels, M.; Tittonell, P. Conservation agriculture and smallholder farming in Africa: The heretics’ view. Field Crop. Res. 2009, 124, 468–472. [Google Scholar] [CrossRef]
- Pradhan, A.; Idol, T.; Roul, P.K.; Mishra, K.N.; Chan, C.; Halbrendt, J.; Ray, C. Effect of tillage, intercropping and residue cover on crop productivity, profitability and soil fertility under tribal farming situations of India. In Conservation Agriculture in Subsistence Farming: Case Studies from South Asia and Beyond; Chan, C., Fantle-Lepczyk, J., Eds.; CABI: Wallingford, UK, 2016; pp. 77–94. [Google Scholar]
- Paudel, B.; Radovich, T.; Chan, C.; Crow, S.; Halbrendt, J.; Thapa, K.; Tamang, B.B. Potential of Conservation Agriculture Production Systems (CAPS) for improving sustainable food and nutrition security in the hill region of Nepal. In Conservation Agriculture in Subsistence Farming: Case Studies from South Asia and Beyond; Chan, C., Fantle-Lepczyk, J., Eds.; CABI: Wallingford, UK, 2015; pp. 55–76. [Google Scholar]
- Haque, M.; Kumar, B.; Kalyani, S.; Kumar, R. Effect of Maize (Zea mays) based Intercropping System on Maize Yield and Associated Weeds under Rainfed Upland Ecosystem. Res. J. Agric. Sci. 2013, 4, 416–419. [Google Scholar]
- Murthy, D.; Sudha, M.; Hegde, M. Technical efficiency and its determinants in tomato production in Karnataka, India: Data Envelopment Analysis (DEA) Approach. Agric. Econ. Res. Rev. 2009, 22, 215–224. [Google Scholar]
- Wadud, A.; White, B. Farm household efficiency in Bangladesh: A comparison of stochastic frontier and DEA methods. Appl. Econ. 2000, 32, 1665–1673. [Google Scholar] [CrossRef]
- Lahouel, B.B. Eco-efficiency analysis of French firms: A data envelopment analysis approach. Environ. Econ. Policy Stud. 2016, 18, 395–416. [Google Scholar] [CrossRef]
- Coelli, T. A Guide to DEAP Version 2.1, a Data Envelopment Analysis (Computer) Program. CEPA Working Paper 96/08. 1996. Available online: http://www.owlnet.rice.edu/~econ380/DEAP.PDF (accessed on 20 January 2017).
- Farrell, M.J. The measurement of productive efficiency. J. R. Stat. Soc. A 1957, 120, 253–281. [Google Scholar] [CrossRef]
- DEAP Version 2.1. CEPA Centre for Efficiency and Productivity Analysis. University of Queensland. Available online: http://www.uq.edu.au/economics/cepa/deap.php (accessed on 20 July 2016).
- StataCorp. In Stata Statistical Software: Release 12; StataCorp LP: College Station, TX, USA, 2011.
© 2017 by the authors. Licensee MDPI, Basel, Switzerland. This article is an open access article distributed under the terms and conditions of the Creative Commons Attribution (CC BY) license (http://creativecommons.org/licenses/by/4.0/).

 ,
, 

