Article

Tree Biomass Equations from Terrestrial LiDAR: A Case Study in Guyana

1
Laboratory of Geo-Information Science and Remote Sensing, Wageningen University & Research, Droevendaalsesteeg 3, 6708 PB Wageningen, The Netherlands
2
Center for International Forestry Research (CIFOR), Jalan CIFOR, Situ Gede, Bogor Barat 16115, Indonesia
3
CAVElab-Computational & Applied Vegetation Ecology, Ghent University, Coupure Links 653, 9000 Gent, Belgium
4
Center for International Forestry Research (CIFOR) Germany, Charles-de-Gaulle-Strasse 5, 53113 Bonn, Germany
5
Computing Sciences, Tampere University, Korkeakoulunkatu 7, 33720 Tampere, Finland
6
Department of Geography, University College London, Gower Street, London WC1E 6BT, UK
7
Guyana Forestry Commission (GFC), 1 Water Street, Kingston, Georgetown, Guyana
8
Department of Forest Ecology and Management, Swedish University of Agricultural Sciences (SLU), Skogsmarksgränd, 901 83 Umeå, Sweden
*
Author to whom correspondence should be addressed.
Forests 2019, 10(6), 527; https://doi.org/10.3390/f10060527
Submission received: 1 May 2019 / Revised: 10 June 2019 / Accepted: 20 June 2019 / Published: 25 June 2019
(This article belongs to the Special Issue Remote Sensing Technology Applications in Forestry and REDD+)

Abstract

:
Large uncertainties in tree and forest carbon estimates weaken national efforts to accurately estimate aboveground biomass (AGB) for their national monitoring, measurement, reporting and verification system. Allometric equations to estimate biomass have improved, but remain limited. They rely on destructive sampling; large trees are under-represented in the data used to create them; and they cannot always be applied to different regions. These factors lead to uncertainties and systematic errors in biomass estimations. We developed allometric models to estimate tree AGB in Guyana. These models were based on tree attributes (diameter, height, crown diameter) obtained from terrestrial laser scanning (TLS) point clouds from 72 tropical trees and wood density. We validated our methods and models with data from 26 additional destructively harvested trees. We found that our best TLS-derived allometric models included crown diameter, provided more accurate AGB estimates ( R 2 = 0.92–0.93) than traditional pantropical models ( R 2 = 0.85–0.89), and were especially accurate for large trees (diameter > 70 c m ). The assessed pantropical models underestimated AGB by 4 to 13%. Nevertheless, one pantropical model (Chave et al. 2005 without height) consistently performed best among the pantropical models tested ( R 2 = 0.89) and predicted AGB accurately across all size classes—which but for this could not be known without destructive or TLS-derived validation data. Our methods also demonstrate that tree height is difficult to measure in situ, and the inclusion of height in allometric models consistently worsened AGB estimates. We determined that TLS-derived AGB estimates were unbiased. Our approach advances methods to be able to develop, test, and choose allometric models without the need to harvest trees.

1. Introduction

Guyana has approximately 18.3 million hectares of forests with a relatively low deforestation rate (between 0.1 and 0.3% per year), but is expected to increase in the future [1]. A cooperation between the Governments of Norway and Guyana expresses their willingness to provide a replicable model on how REDD+ can align the national forest countries’ objectives with the world’s need to combat climate change [1]. For that, Guyana is one of the first countries to establish a national program for reducing emissions from deforestation and degradation (REDD+; [2]). Guyana’s REDD+ activities include the design and implementation of a national monitoring, measurement, reporting and verification (MMRV) system, which should be able to assess and reduce aboveground biomass (AGB) uncertainties within the country’s capacities and capabilities [3].
AGB is typically estimated with allometric models built from empirical data. The applicability of any allometric model is thus largely dependent on the data used for its development and can produce systematic over- or under-estimations of the true AGB when applied to other geographic regions, species, or tree sizes where little or no data were included [4,5,6]. Since the performance of a country’s MMRV program will be based on the quantification of emission reduction [6,7], Guyana seeks to test the accuracy of pantropical models and develop a country-specific allometric model.
Current AGB allometric models in tropical forests are commonly based on diameter at breast height (D; which can be measured in the field) and wood density ( W D ; from existing databases such as Global Wood Density Database [8,9]). In recent years, other tree biophysical attributes have been included such as height (H; [10]) and crown diameter ( C D ; [5]); and regional trends in height [10] crown width [5] and climate variability (E; [11]). However, due to the difficulty of measuring tree heights, the pantropical allometric models developed by Chave et al. [12] in 2005 are still widely used because they only require tree diameter and species [13].
An accurate biomass estimation of large trees is particularly important for both forest biomass [14] and forest biomass estimates [5]. Large trees account for around 75% of total forest AGB variation [14,15,16], and the uncertainty of tree biomass estimates increases with size [5,17,18]. Despite their relevance, large trees make up only 7% of available tropical biomass data (as of 2014; [11]), and the lack of inclusion of large tree biomass data in the development of allometric models is increasingly viewed as problematic [19,20,21,22]. Large trees explain over 75% of variation in total forest biomass [14,15,16]) and can predict the plot-level AGB. However, AGB error increases greatly with increasing tree size, and pantropical allometric models often underestimate large tree biomass [5,17,18].
Terrestrial Light Detection And Ranging (LiDAR), also known as terrestrial laser scanning (TLS), has been proven to be a valuable tool to assess the woody structure of trees [18,23,24]. TLS data provide high level of three-dimensional detail of forest and tree structure, which allow extrapolation to broader scales, or national scales using remote sensing systems [25]. Several studies have successfully taken TLS from its original utility—precision surveying applications—to tropical forests [18,22,23,26,27,28,29] and extracted tree attributes such as tree diameter [17], height [30,31], and crown width [32]. In combination with quantitative structure modelling (e.g., TreeQSM [33] or SimpleTree [34]), 3D tree point clouds were used to infer attributes such as total volume, AGB [17,18,22,26,30], AGB change [35], and tree species [36], as well as ecological questions such as tree mechanics, branching architecture, and surface area scaling [24].
Tropical countries seeking to participate in REDD+ that do not possess their own tree biomass database might find TLS-driven methodology a resourceful alternative. We have earlier used TLS to evaluate the accuracy of existing allometric models [17,18], and now we assess the potential of TLS and TreeQSM-method to develop allometric models to estimate AGB in forest trees of Guyana. We produced a unique tropical tree mass dataset of traditional inventory data and TLS scans of 98 tropical trees; 26 of these trees were destructively harvested, re-measured, and weighed as validation data. The objectives of this study are: (i) to model tree volume and estimate tree AGB from TreeQSM models of tree point clouds; (ii) to build allometric models based on TLS measurements for Guyana; and (iii) to evaluate the performance of these TLS-derived data and allometric models against destructively-harvested reference data and estimates from pantropical models.

2. Materials and Methods
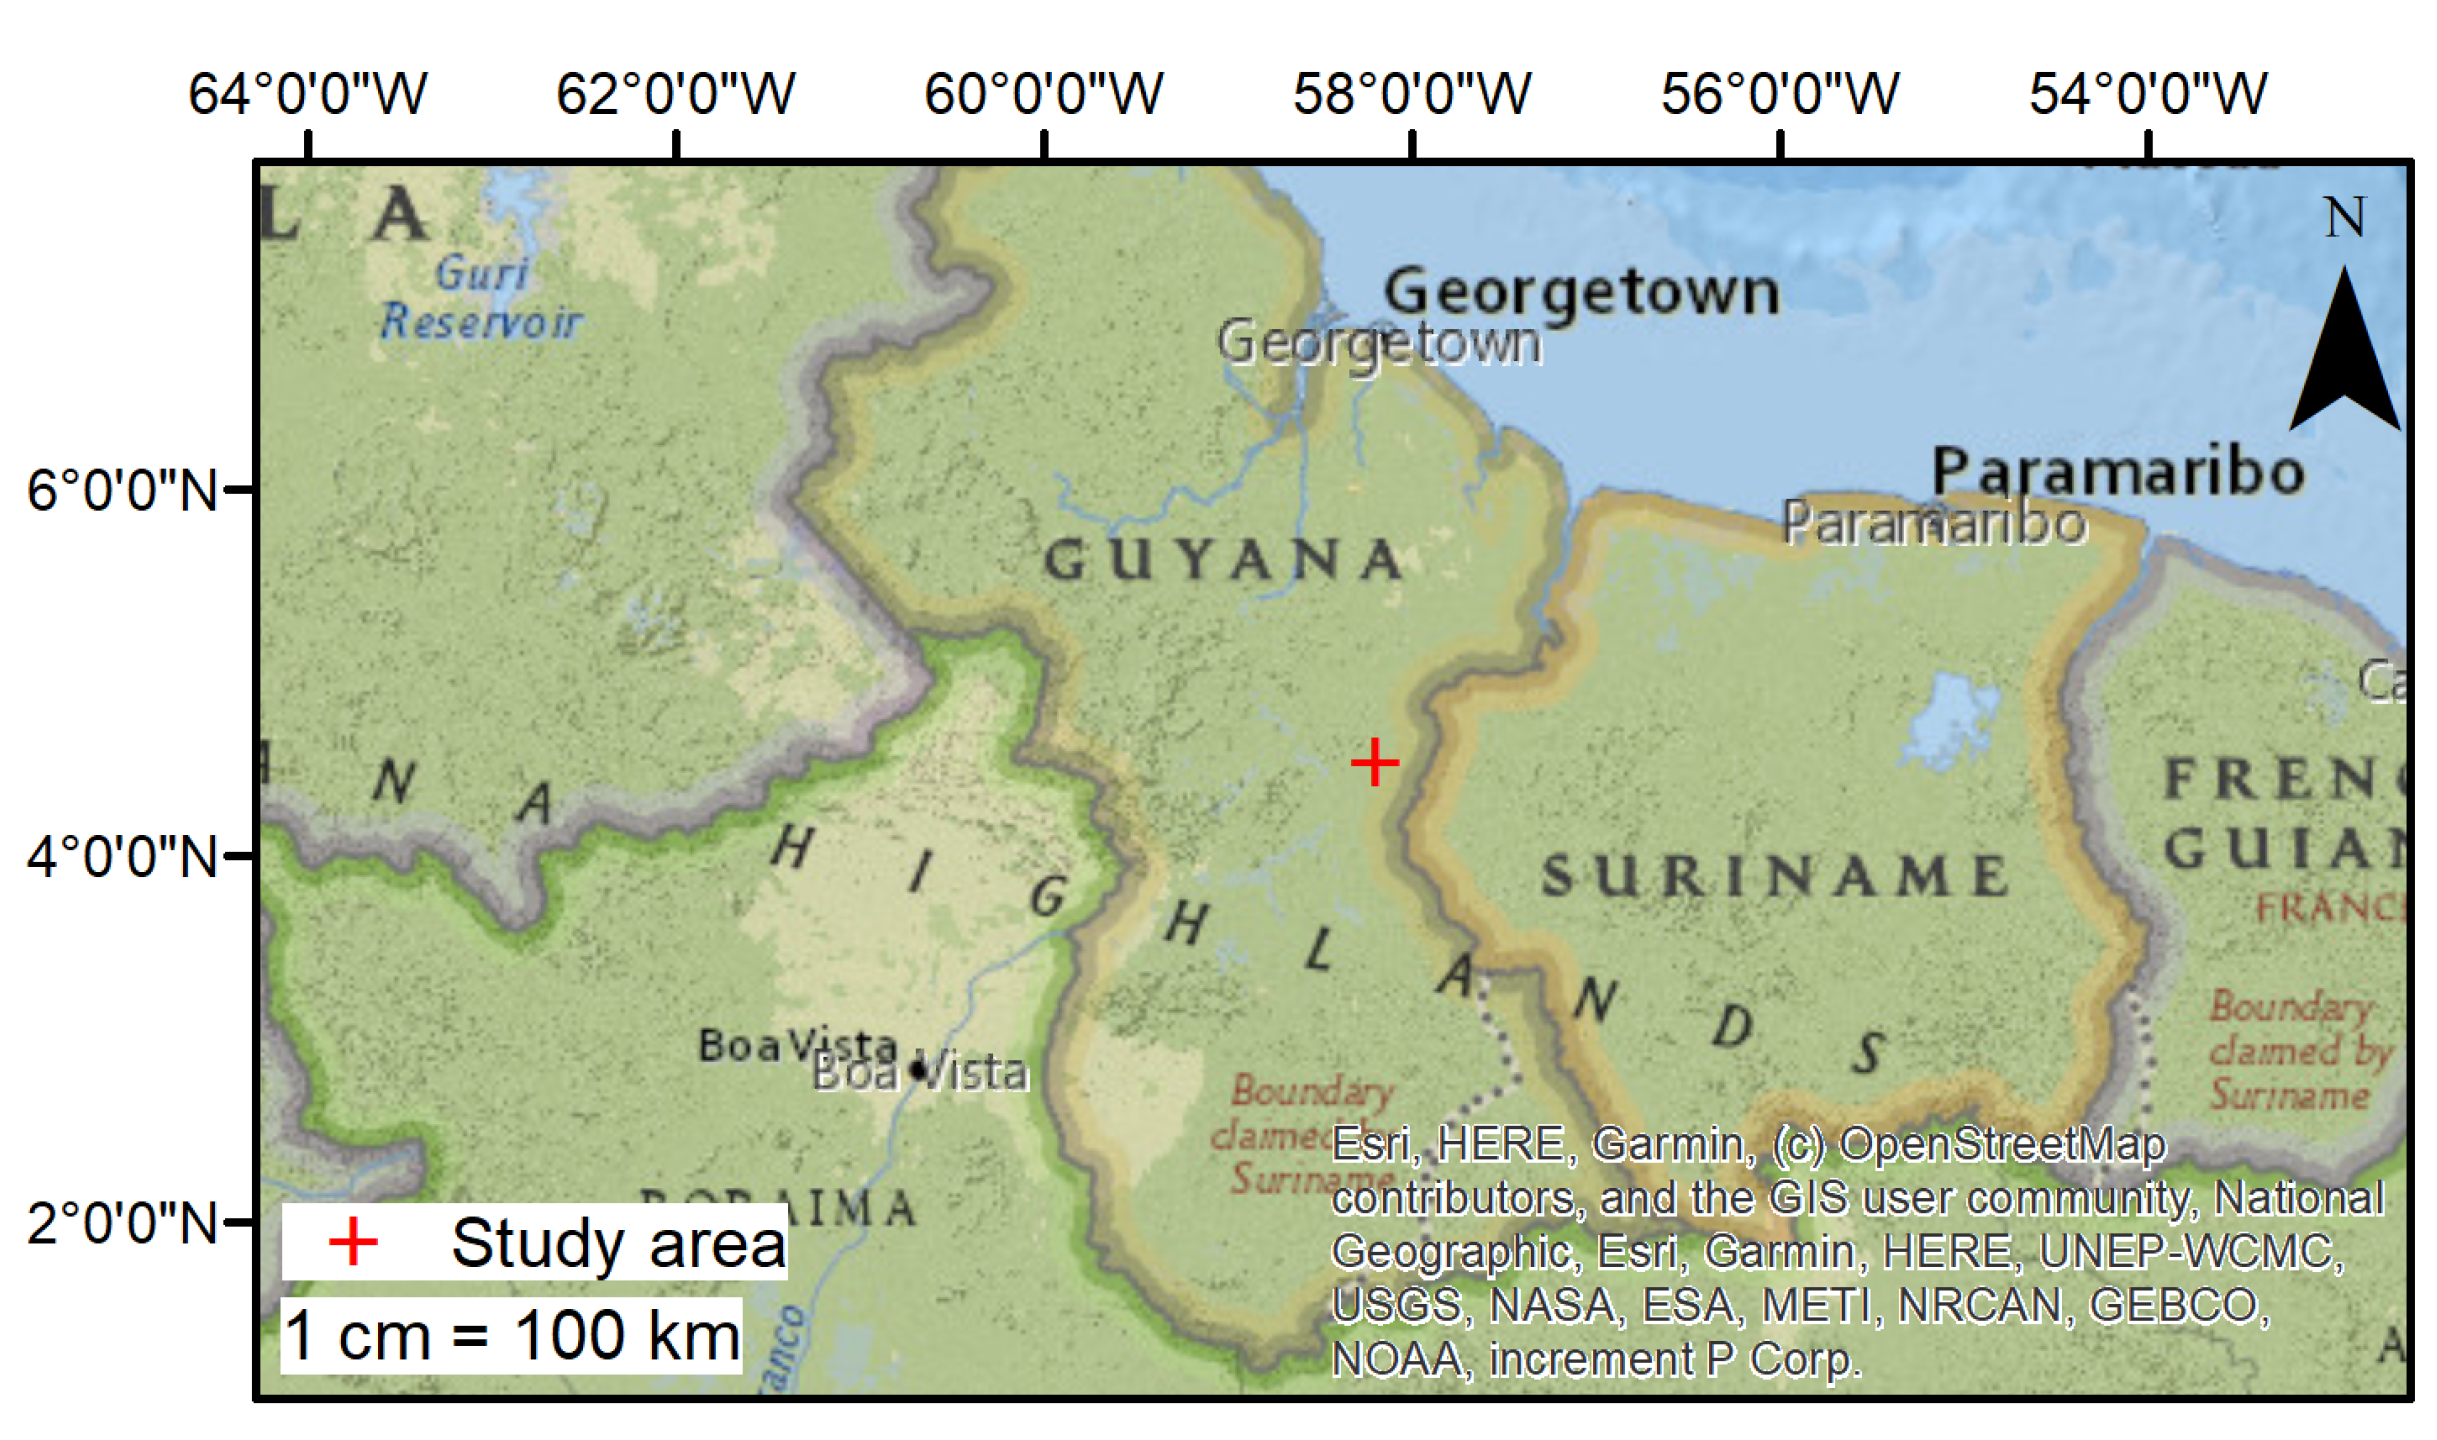
2.1. Study Area

Field work was conducted January–February 2017 inside an active logging concession near the Berbice river in the East Berbice-Corentyne Region of Guyana (4.48 to 4.56 lat and −58.22 to −58.15 long ; Figure 1). Located at 106 masl, the study area is a mixture of white sand plateu and mixed forest [37]. The region is dominated by evergreen trees [37], with an an average precipitation of 3829 mm yr 1 , an average temperature between 22.5 and 30.5 C , and an average humidity of 86% [38].

2.2. Tree Selection and Data Collection

2.2.1. Tree Inventory

An exploratory survey of the area was performed as a guide to sample the species composition of the forest. We grouped our trees into five diameter (D) size classes (10 ≤ D < 30, 30 ≤ D < 50,…, D ≥ 90 cm ) and inventoried 15 to 23 trees per size class. A total of 106 trees were inventoried and scanned in 37 plots with TLS across a large range of tree sizes (D 11.2 to 149.8 cm ), families (26), and species (50). Of these, 26 were destructively sampled and other 8 were discarded due to poor point cloud quality. We measured D and point of measurement (POM) of D, total H, C D , and recorded species, stem damage, and any irregularities. Total H and C D were measured with a Nikon Forestry-Pro hypsometer. Total H was measured from the base of the tree to the top [39] and C D was measured as the mean of the projected tree edge N-S and E-W [40]. An experienced local taxonomist matched reported local names with scientific names (Supplementary Material S.1).

2.2.2. TLS Data Acquisition

All TLS datasets were acquired using a RIEGL VZ-400 3D terrestrial laser scanner (RIEGL Laser Measurement Systems GmbH, Horn, Austria). We scanned at each position with a resolution of 0.04 ° , following the suggestion by Wilkes et al. [23]. The TLS data acquisition and plot sampling design can be found in Supplementary Material S.2.
From our full field inventory (a total of 106 trees), 26 trees were destructively sampled trees and removed from the TLS dataset to serve as validation data. We inspected the point clouds of the remaining 80 trees and discarded 8 trees whose point clouds were poor due to understory occlusion. Thus, 72 trees were used in our TLS database to build allometric models.

2.2.3. Destructive Harvesting and Fresh Mass Sampling

Twenty-six trees were selected and destructively sampled to serve as validation data. This selection was based on diameter class, species, and wood density to maximize the number of species sampled and avoid selection biases; all other characteristics (e.g., commercial value, trunk or crown form, hollowness, structural damage or any other irregularities) were ignored—following Goodman et al. [5]. After felling each tree, we re-measured D and H (denoted with the prefix post-harvest) and weighed each part in situ. Each part was separated and weighed. The fresh mass was measured directly in the field. Larger and non-irregular stems and very large branches were measured through volume estimation. We measured length, top diameter, and bottom diameter of any hollow sections.
We collected three wood samples from each part of each tree to estimate water content. Samples were weighed immediately in the field, labelled, and air dried during the field campaign. Samples from the bole, stump, and large branches (when volume was measured) were also used to determine wood density. For this, measured fresh volume of each wood sample by water displacement. Detailed information of the fresh mass sampling procedure can be found in Supplementary Material S.3.

2.2.4. Laboratory Analysis

We transported all wood samples to the laboratory at the Guyana Forestry Commission (Georgetown, Guyana) for species identification, drying, and storage. Wood samples were oven dried (101 to 105 C until they reached a constant mass)—as in Williamson and Wiemann [41]—and re-weighed. Detailed explanation of the laboratory work can be found in the Supplementary Material S.3. Wood density was calculated as dry mass per fresh volume; and dry mass fraction (dmf) was the ratio dry to fresh mass.

2.3. Diameter, Tree Height and Crown Diameter from TLS Data

TLS-derived D was calculated from cross sectional point clouds (6 cm width) taken at every 10 cm on the Z-axis up to 6 m height. Least square circle approach was used to fit circles in each cross sectional point cloud as in Calders et al. [17]. We automatically determined POM by analysing the angle between two consecutive diameters, starting from the bottom. The first angle within 1 of 90 (i.e., vertical) was considered as the POM. Total height was estimated as the distance between the maximum and the minimum point in the Z-axis from each tree point cloud. Crown diameter was estimated as the average of two horizontal distances between the maximum and the minimum point in the X- and Y-axis from each tree point cloud.

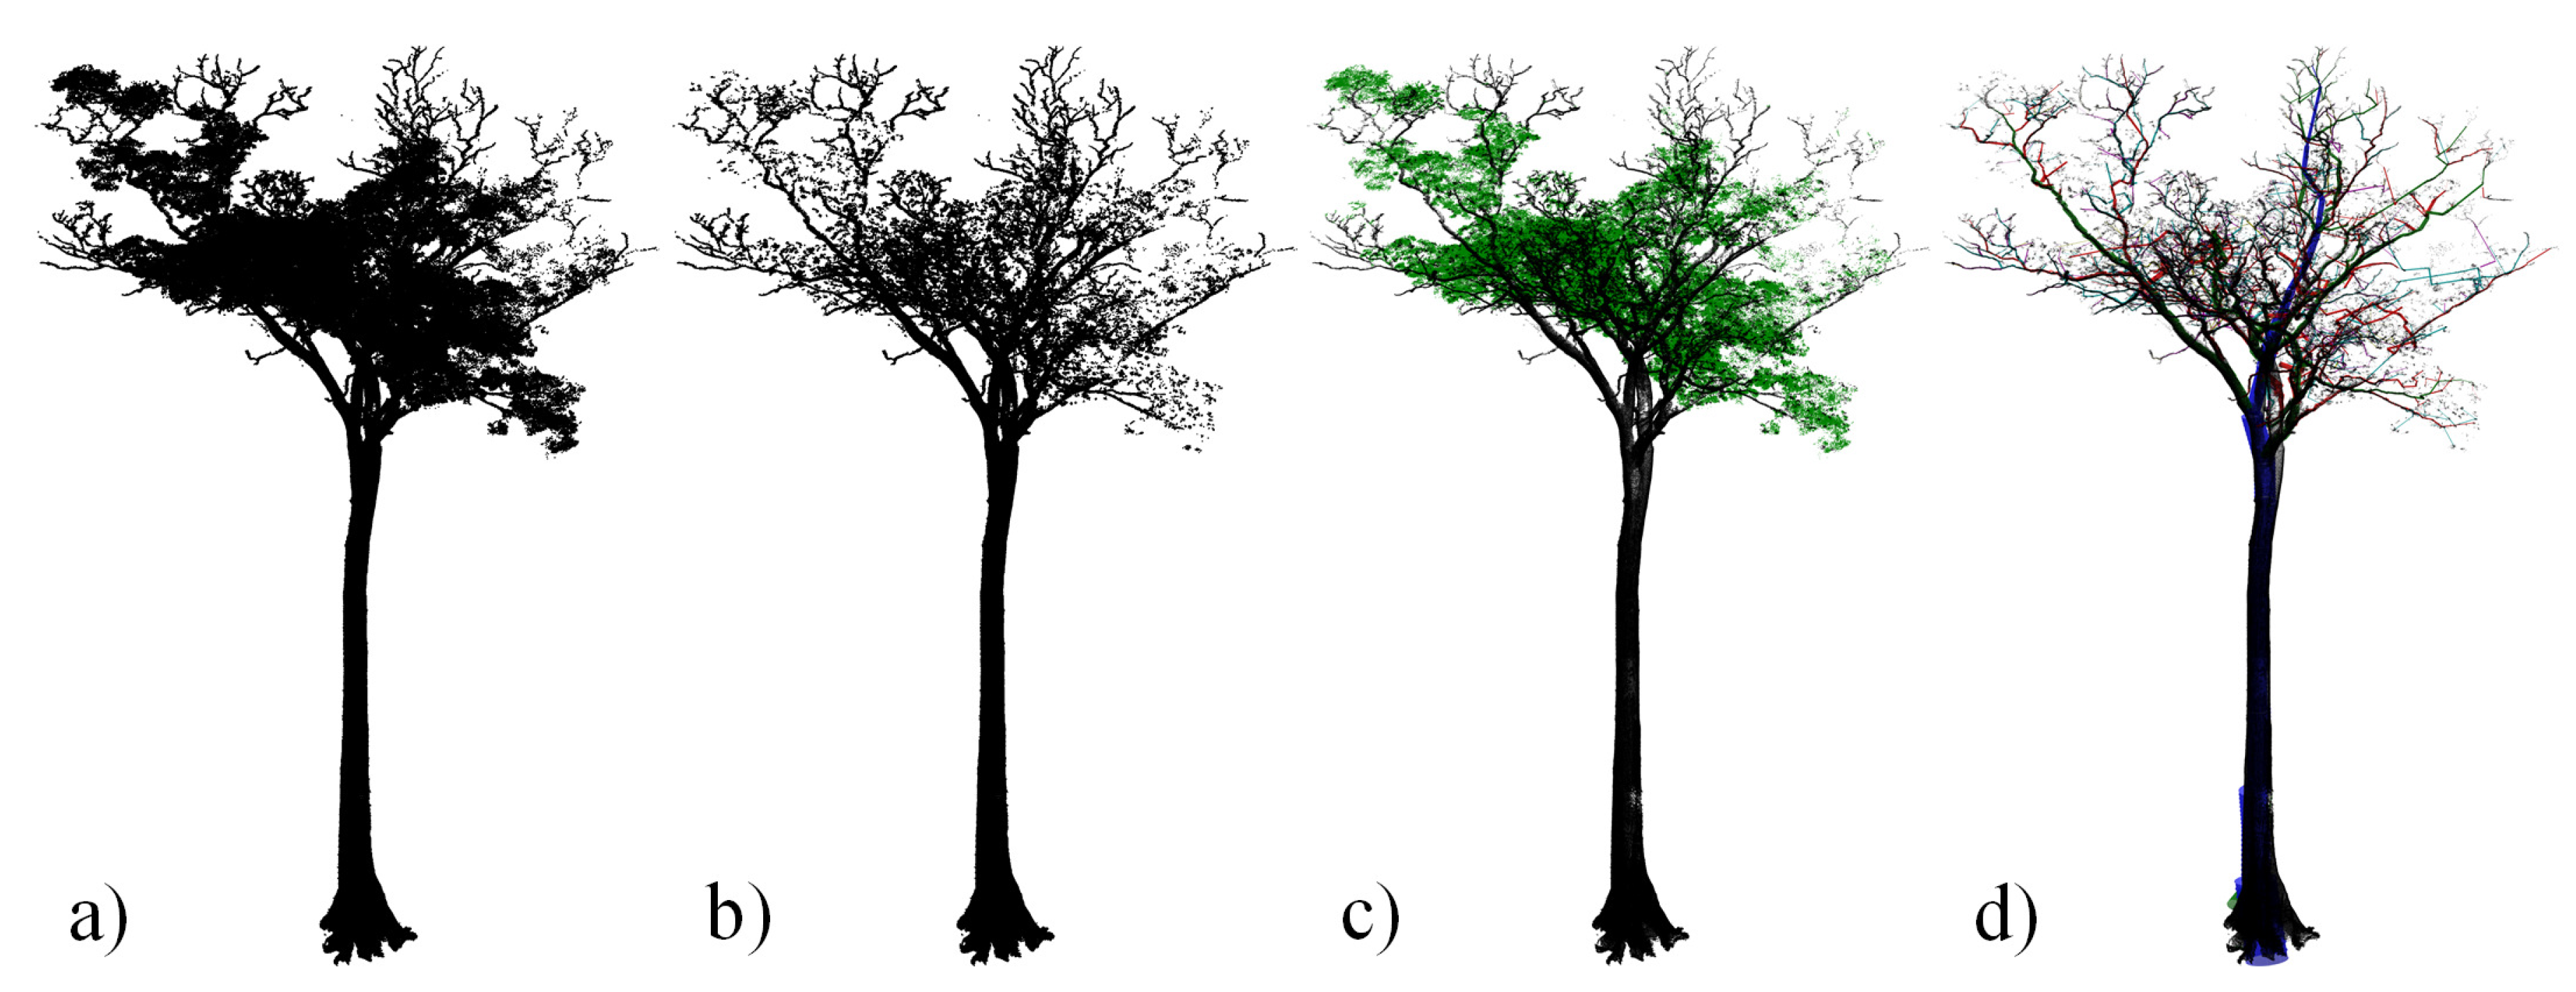
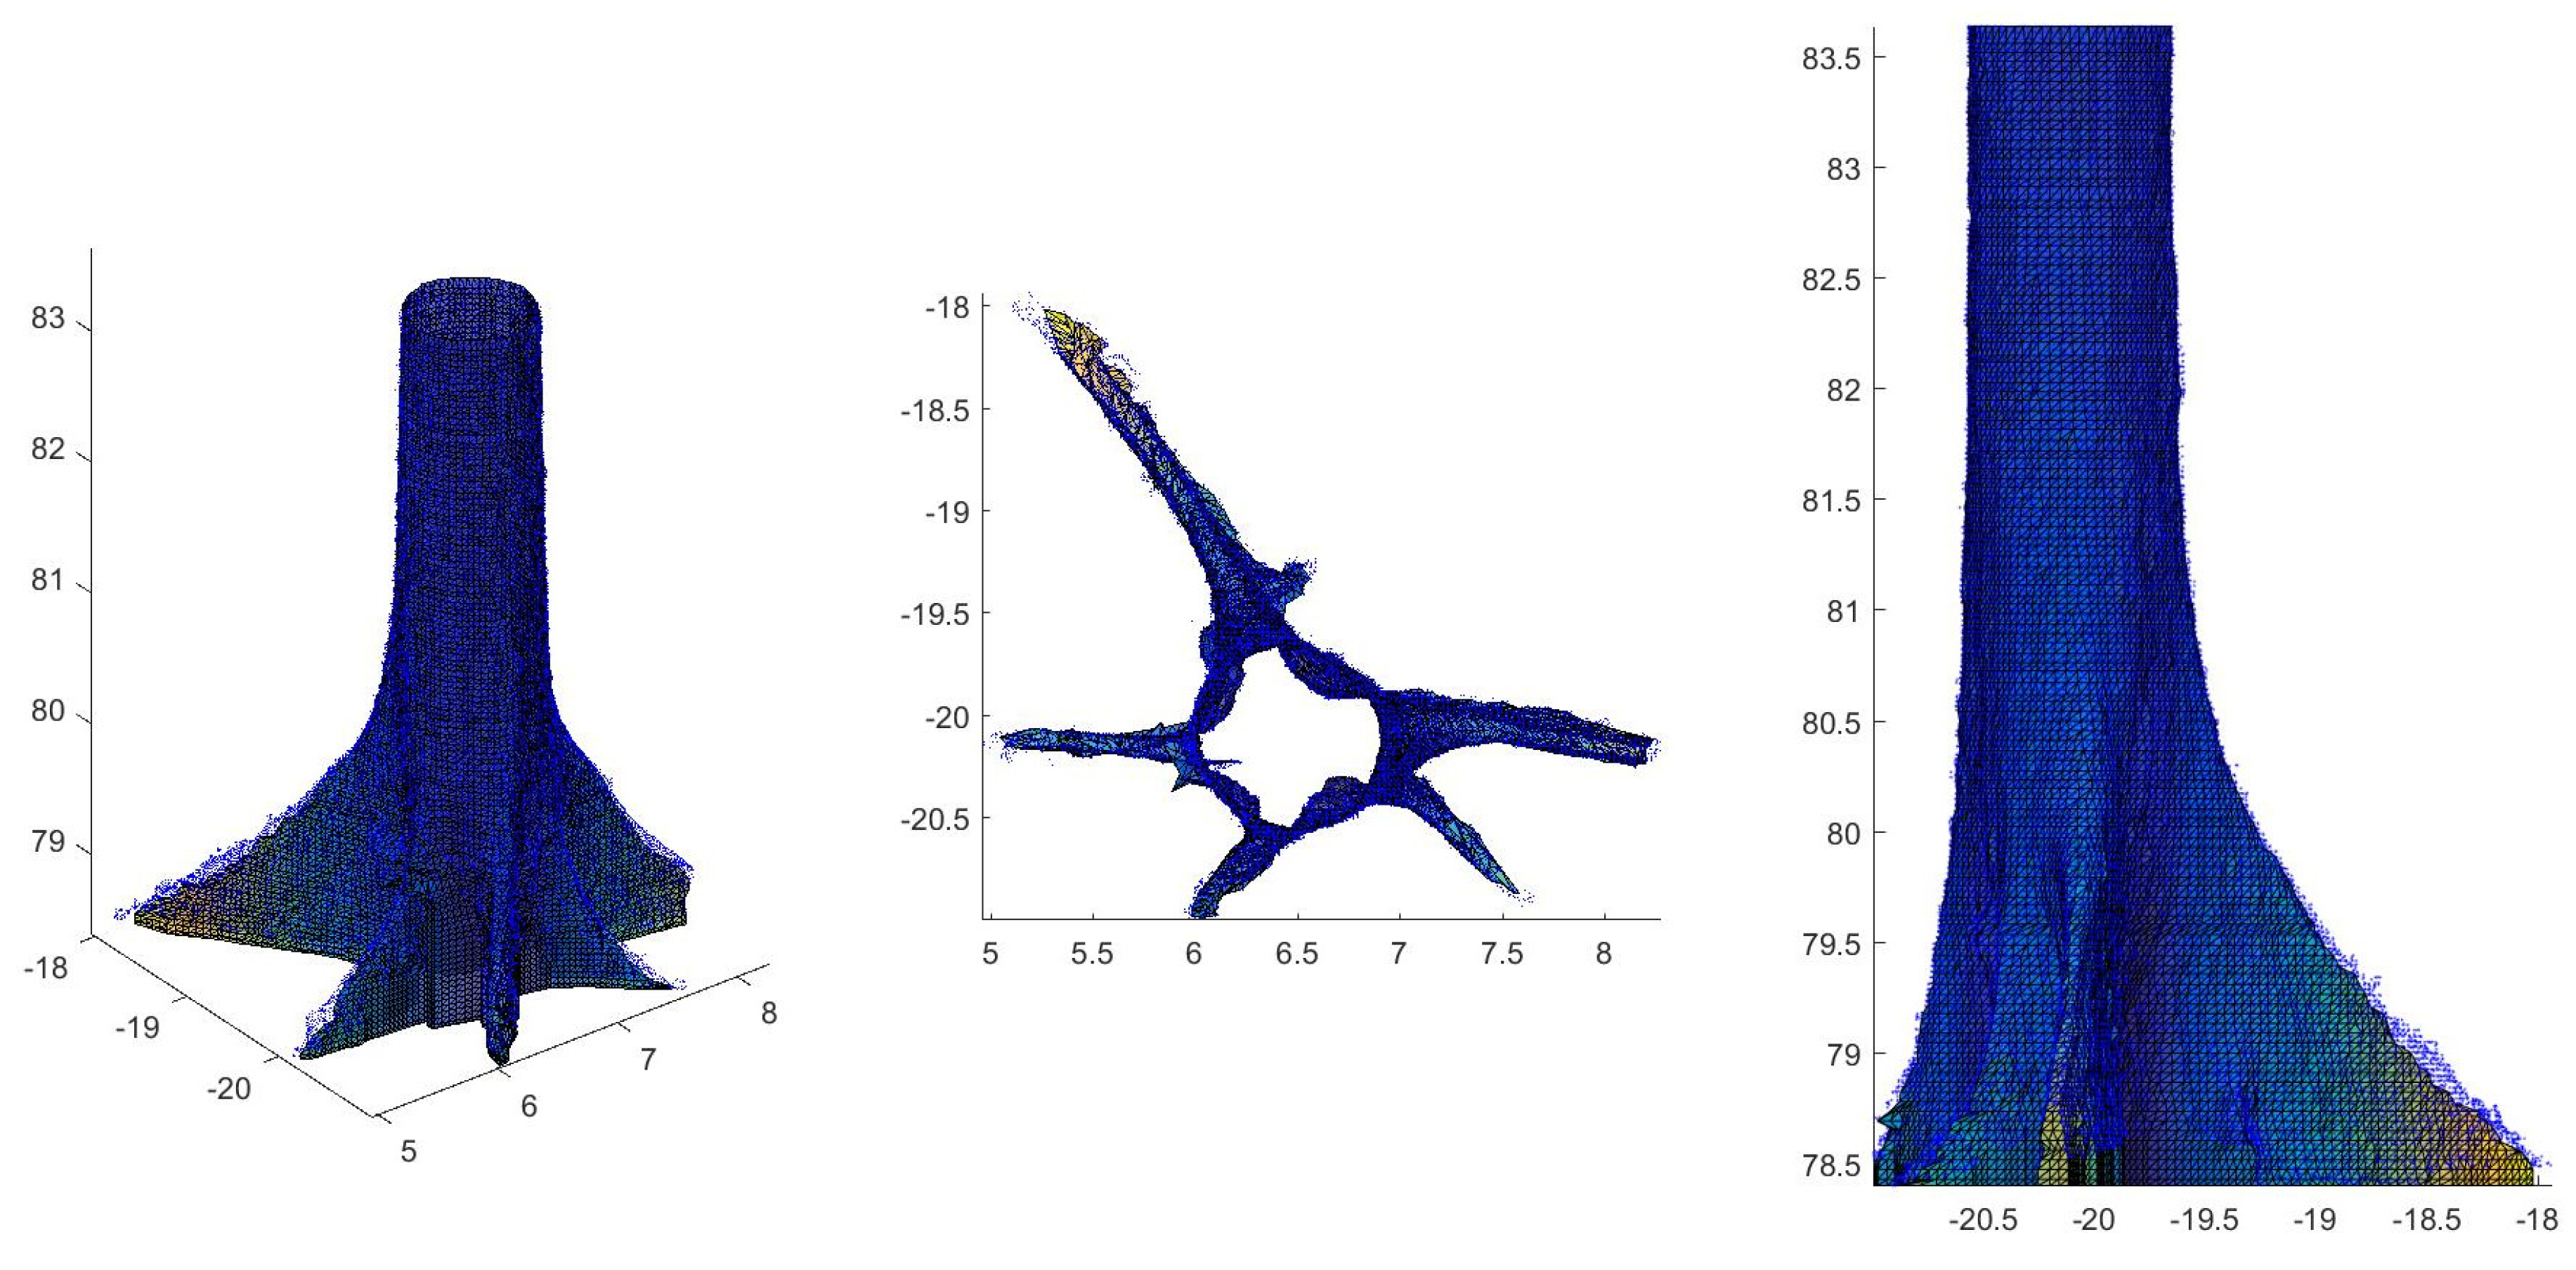
2.4. Tree Volume and Biomass from TLS Data

We estimated tree wood volume from 3D quantitative structure models (TreeQSM version 2.0; [17,18,33]) from our reconstructed 72 trees. W D values were assigned to each species or genus according to Global Wood Density Database [8,9]. To obtain tree volume, we had two main components: (i) semi-automatic individual tree extraction from TLS plots (Figure 2a–c), and (ii) 3D reconstruction of QSMs for individual extracted trees (Figure 2d and Supplementary Material S.4).
Once we extracted the trees, we reconstructed their volume with cylinder features using the automated framework presented in [17] to optimize QSMs. We optimized cover patch size (d) by reconstructing the volume using a d range from 0.02 to 0.09 m with a 0.005 m increment and a minimum number of points per cover patch nmin of 4. The optimization process returned the most suitable d for each tree based on least square fit process and 20 models were reconstructed on average. The heuristic decision to accept/reject was taken based on analyst’s experience and judgement (Figure 2d; [17,18]).
For 43 trees with large buttresses (selected by POM ≠ 1.3 m , visual inspection, and author’s expertise), a triangular mesh was used for the volume modelling in the bottom part of the stem rather than cylinders (Figure 3; see Disney et al. [22]). The volume of the mesh replaced the volume of the cylinders on the total tree volume estimation.
Finally, to estimate AGB, we multiplied the total tree volume with the corresponding wood density. As an indicator of the reconstruction accuracy of the TreeQSM, root mean square error (RMSE) was calculated to measure the difference between the reference and modelled AGB; R 2 was used to judge the fit of the TreeQSM models; concordance correlation coefficient (CCC; Lin [44]) was calculated to compute the agreement on a continuous measure obtained by two methods; and the coefficient of variation of RMSE (CV RMSE) was calculate to measure the difference between our TLS-derived AGB and reference AGB [17,18].

2.5. TLS-Derived Allometric Models

We examined five model forms (Table 3) based on previous forms developed by Chave et al. [12] and Goodman et al. [5] using TLS-derived attributes (D, H, and C D ) and W D to test the relevance of these attributes to predict AGB. To build the allometric models, all data were transformed to the natural logarithm to comply with allometric theory and meet the assumptions of linear regression. The models were built using least-squares linear regression and the attributes were removed using backwards stepwise regression to produce a minimum adequate model in the statistical program R [45]. We tested the assumptions of the final five models. We tested for normal distribution of the residuals using Q-Q plots and Anderson-Darling test to assess independence, and plots of residuals against fitted values to assess homogeneous variance and linearity.
We used a paired t-test to analyse whether the TLS-derived attributes were different than our post-harvested field measurements. If TLS and field-based measurements differed significantly, a calibration factor was applied to the input attribute.
We also tested whether there were significant differences between models built using field measurements or TLS-derived data. We built models using both sets of data with data source as a dummy variable. When the dummy variable was significant, we applied its attribute estimate (Reference Dummy Variable Corrector; RDVC) to the corresponding model form to modify the TLS built models.

2.6. Tree Aboveground Biomass Estimation from Pantropical Allometric Models

Structural (D and H) and W D data from the 26 harvested trees were used to estimate AGB from pantropical allometric models (Table 1). We estimated AGB and error using the most widely used pantropical allometric models (Eqn. Ch05.II.3, Ch05.I.5, Cha14.H and Ch14.E) for moist forests [11,12] and an updated version of Ch14.E. This revised version (Eqn. Rj17.E) is a direct model fit equation, while the original equation Ch14.E was obtained by merging two equations [46].

2.7. Assessment of Allometric Models

We made two types of assessment. First, we evaluated the log-transformed models based on the fit of the data used to build the models. For that, we evaluated the models by using a penalized likelihood criterion on the number of attributes: adjusted R-square ( R 2 ), corrected Akaike’s information criterion (AICc), the coefficient of variation of RMSE ( C V R M S E ), and residual standard error (RSE). Goodness of fit is indicated by high R 2 and low AICc, CV RMSE, and RSE. To estimate AGB values (in M g ) a correction factor ( C F = e x p [ R S E 2 / 2 ] ) was applied to backtransform predicted values and remove bias from the log-transformed data [47].
Second, we assessed the ability of our allometric models to predict AGB (Table 3) and compared them to five pantropical allometric models (Table 1). We validated these AGB estimates with field-measured reference AGB using the metrics listed below: model error (Equation (1)) and relative error (Equation (2)).
A G B e r r o r ( M g ) = A G B e s t A G B r e f ,
A G B r e l a t i v e e r r o r ( % ) = A G B e s t A G B r e f A G B r e f · 100
where A G B e s t is AGB predicted by each model, A G B r e f is the AGB calculated from our destructive sampling, m e a n e r r o r is the average of A G B e r r o r for all 26 trees, and m e a n r e f is the average of A G B r e f . We calculated these metrics for our entire harvested tree dataset (n = 26) and subsequently split this data into small (D ≤ 70 cm ; n = 17) and large (D > 70 cm ; n = 9) trees. We used both assessments to identify our “best” model(s).

3. Results

3.1. Tree Attributes and Estimated Biomass

A total of 72 trees were used to build allometric models based on TLS-derived data (Table 2 and Supplementary Material S.5). Six harvested trees had hollow sections in the bole.
Our study found a systematic difference between the three measurements for D in our dataset of 26 validation trees (p-value < 0.05; Table 2; Figure A1a,c of Appendix A): mean values were 59.4, 57.7, and 55.2 cm for pre-harvest, post-harvest, and TLS-derived diameters, respectively. Using post-harvest field measurements as the reference data, we calibrated the TLS-derived D estimate (Figure A1c). Neglecting to adjust the systematically lower TLS-derived D would result in a systematic overestimation of AGB when applying TLS-derived allometric models with field measurements diameters. The TLS-derived attributes (H and C D ) and AGB were not significantly different from our reference data (p-value > 0.05; Figure A1d–f). However, post-harvest H measurements were significantly taller than pre-harvest H measurements taken on standing trees (p < 0.05; n = 26; Figure A1b). W D values from our measurements and the GWDD were similar (our values were 1% greater; Supplementary Material S.6). Finally, there was no systematic difference between AGB estimated from TreeQSM and our destructively-sampled reference data (Figure A1f).

3.2. Allometric Models Using TLS-Derived Measurements

We created five allometric models using combinations of the TLS-derived attributes D, H and C D and W D from the GWDD (Table 3). For models using C D (m4 and m5) we found that the residuals were not normally distributed using Anderson-Darling test. Upon further visual inspection of normal quantile-quantile plots, we considered the residuals to be reasonably normally distributed and that these models are reliable (Supplementary Material S.7). For model forms m2 and m3, models built using field and TLS-derived data were significantly different (p < 0.05), thus we applied RDVC to the TLS models (Table 3).

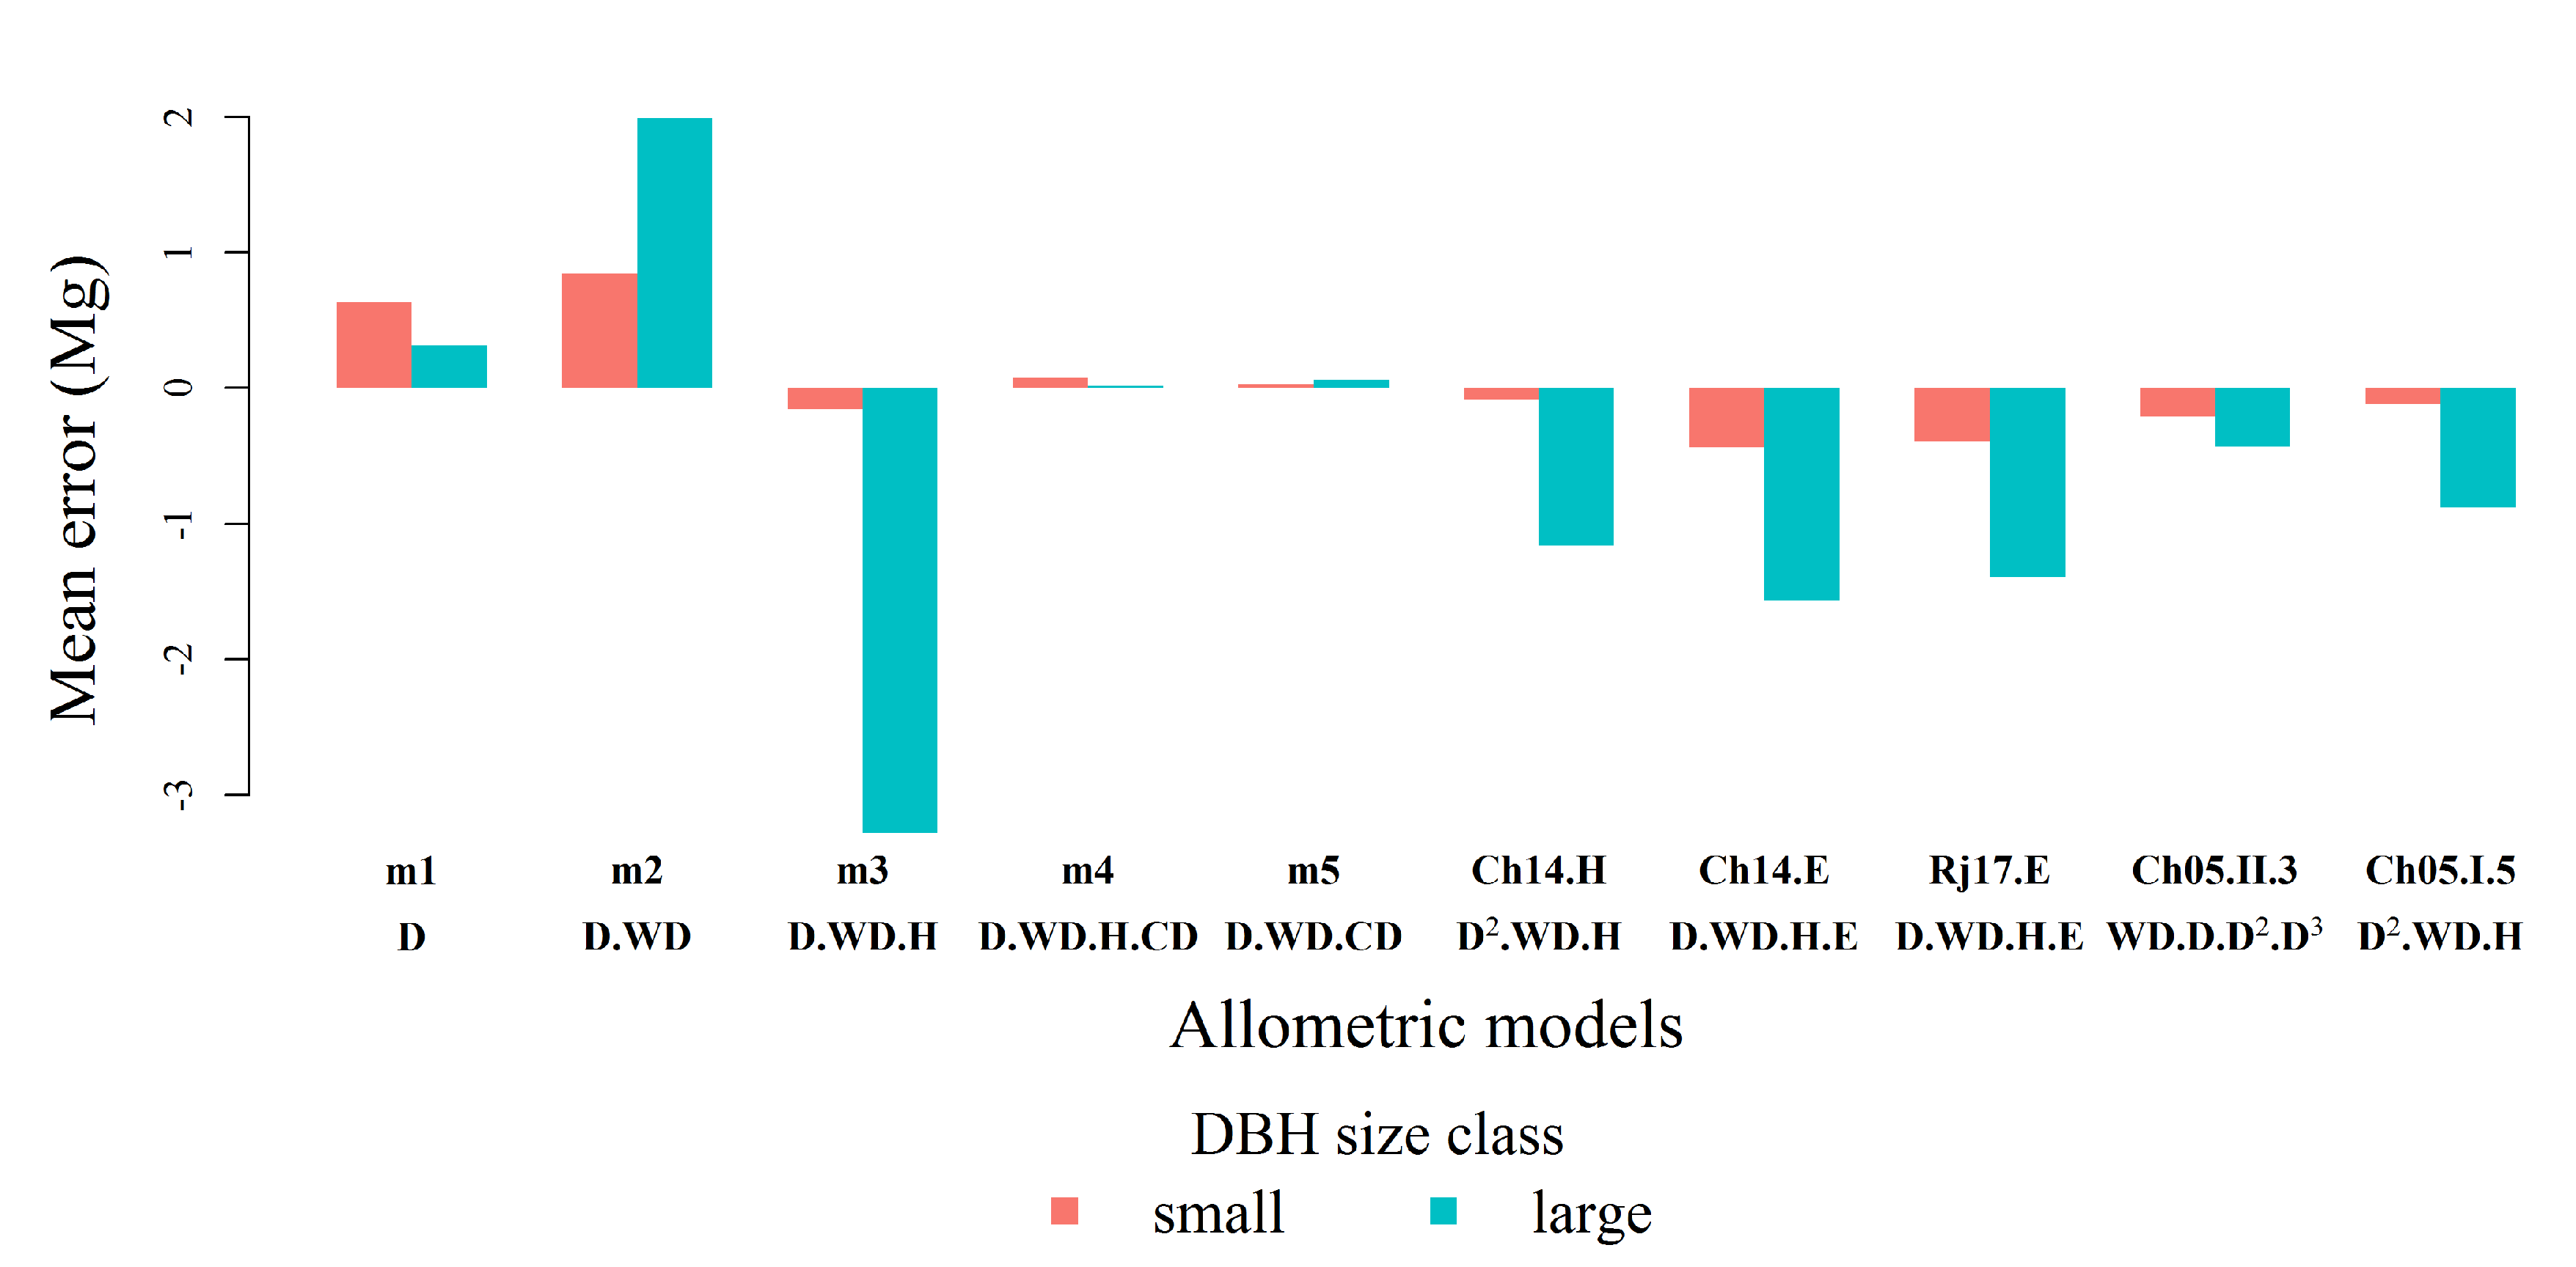
3.3. Evaluation of Allometric Models

We assessed how well the five TLS-derived allometric models developed in this study and five pantropical allometric models estimate AGB of our destructively-harvested reference data on the original scale (in Mg ; Figure 4 and Table 4). Results were similar to the assessment done on the log-transformed scale, and our models including C D estimated AGB better than all other models. On the original scale (Table 4), AGB estimates from TLS-derived allometric models were slightly better ( R 2 0.87–0.93; CCC 0.89–0.96) than the pantropical models assessed ( R 2 0.85–0.89; CCC 0.92–0.94). However, TreeQSM models m4 and m5 outperformed the pantropical models (CCC = 0.96, R 2 = 0.92, CV RMSE = 33%). Pantropical models showed slightly lower level of agreement (CCC = 0.92–0.94); with a R 2 ranging 0.85–0.89 and CV RMSE ranging 37–44%.
Our TLS-derived allometric models with C D performed better than all other models in terms of R 2 , RMSE, CCC, and absolute errors (Table 4 and Figure 4). The pantropical models tended to underestimate AGB but had lower relative errors (Table 4 and Figure 4). In contrast to the model evaluation with the 72 TLS-trees on the logarithmic scale, m5 (without H) performed slightly better than m4 (with H). By several metrics, model m2 and m3 performed the worst of all models evaluated. Adding W D and H to model m1 (with D only) did not improve estimates. In fact, adding these attributes increased overall error. However, adding C D to models with W D and H improved estimates by all metrics. Adding H to models never improved their accuracy. In both cases, models m5 vs. m4 and m3 vs m2, the model without H performed better than the counterpart model with H.
Among the pantropical models, Ch05.II.3 with just D and W D , had the highest R 2 and CCC and the lowest RMSE, but it slightly underestimated AGB (Table 4 and Figure 4). The two models including the “environmental stress” attribute (E; Ch14.E and Rj17.E) produced the largest underestimates of AGB in absolute terms but lowest relative error (Table 4). Pantropical models including H (Ch05.I.5 and Ch14.H) also underestimated AGB and were, by several metrics, the least accurate among all models evaluated (lowest R 2 , lowest CCC, and highest RMSE).
Because allometric models often over- or underestimate AGB differently systematically with tree size, we also assessed the performance of the TLS-derived and pantropical models for small trees (D ≤ 70 cm ; n = 17) and large trees (D > 70 cm ; n = 9) separately (Figure A2). The inclusion of C D in the models reduced error in AGB estimates for both size classes, but the effect was much more substantial in the large trees. The mean error of TLS-derived models m4 and m5 is very close to zero for both small and large trees, but mean relative error is very high for small trees (44%). The inclusion of H in TLS-derived models improved AGB estimations for small trees but reduced the accuracy of AGB estimates for large trees when compared to their counterpart model without H. All pantropical models underestimated AGB, and the underestimation is greater for large trees (Table A1).
For the most accurate AGB estimates in Guyanese forests, we recommend model m5 (Equation (3)), especially for large trees. AGB is measured in kg dry mass, D in cm , H and C D in m and W D in g   cm 3 . The back-transformation correction factor has been incorporated:
A G B = e x p ( 0.5669 + 1.8124 · l n ( D ) + 1.1512 · l n ( W D ) + 0.3877 · l n ( C D ) )

4. Discussion

4.1. Developing Allometric Models from TLS-Derived Attributes

This study presents the first assessment of the potential of TLS and TreeQSM to develop TLS-derived allometric models to estimate AGB for trees in Guyana and takes Guyana one step closer to its aim of developing a national MMRV system. Previous work by Gonzalez de Tanago et al. [18] tested TLS-derived tree volume estimates against field-based volume estimates and then converted to AGB wood density values from the Global Wood Density Database [8]. Here, we weighed trees directly to build our reference data and tested the effects of tree hollowness on the accuracy of TLS-QSM AGB estimates. We found that TLS-QSM AGB estimates were not biased, even with the presence of hollow and irregularly shaped trees.
This is one of the first studies to have explicitly used TLS-derived attributes and wood density to develop allometric models to estimate AGB of tropical trees. In a similar study, Stovall et al. [29] reconstructed 329 trees in Virginia, USA and found that TLS-derived allometric models predicted AGB better than national models. Another study, Momo Takoudjou et al. [26] calibrated an allometric model from Chave et al. [11] using TLS tree point clouds from a semi-deciduous forest in Cameroon and yielded a good fit ( R 2 = 0.95). Both studies [26,29] used TLS-derived attributes (D and H) to predict AGB with accurate results. While one reconstructed AGB from coniferous trees [29], the other one was applied to tropical forest trees in Cameroon. Our results showed better results for TLS-derived allometric models that include C D compared to the pantropical models tested [11,12,46], which included trees from the same region (French Guiana, n ≈ 390 trees). In the absence of C D data, the oldest and simplest of the pantropical models (Ch05.II.3) provides the most accurate AGB estimates in this region. This is one of the first studies to have explicitly used TLS-derived attributes and wood density to develop allometric models to estimate AGB of tropical trees.

4.2. Choosing the Adequate Tree Attributes for Allometric Models

Recent studies have highlighted the relevance of including crown dimension in allometric models [5,15,48]. Models including C D had the highest R 2 in Goodman et al. [5] and Jucker et al. [48] and lower bias [48]. These authors had independently agreed that C D improves tropical tree biomass estimates, especially for large trees (D > around 100 cm in Goodman et al. [5] and Ploton et al. [15]; and ≥10 Mg for Jucker et al. [48]). From our results, we found that allometric models using C D provide better AGB estimates for trees in Guyana, especially for large D size classes (Figure A2). While crown diameter is generally not collected in traditional forest inventories; UAV (unmanned aerial vehicles) with structure for motion algorithms allows you to delineate tree crowns [49]; increasing the potentiality of using crown models in allometric models.
Our results agree with Goodman et al. [5] that allometric models with H performed worse underestimating AGB than their counterparts without H in this region too. Goodman et al. [5] also found that models including H underestimated AGB and suggested the inclusion of C D instead of H in allometric models. Our results contrast those of Feldpausch et al. [10], in which their models with H performed better estimating AGB than models without H, and agree with Goodman et al. [5], which found that pantropical models that include H tend to be systematically inaccurate when applied to other locations.
We found significant differences in the pre-harvest, post-harvest, and TLS-derived D and H values, demonstrating the difficulty and ambiguity of measuring the diameter and height of tropical trees, as seen in Table 2. While it is nearly impossible to say what “true” and repeatable diameter above buttresses and total H are, TLS offers new insights. For example, even with rigorous protocols, determining the top of buttresses is a judgement call, and our data show variation in measurements on standing and felled trees. Pre-harvest D measurements were significantly higher, reflecting the difficulty of measuring high above the ground; and post-harvest measurements were much more conservative. Our novel method of determining D from TLS point clouds was perhaps too conservative but probably more repeatable. It is important to note that conservative D measurements yield conservative AGB estimates from allometric equations, but the opposite is true when building allometric models.
Measuring tree height in tropical forests is notoriously difficult, especially for trees above forest canopy. In Hunter et al. [50], the precision of repeated height measurements from the ground ranged from 3 to 20% of the total height, which resulted in 16% mean error of AGB estimates. In our study we did not record repeated measurements, but our pre-harvest height measurements were on average 10% lower and TLS-derived measurements were 2% lower than our reference (post-harvest) heights. Pre-harvest measurements had a greater variation and higher underestimation than our TLS-derived height. A novel alternative for would be to use a UAV-LS (UAV laser scanning) to estimate tree height and crown diameter. Brede et al. [51] were able to derived D and canopy height models using a RIEGL RiCOPTER with VUX ® -1UAV and compared those with a RIEGL VZ-400 TLS with high agreement for DBH (correlation coefficient of 0.98 and RMSE of 4.24 cm ). However their study area was composed mostly by European Beech (Fagus sylvatica) and future work is needed to explore UAV-LS techniques in tropical forests.

4.3. Local or Pantropical Allometric Models?

We also estimated AGB for our trees using five well-known pantropical models (Table 1), showing that all five models underestimated AGB. Our results contrast with some studies and support others that used pantropical models for local studies. In Colombia, Alvarez et al. [4] found that using Chave et al. [12] moist pantropical equations (with and without H) all overestimated AGB (with relative errors up to 52.8 % ); while Gonzalez de Tanago et al. [18] found that AGB was underestimated 15.2 to 35.7% when compared to estimated AGB from TreeQSM models in Guyana, Indonesia, and Peru. As in Alvarez et al. [4], Kuyah et al. [52] found that AGB in Kenya was overestimated in 22% using Chave et al. [12] moist forest equation (with H) and suggested that overestimations were due to the dominance of small trees (D < 10 cm ) and lack of larger trees in their plots. We theorized that with more trees scanned, we could understand the reasons for these differences. When disaggregating by diameter size, we found that pantropical models tended to underestimate small and large trees (Figure A2). This matches Chave et al. [12], whose models tended to underestimate small trees. Our results are also aligned with Chave et al. [11], insofar as their models tended to be fairly accurate with medium size trees, and underestimate larger trees. In this study, our TLS-derived allometric models (n = 72) were based on 32 different species and 18 different families. Just one ha of tropical forest can have 300 different species [53]; thus, we aimed to cover all different tree species in our sample, with a more precise range of wood density and avoid bias by selecting few species.
Interestingly, our study also showed that locally developed allometric models are not always better than pantropical allometric models. We found out that the pantropical allometric model Ch05.II.3 (without H) consistently performed best ( R 2 = 0.89) among the other pantropical allometric models assessed in this study ( R 2 = 0.85–0.88) and even better than some of the TLS-derived allometric models developed (m1, m2, and m3). Thus, our approach can be used also to select the most appropriate allometric model available without the need of destructively harvested validation data. Moreover, our best TLS-derived allometric models (m4 and m5) estimated the AGB of large trees (D > 70 cm ) very accurately, with mean AGB overestimate of just 1%, while the pantropical models assessed yielded mean underestimates between 4 % and 24 % (Table A1). This is of much relevance due to the significance of large trees to total forest biomass [14,15,16] and the fact that pantropical allometric models systematically underestimated large tree biomass [5,17,18].

4.4. Challenges and Outlook

Scanning tropical trees in situ remains challenging, not only because of the harsh environment but also because the novel sampling design we developed for this study (Supplementary Material S.2.3). In our study, we increased the scanning resolution from 0.06 to 0.04 (Supplementary Material S.2.1) as suggested by Wilkes et al. [23] to balance trade-off between accuracy and scanning time requirements. Gonzalez de Tanago et al. [18] and Lau et al. [54] pointed out that low-density point clouds created unrealistic branching reconstructions (i.e., where cylinders were constructed due to low point cloud density rather than actual branching). Still, we discarded 8 tree point clouds due to under-story occlusion. Occlusion by dense vegetation might reduce TLS acquisition range and future TLS campaigns in tropics will cope with occlusion; either increasing their sampling rate, using a different type of TLS (single or multiple returns), or increasing their scanning resolution [17,23]. Because a detailed analysis of quality of tree point clouds is usually undertaken after the fieldwork, we suggest scanning 10% more trees than the desired sample size in case some trees need to be removed due to poor quality.
Our methodology provided unbiased AGB estimates regardless of tree structure, even with partially hollow and irregular stems. However, we suggest that this outcome is further tested with destructively harvested data from other forests. In Guyana, developing a national monitoring system based on the now known most appropriate pantropical model or their own national model could contribute to more accurate biomass estimates for REDD+ MMRV. Our results demonstrated that TLS-derived AGB estimates can be used as a decision-making tool in MMRV selection of an adequate pantropical allometric model, and in case TLS-derived allometric models using C D are out of scope, Ch05.II.3 would be an adequate model (on average conservative and reasonably accurate).
Being able to obtain TLS-derived AGB estimates without destructively harvesting trees is also environmentally desirable. We are able to quantify AGB for trees that would be illegal, expensive, impractical, or simply unnecessary to harvest. We are aware that our methods and analyses require expensive equipment and expert knowledge, but the process is much faster, less labour intensive, and more environmentally sustainable than destructive harvesting, especially for large trees. Research has already begun to semi-automatize the modelling processes by separating individual trees [55] and segregating wood from soft tissues [22].
With the advances on tree segmentation algorithms [42,56], the modelling of trees is being semi-automatized. Tree segmentation algorithms would allow us to segment and estimate AGB using TreeQSM for entire TLS scanned forest plots. While this is a case study of creating site-specific allometric models for Guyana, we showed that TLS-derived allometric models (including C D ) can be an unbiased estimator of AGB, even in a logged forest where a high proportion of the remaining trees were damaged and hollow. Our method’s potential to rapidly produce large, unbiased calibration tree datasets is of great significance to remote sensing missions, which rely on field data for their calibration. With TLS and 3D modelling, plot-level AGB could be estimated directly, and these plots could be used as calibration sites for upcoming satellite missions. However, this is a major undertaking. As mentioned by Disney et al. [57], data acquisition standardization, automatization of processing, and more accurate 3D reconstructions are needed first to narrow the bridge between TLS and remote sensing space missions. We strongly encourage other studies to expand upon our findings to determine whether TLS always provides unbiased AGB estimates and could replace destructive sampling in the future.

5. Conclusions

We advanced TLS methods to estimate tree metrics and explored the accuracy of field and TLS-derived data to develop local allometric models for Guyana. We showed that AGB from TreeQSM estimations were not biased. Moreover, we found that allometric models can be built from TLS-derived tree volume and wood density, even with the occurrence of hollow and irregular stems. We demonstrated that tree AGB estimates from TLS-derived allometric models including crown diameter (models m4 and m5) provide better agreement with reference data than AGB estimates from pantropical allometric models, especially for large trees (D > 70 cm ). AGB estimates from TLS-derived allometric models and pantropical models including H provided poor agreement with reference data when compared to their counterpart without H. The simplest pantropical model (Ch05.II.3 [12] with only D and W D ) provided very good estimates of our data. While our results are based on 72 TLS scanned trees, a small number of trees compared to other studies, our new approach can be further applied for developing allometric models without the need to harvest vast numbers of trees. Further, this new approach can be used to test and choose existing allometric models calibration remote sensing metrics to forest biomass, and improve the future estimates of forest biomass from tropical forest.

Supplementary Materials

The supplementary materials are available online at https://www.mdpi.com/1999-4907/10/6/527/s1.

Author Contributions

The authors contributed in the research as follows: conceptualization: A.L., R.C.G., and M.H.; methodology: A.L., R.C.G., H.B., and M.H.; data collection: A.L., R.C.G., H.S., and J.S.; formal analysis: A.L., K.C., R.C.G,. P.R., and M.V.; writing–original draft preparation: A.L. and R.C.G.; writing–review and editing: A.L., R.C.G,. C.M., H.B., and K.C.; visualization: A.L.; K.C., and P.R.; supervision: M.H. and C.M.; funding acquisition: M.H. and C.M. All authors contributed critically to the drafts and gave final approval for publication.

Funding

This research is part of CIFOR’s Global Comparative Study on REDD+ with financial support from the donors to the CGIAR Fund. A.L. is supported by the donors to the CGIAR Fund, SilvaCarbon research project 14-IG-11132762-350 and ERA-GAS NWO-3DforMod project 5160957540. KC is funded by BELSPO (Belgian Science Policy Office) in the frame of the STEREO III programme-project 3D-FOREST (SR/02/355). M.V. is funded by CNPq (National Council of Technological and Scientific Development-Brazil) through the programme Science Without Borders (Process number 233849/2014-9).

Acknowledgments

Our field data were acquired through collaboration between Wageningen University and Research and Guyana Forestry Commission. A special thanks to José Gonzalez de Tanago, Jens van der Zee and the forestry team in the Guyana Forestry Commission for all the assistance during the fieldwork and Rong An Inc. concession for allowing us to stay in their camp during fieldwork. We extend a very special thanks to the Guyana Forestry Commission and especially to Pradeepa Bholanath and Nasheta Dewnath for all the assistance before, during, and after the fieldwork.

Conflicts of Interest

The authors declare no conflict of interest. The funders had no role in the design of the study; in the collection, analyses, or interpretation of data; in the writing of the manuscript, or in the decision to publish the results.

Abbreviations

The following abbreviations are used in this manuscript:
AGBAboveground biomass
adj- R 2 Adjusted R-square
AICcAkaike’s information criterion
CCCConcordance correlation coefficient
CDCrown diameter
CFCorrection factor
Ch05.I.5Chave et al. [12] Equation I.5
Ch05.II.3Chave et al. [12] Equation II.3
Ch14.EChave et al. [11] Equation (7)
Ch14.HChave et al. [11] Equation (4)
CV RMSECoefficient of variation of RMSE
DDiameter at breast height
dfdegrees of freedom
dmfdry mass fraction
GWDDGlobal wood density database [8]
HHeight
LiDARLight Detection And Ranging
MMRVMonitoring, measurement, reporting and verification
POMPoint of measurement
Rj17.ERéjou-Méchain et al. [46] Equation (1)
QSMQuantitative structure models
TLSTerrestrial laser scanning
RDVCReference Dummy Variable Correction
REDD+Reducing emissions from deforestation and degradation
RMSERoot mean square error
RSEResidual standard error
UAVUnnamed aerial vehicle
UAV-LSUnnamed aerial vehicle laser scanning
WDWood density

Appendix A

Figure A1. Relationship between pre-harvest against post-harvest values for D (a) and H (b), TLS-derived against post-harvest values for D (c) and H (d), TLS-derived against pre-harvest values for C D (e), and against harvested tree A G B (f), Solid line is 1:1 relationship.
Forests 10 00527 g0a1
Table A1. Summary of AGB estimates from TLS-derived and pantropical allometric models— R 2 , RMSE, CCC, sum of errors (sum, mean, standard deviation (SD)), mean percent error and relative error (n = 26) separated in small trees (D ≤ 70 cm ) and large trees (D > 70 cm ). Models are arranged based on the statistical parameters from the best model to the worst model.
ModelType R 2 RMSECCCMean Error (Mg)Sum Error (Mg)SD Error (Mg)Mean rel. Error (%)SD. rel. Error (%)
SmallLargeSmallLargeSmallLargeSmallLargeSmallLargeSmallLargeSmallLargeSmallLarge
m5D.WD.CD0.830.841.272.690.870.900.030.060.500.531.312.8644.080.1170.7522.73
m4D.WD.H.CD0.830.811.222.890.890.890.080.011.230.131.263.0744.29−0.0465.7423.30
Ch05.II.3WD.D.D 2 .D 3 0.700.781.573.300.790.86−0.21−0.43−3.61−3.881.603.4710.71−4.2257.5122.36
Ch05.I.5D 2 .WD.H0.760.671.404.250.840.79−0.11−0.88−1.95−7.911.444.4215.26−7.5747.4524.95
Ch14.H(D 2 .WD.H)0.750.671.414.110.840.79−0.09−1.16−1.45−10.441.454.1919.54−9.2148.4223.74
m1D0.740.591.553.710.810.760.640.3210.812.841.463.9299.927.74118.6326.22
Rj17.ED.D 2 .WD.E0.700.771.653.450.750.85−0.40−1.39−6.72−12.551.653.343.61−11.5052.3320.40
Ch14.ED.D 2 .WD.E0.700.771.683.550.740.84−0.44−1.57−7.45−14.111.673.371.39−13.0851.6020.94
m3D.WD.H0.670.741.674.390.750.72−0.16−3.27−2.66−29.451.713.1135.20−23.7265.9019.41
m2D.WD0.640.771.904.300.760.810.841.9914.3017.911.754.04105.0614.74109.0528.47
Figure A2. Mean error in estimates (estimated AGB minus reference AGB in Mg ) by DBH size class: small trees (D ≤ 70 cm ; n = 17) and large trees (D > 70 cm ; n = 9) for the TLS-derived allometric models and pantropical models.
Forests 10 00527 g0a2

References

  1. Guyana Forestry Commission. Terms of Reference for Developing Capacities for a National Monitoring, Reporting and Verification System to Support REDD+ Participation of Guyana. Background, Capacity Assessment and Roadmap; Technical Report; Guyana Foresty Commission: Georgetown, TX, USA, 2009.
  2. Butt, N.; Epps, K.; Overman, H.; Iwamura, T.; Fragoso, J.M. Assessing carbon stocks using indigenous peoples’ field measurements in Amazonian Guyana. For. Ecol. Manag. 2015, 338, 191–199. [Google Scholar] [CrossRef]
  3. Henry, M.; Cifuentes Jara, M.; Réjou-Méchain, M.; Piotto, D.; Michel Fuentes, J.M.; Wayson, C.; Alice Guier, F.; Castañeda Lombis, H.; Castellanos López, E.; Cuenca Lara, R.; et al. Recommendations for the use of tree models to estimate national forest biomass and assess their uncertainty. Ann. For. Sci. 2015, 72, 769–777. [Google Scholar] [CrossRef] [Green Version]
  4. Alvarez, E.; Duque, A.; Saldarriaga, J.; Cabrera, K.; de las Salas, G.; del Valle, I.; Lema, A.; Moreno, F.; Orrego, S.; Rodríguez, L. Tree above-ground biomass allometries for carbon stocks estimation in the natural forests of Colombia. For. Ecol. Manag. 2012, 267, 297–308. [Google Scholar] [CrossRef]
  5. Goodman, R.C.; Phillips, O.L.; Baker, T.R. The importance of crown dimensions to improve tropical tree biomass estimates. Ecol. Appl. 2014, 24, 680–698. [Google Scholar] [CrossRef] [PubMed] [Green Version]
  6. Manuri, S.; Brack, C.; Nugroho, N.P.; Hergoualc’h, K.; Novita, N.; Dotzauer, H.; Verchot, L.; Putra, C.A.S.; Widyasari, E.; Hergoualc’h, K.; et al. Tree biomass equations for tropical peat swamp forest ecosystems in Indonesia. For. Ecol. Manag. 2014, 334, 241–253. [Google Scholar] [CrossRef]
  7. Gibbs, H.K.; Brown, S.; Niles, J.O.; Foley, J.A. Monitoring and estimating tropical forest carbon stocks: Making REDD a reality. Environ. Res. Lett. 2007, 2, 045023. [Google Scholar] [CrossRef]
  8. Zanne, A.E.; Lopez-Gonzalez, G.; Coomes, D.A.; Ilic, J.; Jansen, S.; Lewis, S.L.S.; Miller, R.B.; Swenson, N.G.; Wiemann, M.C.; Chave, J. Data from: Towards a Worldwide Wood Economics Spectrum. Available online: https://datadryad.org/bitstream/handle/10255/dryad.235/GlobalWoodDensityDatabase.xls?sequence=1 (accessed on 18 June 2019).
  9. Chave, J.; Coomes, D.; Jansen, S.; Lewis, S.L.; Swenson, N.G.; Zanne, A.E. Towards a worldwide wood economics spectrum. Ecol. Lett. 2009, 12, 351–366. [Google Scholar] [CrossRef]
  10. Feldpausch, T.R.; Lloyd, J.; Lewis, S.L.; Brienen, R.J.W.; Gloor, M.; Monteagudo Mendoza, A.; Lopez-Gonzalez, G.; Banin, L.; Abu Salim, K.; Affum-Baffoe, K.; et al. Tree height integrated into pantropical forest biomass estimates. Biogeosciences 2012, 9, 3381–3403. [Google Scholar] [CrossRef] [Green Version]
  11. Chave, J.; Réjou-Méchain, M.; Búrquez, A.; Chidumayo, E.; Colgan, M.S.; Delitti, W.B.C.; Duque, A.; Eid, T.; Fearnside, P.M.; Goodman, R.C.; et al. Improved allometric models to estimate the aboveground biomass of tropical trees. Glob. Chang. Biol. 2014, 20, 3177–3190. [Google Scholar] [CrossRef]
  12. Chave, J.; Andalo, C.; Brown, S.; Cairns, M.A.; Chambers, J.Q.; Eamus, D.; Fölster, H.; Fromard, F.; Higuchi, N.; Kira, T.; et al. Tree allometry and improved estimation of carbon stocks and balance in tropical forests. Oecologia 2005, 145, 87–99. [Google Scholar] [CrossRef]
  13. Larjavaara, M.; Muller-Landau, H.C. Measuring tree height: A quantitative comparison of two common field methods in a moist tropical forest. Methods Ecol. Evol. 2013, 4, 793–801. [Google Scholar] [CrossRef]
  14. Slik, J.W.F.; Paoli, G.; McGuire, K.; Amaral, I.; Barroso, J.; Bastian, M.; Blanc, L.; Bongers, F.; Boundja, P.; Clark, C.; et al. Large trees drive forest aboveground biomass variation in moist lowland forests across the tropics. Glob. Ecol. Biogeogr. 2013, 22, 1261–1271. [Google Scholar] [CrossRef]
  15. Ploton, P.; Barbier, N.; Takoudjou Momo, S.; Réjou-Méchain, M.; Boyemba Bosela, F.; Chuyong, G.; Dauby, G.; Droissart, V.; Fayolle, A.; Goodman, R.C.; et al. Closing a gap in tropical forest biomass estimation: Taking crown mass variation into account in pantropical allometries. Biogeosciences 2016, 13, 1571–1585. [Google Scholar] [CrossRef]
  16. Meyer, V.; Saatchi, S.; Clark, D.B.; Keller, M.; Vincent, G.; Ferraz, A.; Espírito-Santo, F.; Oliveira, M.V.N.; Kaki, D.; Chave, J.; et al. Canopy Area of Large Trees Explains Aboveground Biomass Variations across Nine Neotropical Forest Landscapes. Biogeosci. Discuss. 2018, 1–38. [Google Scholar] [CrossRef]
  17. Calders, K.; Newnham, G.G.; Burt, A.; Murphy, S.; Raumonen, P.; Herold, M.; Culvenor, D.; Avitabile, V.; Disney, M.; Armston, J.; et al. Nondestructive estimates of above-ground biomass using terrestrial laser scanning. Methods Ecol. Evol. 2015, 6, 198–208. [Google Scholar] [CrossRef]
  18. Gonzalez de Tanago, J.; Lau, A.; Bartholomeus, H.; Herold, M.; Avitabile, V.; Raumonen, P.; Martius, C.; Goodman, R.C.; Disney, M.; Manuri, S.; et al. Estimation of above-ground biomass of large tropical trees with terrestrial LiDAR. Methods Ecol. Evol. 2018, 9, 223–234. [Google Scholar] [CrossRef]
  19. Clark, D.B.; Kellner, J.R. Tropical forest biomass estimation and the fallacy of misplaced concreteness. J. Veg. Sci. 2012, 23, 1191–1196. [Google Scholar] [CrossRef]
  20. Goodman, R.C.; Phillips, O.L.; Baker, T.R. Tightening up on tree carbon estimates. Nature 2012, 491, 527. [Google Scholar] [CrossRef]
  21. Sheil, D.; Eastaugh, C.S.; Vlam, M.; Zuidema, P.A.; Groenendijk, P.; van der Sleen, P.; Jay, A.; Vanclay, J. Does biomass growth increase in the largest trees? Flaws, fallacies and alternative analyses. Funct. Ecol. 2017, 31, 568–581. [Google Scholar] [CrossRef]
  22. Disney, M.I.; Boni Vicari, M.; Burt, A.; Calders, K.; Lewis, S.L.; Raumonen, P.; Wilkes, P. Weighing trees with lasers: Advances, challenges and opportunities. Interface Focus 2018, 8, 20170048. [Google Scholar] [CrossRef]
  23. Wilkes, P.; Lau, A.; Disney, M.; Calders, K.; Burt, A.; Gonzalez de Tanago, J.; Bartholomeus, H.; Brede, B.; Herold, M. Data acquisition considerations for Terrestrial Laser Scanning of forest plots. Remote Sens. Environ. 2017, 196, 140–153. [Google Scholar] [CrossRef]
  24. Malhi, Y.; Jackson, T.; Patrick Bentley, L.; Lau, A.; Shenkin, A.; Herold, M.; Calders, K.; Bartholomeus, H.; Disney, M.I. New perspectives on the ecology of tree structure and tree communities through terrestrial laser scanning. Interface Focus 2018, 8, 20170052. [Google Scholar] [CrossRef] [PubMed] [Green Version]
  25. Newnham, G.G.; Armston, J.D.; Calders, K.; Disney, M.I.; Lovell, J.L.; Schaaf, C.B.; Strahler, A.H.; Danson, F.M. Terrestrial Laser Scanning for Plot-Scale Forest Measurement. Curr. For. Rep. 2015, 1, 239–251. [Google Scholar] [CrossRef] [Green Version]
  26. Momo Takoudjou, S.; Ploton, P.; Sonké, B.; Hackenberg, J.; Griffon, S.; de Coligny, F.; Kamdem, N.G.; Libalah, M.; Mofack, G.I.I.; Le Moguédec, G.; et al. Using terrestrial laser scanning data to estimate large tropical trees biomass and calibrate allometric models: A comparison with traditional destructive approach. Methods Ecol. Evol. 2018, 9, 905–916. [Google Scholar] [CrossRef]
  27. Abd Rahman, M.; Abu Bakar, M.; Razak, K.; Rasib, A.; Kanniah, K.; Wan Kadir, W.; Omar, H.; Faidi, A.; Kassim, A.; Abd Latif, Z. Non-Destructive, Laser-Based Individual Tree Aboveground Biomass Estimation in a Tropical Rainforest. Forests 2017, 8, 86. [Google Scholar] [CrossRef]
  28. Paynter, I.; Genest, D.; Peri, F.; Schaaf, C. Bounding uncertainty in volumetric geometric models for terrestrial lidar observations of ecosystems. Interface Focus 2018, 8, 20170043. [Google Scholar] [CrossRef] [PubMed] [Green Version]
  29. Stovall, A.E.; Anderson-Teixeira, K.J.; Shugart, H.H. Assessing terrestrial laser scanning for developing non-destructive biomass allometry. For. Ecol. Manag. 2018, 427, 217–229. [Google Scholar] [CrossRef]
  30. Burt, A.; Disney, M.; Raumonen, P.; Armston, J.; Calders, K.; Lewis, P. Rapid characterisation of forest structure from TLS and 3D modelling. In Proceedings of the 2013 IEEE International Geoscience and Remote Sensing Symposium—IGARSS, Melbourne, Australia, 21–26 July 2013; pp. 3387–3390. [Google Scholar] [CrossRef]
  31. Krooks, A.; Kaasalainen, S.; Kankare, V.; Joensuu, M.; Raumonen, P.; Kaasalainen, M. Tree structure vs. height from terrestrial laser scanning and quantitative structure models. Silva Fenn. 2014, 48, 1–11. [Google Scholar] [CrossRef]
  32. Holopainen, M.; Vastaranta, M.; Kankare, V. Biomass estimation of individual trees using stem and crown diameter TLS measurements. Int. Arch. Photogramm. Remote Sens. Spat. Inf. Sci. 2011, XXXVIII, 29–31. [Google Scholar] [CrossRef]
  33. Raumonen, P.; Kaasalainen, M.; Åkerblom, M.; Kaasalainen, S.; Kaartinen, H.; Vastaranta, M.; Holopainen, M.; Disney, M.; Lewis, P. Fast Automatic Precision Tree Models from Terrestrial Laser Scanner Data. Remote Sens. 2013, 5, 491–520. [Google Scholar] [CrossRef] [Green Version]
  34. Hackenberg, J.; Spiecker, H.; Calders, K.; Disney, M.; Raumonen, P. SimpleTree—An Efficient Open Source Tool to Build Tree Models from TLS Clouds. Forests 2015, 6, 4245–4294. [Google Scholar] [CrossRef]
  35. Kaasalainen, S.; Krooks, A.; Liski, J.; Raumonen, P.; Kaartinen, H.; Kaasalainen, M.; Puttonen, E.; Anttila, K.; Mäkipää, R. Change detection of tree biomass with terrestrial laser scanning and quantitative structure modelling. Remote Sens. 2014, 6, 3906–3922. [Google Scholar] [CrossRef]
  36. Åkerblom, M.; Raumonen, P.; Mäkipää, R.; Kaasalainen, M. Automatic tree species recognition with quantitative structure models. Remote Sens. Environ. 2017, 191, 1–12. [Google Scholar] [CrossRef]
  37. Guyana Lands and Surveys Commission. Guyana National Land Use Plan; Number June; Guyana Lands and Surveys Commission: Georgetown, TX, USA, 2013; p. 174.
  38. Muñoz, G.; Grieser, J. Climwat 2.0 for CROPWAT. Available online: http://www.fao.org/land-water/databases-and-software/climwat-for-cropwat/en/ (accessed on 18 June 2019).
  39. Phillips, O.; Baker, T.; Feldpausch, T.; Brienen, R.; Almeida, S.; Arroyo, L.; Aymard, G.; Chave, J.; Cardozo, N.D.; Chao, K.J.; et al. RAINFOR Field Manual for Plot Establishment and Remeasurement. 2009. Available online: http://www.rainfor.org/upload/ManualsEnglish/RAINFOR_field_manual_version_June_2009_ENG.pdf (accessed on 18 June 2019).
  40. Kitajima, K.; Mulkey, S.S.; Wright, S.J. Variation in Crown Light Utilization Characteristics among Tropical Canopy Trees. Ann. Bot. 2004, 95, 535–547. [Google Scholar] [CrossRef] [PubMed] [Green Version]
  41. Williamson, G.B.; Wiemann, M.C. Measuring wood specific gravity...correctly. Am. J. Bot. 2010, 97, 519–524. [Google Scholar] [CrossRef] [PubMed]
  42. Calders, K.; Burt, A.; Origo, N.; Disney, M.; Nightingale, M.; Raumonen, P.; Akerblom, M.; Lewis, P. Realistic Forest Stand Reconstruction from Terrestrial LiDAR for Radiative Transfer Modelling. Remote Sens. 2018, 10, 933. [Google Scholar] [CrossRef]
  43. Vicari, M.B.; Disney, M.; Wilkes, P.; Burt, A.; Calders, K.; Woodgate, W. Leaf and wood classification framework for terrestrial LiDAR point clouds. Methods Ecol. Evol. 2019, 10, 680–694. [Google Scholar] [CrossRef] [Green Version]
  44. Lin, L.I.K. A Concordance Correlation Coefficient to Evaluate Reproducibility. Biometrics 1989, 45, 255–268. [Google Scholar] [CrossRef]
  45. R Core Team. R: A Language and Environment for Statistical Computing; R Foundation for Statistical Computing: Vienna, Austria, 2018. [Google Scholar]
  46. Réjou-Méchain, M.; Tanguy, A.; Piponiot, C.; Chave, J.; Hérault, B. Biomass: An R package for estimating above-ground biomass and its uncertainty in tropical forests. Method. Ecol. Evol. 2017, 8, 1163–1167. [Google Scholar] [CrossRef]
  47. Baskerville, G.L. Use of Logarithmic Regression in the Estimation of Plant Biomass. Can. J. For. Res. 1972, 2, 49–53. [Google Scholar] [CrossRef]
  48. Jucker, T.; Caspersen, J.; Chave, J.; Antin, C.; Barbier, N.; Bongers, F.; Dalponte, M.; van Ewijk, K.Y.; Forrester, D.I.; Haeni, M.; et al. Allometric equations for integrating remote sensing imagery into forest monitoring programmes. Glob. Chang. Biol. 2017, 23, 177–190. [Google Scholar] [CrossRef] [PubMed]
  49. Roşca, S.; Suomalainen, J.; Bartholomeus, H.; Herold, M. Comparing terrestrial laser scanning and unmanned aerial vehicle structure from motion to assess top of canopy structure in tropical forests. Interface Focus 2018, 8, 20170038. [Google Scholar] [CrossRef] [PubMed]
  50. Hunter, M.; Keller, M.; Victoria, D.; Morton, D.C. Tree height and tropical forest biomass estimation. Biogeosciences 2013, 10, 8385–8399. [Google Scholar] [CrossRef] [Green Version]
  51. Brede, B.; Lau, A.; Bartholomeus, H.M.; Kooistra, L. Comparing RIEGL RiCOPTER UAV LiDAR derived canopy height and DBH with terrestrial LiDAR. Sensors 2017, 17, 2371. [Google Scholar] [CrossRef] [PubMed]
  52. Kuyah, S.; Dietz, J.; Muthuri, C.; Jamnadass, R.; Mwangi, P.; Coe, R.; Neufeldt, H. Allometric equations for estimating biomass in agricultural landscapes: I. Aboveground biomass. Agric. Ecosyst. Environ. 2012, 158, 216–224. [Google Scholar] [CrossRef]
  53. Oliveira, A.A.D.E.; Mori, S.A.; De Oliveira, A.A.; Mori, S.A. A central Amazonian terra firme forest. I. High tree species richness on poor soils. Biodivers. Conserv. 1999, 8, 1219–1244. [Google Scholar] [CrossRef]
  54. Lau, A.; Bentley, L.P.; Martius, C.; Shenkin, A.; Bartholomeus, H.; Raumonen, P.; Malhi, Y.; Jackson, T.; Herold, M. Quantifying branch architecture of tropical trees using terrestrial LiDAR and 3D modelling. Trees Struct. Funct. 2018, 32, 1219–1231. [Google Scholar] [CrossRef] [Green Version]
  55. Raumonen, P.; Casella, E.; Calders, K.; Murphy, S.; Åkerblom, M.; Kaasalainen, M. Massive-scale tree modelling from tls data. ISPRS Ann. Photogramm. Remote Sens. Spat. Inf. Sci. 2015, II-3/W4, 189–196. [Google Scholar] [CrossRef]
  56. Burt, A. New 3D Measurements of Forest Structure. Ph.D. Thesis, University College London, London, UK, 2017. [Google Scholar]
  57. Disney, M.I.; Burt, A.; Calders, K.; Schaaf, C.; Stovall, A. Innovations in ground and airborne technologies as reference and for training and validation: Terrestrial Laser Scanning (TLS). Surv. Geophys. 2019. [Google Scholar] [CrossRef]
Figure 1. Map of the study area in Guyana (cross).
Forests 10 00527 g001
Figure 2. (a) Vitex spp. tree point cloud (TLS-derived H = 51.8 m and TLS-derived D = 114.6 c m with POM at 5.3 m ), (b) down-sampled tree point cloud ( 0.026 m point spacing, as in Calders et al. [42]), (c) soft tissues (green) and hardwood (black) separated point cloud [43], and (d) TreeQSM modelled after the hardwood point cloud.
Forests 10 00527 g002
Figure 3. Buttresses modelling of a Hymenolobium flavum tree. The bottom part of the stem was modelled with a triangular mesh instead of cylinders. The mesh volume replaced the volume of the cylinders.
Forests 10 00527 g003
Figure 4. Relationship between reference AGB (harvested trees; n = 26) and AGB estimated by TLS-derived and pantropical allometric models. Black solid line is 1:1 relationship; dashed coloured lines depict linear fit; and dotted grey lines indicate 95% confidence interval for the linear fit.
Forests 10 00527 g004
Table 1. Pantropical models from [11,12,46] included diameter at breast height (D, in cm ), specie-specific wood density values according to the GWDD ( W D , in g   cm 3 or kg   m 3 ), total height (H, in m ), the environmental stress (E, calculated from the GPS average location of each tree 1) to estimate aboveground biomass ( A G B , in k g dry mass) and ε is the model error.
ModelForm AGB =
Ch05.II.3 W D · e x p ( 1.499 + 2.1481 · l n ( D ) + 0.207 · l n ( D ) 2 0.0281 · l n ( D ) 3 ) + ε
Ch05.I.5 0.0509 · W D · D 2 · H + ε
Ch14.H 0.0673 · ( W D · D 2 · H · ) 0.976 + ε
Ch14.E e x p ( 1.803 0.976 · E + 0.976 · l n ( W D ) + 2.673 · l n ( D ) 0.0299 · l n ( D 2 ) ) + ε
Rj17.E e x p ( 2.024 0.896 · E + 0.920 · l n ( W D ) + 2.795 · l n ( D ) 0.0461 · l n ( D 2 ) ) + ε
Table 2. Pre- and post-harvested field measured attributes, and terrestrial laser scanning (TLS)-derived attributes range for: diameter (D), height (H), crown diameter ( C D ), wood density ( W D ; see note below) and aboveground biomass (AGB).
AttributesAllometric Model Dataset (n = 72)Validation Dataset (n = 26)
MeasuredpreTLS-DerivedMeasuredpostTLS-Derived
Diameter (cm)12.9 − 134.013.3 − 126.216.7 − 128.716.7 − 130.2
Tree height (m)14 − 43.016.9 − 51.816.4 − 51.616.6 − 49.1
Crown diameter (m)4.4 − 42.62.5 − 42.93.4 − 30.8 pre4.6 − 30.2
WD (g cm 3 )0.4 − 1.00.4 − 1.00.4 − 0.90.4 − 1.0
AGB (Mg)NA0.2 − 28.50.9 − 21.80.2 − 27.4
Note: Wood density was taken from direct measurements for measured trees in reference dataset and from the GWDD for all others.
Table 3. Models description for the TLS-derived aboveground biomass estimations including diameter (D), wood density ( W D ), height (H), crown diameter ( C D ), Reference Dummy Variable Corrector ( R D V C ) and associated statistical parameters based on 72 trees.
ModelTypeFormabcdeRDVCdfRSEadj-R 2 AICc
m1D l n ( A G B ) = a + b · l n ( D ) + ε 0.67881.9337700.3600.9061.52
m2D.WD l n ( A G B ) = a + b · l n ( D ) + c · l n ( W D ) + R D V C + ε 0.67652.02461.0932−0.1968690.2740.9423.61
m3D.WD.H l n ( A G B ) = b · l n ( D ) + c · l n ( W D ) + d · l n ( H ) + R D V C + ε 1.90911.09780.3224−0.2138690.266NA19.48
m4D.WD.H.CD l n ( A G B ) = b · l n ( D ) + c · l n ( W D ) + d · l n ( H ) + e · l n ( C D ) + ε 1.72820.26031.15220.3698680.240NA6.23
m5D.WD.CD l n ( A G B ) = a + b · l n ( D ) + c · l n ( W D ) + e · l n ( C D ) + ε 0.53661.81241.15120.3878680.2460.969.28
Notes: df are degrees of freedom of the model, RSE is residual standard error of estimates, R 2 is adjusted R 2 , AICc is the corrected Akaike’s information criterion and NA is not applicable. In the models where the intercept was removed, R 2 was not calculated.
Table 4. Summary of AGB estimates from TLS-derived and pantropical allometric models— R 2 , root mean square error (RMSE), concordance correlation coefficient (CCC), sum of errors (sum, mean, standard deviation (SD)), mean percent error and relative error (n = 26). Models are arranged based on the statistical parameters from the best model to the worst model.
ModelType R 2 RMSECCCError (Mg)Relative Error (%)
SumMeanSDMeanSD
m5D.WD.CD0.931.910.961.030.041.9528.2561.35
m4D.WD.H.CD0.921.990.961.360.052.0328.3357.91
Ch05.II.3WD.D.D 2 .D 3 0.892.320.94−7.49−0.292.355.5448.26
Ch05.I.5D 2 .WD.H0.852.750.92−9.86−0.382.787.3541.98
Ch14.H(D 2 .WD.H)0.852.670.92−11.89−0.462.699.5943.31
m1D0.872.520.9313.650.532.5168.01105.95
Rj17.ED.WD.E0.882.430.93−19.28−0.742.36−1.6244.04
Ch14.ED.WD.E0.882.490.93−21.56−0.832.39−3.6243.52
m3D.WD.H0.882.920.89−32.11−1.232.6914.8060.97
m2D.WD0.892.960.9232.211.242.7473.8098.95

