Article

Effects of Reduced Tillage on Weed Pressure, Nitrogen Availability and Winter Wheat Yields under Organic Management

1
Research Institute of Organic Agriculture (FiBL), Ackerstrasse 113, 5070 Frick, Switzerland
2
Wageningen University and Research, Droevendaalsesteeg 1, 6708 PB Wageningen, The Netherlands
3
ISARA Lyon, 23 rue Jean Baldassini, 69364 Lyon CEDEX 7, France
*
Author to whom correspondence should be addressed.
Agronomy 2019, 9(4), 180; https://doi.org/10.3390/agronomy9040180
Submission received: 1 March 2019 / Revised: 25 March 2019 / Accepted: 2 April 2019 / Published: 8 April 2019

Abstract

:
Reduced tillage reduces soil erosion and increases topsoil organic matter compared with conventional tillage. However, yields are often reported to be lower, presumably, due to increased weed pressure and a slower N mineralization under organic farming conditions. The effects of reduced tillage compared with ploughing on weed infestation and winter wheat performance at four different crop stages, i.e., tillering, stem elongation, flowering, and harvest, was monitored for a single season in an eleven-year-old organic long-term tillage trial. To disentangle the effects of weed presence on crop yield and potential crop performance, subplots were cleaned from weeds during the whole cropping season. Weed biomass was consistently higher under reduced tillage. Soil mineral nitrogen contents under reduced tillage management were higher, which could be explained by the earlier ley termination in autumn compared with the conventional tillage system. Nitrogen status of wheat assessed with SPAD measurements was consequently higher under reduced tillage throughout the season. At harvest, wheat biomass and grain yield were similar in both tillage systems in the presence of weeds, but 15–18% higher in the reduced tillage system when weeds were removed. The negative impact of weeds on yields were not found with conventional tillage with a low weed infestation. Results suggest that reduced tillage can provide equivalent and even higher yields to conventional tillage in organically managed winter wheat if weed management is improved and good nutrient supply is assured.

1. Introduction

The loss of arable land, due to soil degradation, is a global problem. Especially ploughing is one of the major causes of soil erosion, mainly in combination with monocultures and rotations, including fallow periods where bare soil is exposed [1]. To minimize the negative effect of tillage, the adoption of conservation tillage has been encouraged by the European Community and the Food and Agriculture Organization (FAO) [2]. Conservation tillage is a generic term that describes tillage systems which aim to conserve soil and water [3]. Reduced tillage and minimum tillage are both variants of conservation tillage. Conservation tillage encompasses tillage operations that work less intensively than a traditional tillage system in a given region [4], which is usually ploughing under European conditions [5]. This often means non-inversion tillage at shallower depths, but can include many different approaches and machinery [5]. Soil preservation is one of the main motivations among farmers for adopting conservation tillage [6].
Reducing the intensity of soil tillage has shown to have several benefits compared to ploughing, such as the accumulation of soil organic matter in topsoils [7], decreased soil erosion [8], increased soil biodiversity [9] and an increase in earthworm abundance [10]. However, there are also potential drawbacks. For instance, mineralization of soil organic matter can be slowed down [11], which might result in a reduced nitrogen supply especially in springtime, challenging yield performance [12,13,14]. For many organic farmers in Europe, ploughing still remains to be an important means of weed control [6] which is supported by observations that conversion to conservation tillage under organic farming bears the risk of an increased weed pressure [15,16], especially of perennial weeds which are hard to control [17,18]. The lower tillage intensity results in an increased weed abundance mainly because of higher seedling recruitment in the upper soil layers and the challenge of destroying the rhizomes of perennial weeds [11,17].
Weeds are one of the major constraints for crop production [19] because they compete for the same resources that are essential for crop development. Thus, the higher weed pressure commonly reported for organic reduced tillage [14,20] may induce serious crop-weed concurrence, which needs to be better understood for efficient weed control.
Potentially reduced nitrogen availability and increased weed incidence under organic reduced tillage might thus cause the average 7% yield reduction compared with ploughed systems found in a meta-analysis [14]. Yet, this yield gap is not consistent in all studies, and higher or similar yields have also been reported [21,22,23,24]. Studies assessing weed-crop competitive relationships in relation to soil nitrogen availability are lacking, but needed to disentangle their effect on crop yield in the comparison of reduced and conventionally tilled systems.
In a long-term organic tillage trial, we therefore studied weed and winter wheat development, and weed impact on the crop at four different crop stages, while soil mineral nitrogen was monitored regularly throughout the cropping season. Two different weed treatments were applied in subplots: Weed-infested plots, where weeds were not controlled, and weed-controlled plots, i.e., weed-free plots. We hypothesized that in the reduced tillage compared to the conventional ploughing system: (i) Weed infestation, especially of perennial and grass species, and weed competition will be higher, leading to (ii) reduced crop development and yields, and that (iii) the potential wheat performance in weed-free plots will be still low, due to a lower nitrogen availability.

2. Materials and Methods

2.1. Study Site and Trial Layout

This study was carried out in 2014 in a long-term trial run by the Research Institute of Organic Agriculture FiBL in Frick, Switzerland (47°30′ N, 81°01′ E, 350 m a.s.l.). Mean annual temperature and rainfall in 2014 were 11.1 °C and 966 mm, and on a ten years average 10.2 °C and 1073 mm (2003–2013), respectively. The monthly average data is shown in Appendix A Table A1. The soil type is a Vertic Cambisol, with a mean soil pH (2012, 0–20 cm) of 7.1. On average, the mineral fraction consists of 22% sand, 33% silt and 45% clay, and the soil organic carbon ranges between 2.3 and 2.7 (0–10 cm, 2012).
The field was converted to organic standards in 1995 and managed using conventional tillage at ca. 15 cm ploughing depth until the establishment of the trial in 2002. The crop rotation until 2013 consisted of maize, winter wheat, sunflower, spelt and two years of grass-clover. In 2014, the crop rotation was changed and winter wheat was sown in October 2013 after termination of the grass-clover ley. The main agronomic activities performed in 2013 and 2014 from soil preparation to wheat harvest are summarized in Appendix A Table A2. In this study, two factors were investigated, each with two levels: Tillage system, comparing conventional (CT) versus reduced tillage (RT) and fertilization, where the application of slurry alone (SL) was compared to the use of composted farmyard manure with a reduced quantity of slurry (MC). Fertilization rates and nutrient contents of these treatments are provided in Appendix A Table A2. The trial is arranged in a strip split-plot design, with tillage being carried out in strips to be able to work with normal farm machinery and fertilization nested across tillage strips. This incomplete block design includes 4 blocks arranged spatially to cover soil heterogeneity [12]. The plot size is 12 m × 12 m. Termination of the grass-clover ley differed between the two tillage systems. This is the most challenging situation in an organic rotation as the perennial ley has to be successfully destroyed without herbicides, which is normally done by ploughing [5]. The procedure in organic reduced tillage systems is still a work in progress. In this study, termination started earlier in the reduced tilled plots (about two weeks) to profit from summer drought for the desiccation of ley residues (see details in Appendix A Table). Termination started with a skim plough (“Stoppelhobel”, Zobel Company, Rot am See, Germany) operating at 5–7 cm depth and was finished a week later with another pass using a chisel plough with wide sweeps of 7–10 cm (“Weco-Dyn System”, EcoDyn Company, Schwanau, Germany) to first clear the roots from soil and second to fully undercut the sward. Thus, two passes were needed in RT. In the conventional tillage system, a moldboard plough turned the soil to 15–18 cm depth and fully buried the sward in one pass. Seedbed preparation and sowing was performed simultaneously using a horizontal rotary harrow of 5 cm in both tillage systems, which is a common practice on heavy soils in the study region.

2.2. Sampling Design

Four sampling dates were chosen at important wheat growth stages based on the cereal growth stadia on the BBCH scale [25]: ‘Tillering stage (hereafter TS)’ BBCH 26 (sampled on 12th March), ‘Stem elongation stage (ES)’ BBCH 30 (14th April), ‘Flowering stage (FS)’ BBCH 61 (27th May) and ‘Harvest stage (HS)’ BBCH 89 (16th July). In each plot, seven subplots of 1 m × 1 m were established at least 2 m from the borders of the plots to avoid boundary effects. Half of the subplots were weeded (cleaned) and the rest were not (weed infested). One cleaned and one infested subplot was attributed to each of the aforementioned stages. In the case of TS, no clean plots were established, due to the concurrence of the first sampling date with the start of the study and the very low weed infestation at that moment. Weeding in the subplots was done manually on a regular basis during the whole growing season. However, small amounts of weeds were found in the cleaned subplots due to the constant emergence of weed seedlings. No additional mechanical weeding by tractor driven devices was done in the main plots during the study.

2.3. Sampling Methods

For each defined stage in both cleaned and weed infested plots, weed aboveground biomass, total wheat aboveground biomass and chlorophyll content (SPAD) of wheat were measured.
Aboveground weed biomass was sampled at the same time as the aboveground wheat biomass. All the plants in a 60 cm × 60 cm square within each subplot were cut at soil level. Weed plants were sorted into four different categories: Annual and perennial grasses, as well as annual and perennial broadleaves. Fresh weight was recorded. Total weed and wheat dry weight were measured after drying in the oven at 60 °C for 24 h. In addition, at harvest, the effective number of tillers bearing an ear were registered in each subplot. Wheat ears and straw were separated, dried and weighted to obtain a proxy for the yield data. Moreover, wheat grain yield of each main plot (weed infested) was harvested by a plot-sized combined harvester in a 1.5 m × 8 m strip. The grain/straw ratio was determined in the main plots. Grain yield of cleaned subplots was estimated using measured straw yields and the main plot grain/straw index. Total N content was analyzed in wheat grain and straw samples of the main plots by Kjeldahl digestion and subsequent photometric detection. Crude protein content was calculated by multiplication of N content with the factor 6.25. The total N uptake of wheat plants as the product of N content and biomass of grain and straw was calculated for the main plots and predicted for the weed-cleaned subplots using their measured biomass and the main plot N contents.
To analyze the chlorophyll content, a SPAD meter (SPAD 502 Plus, Konica Minolta, Dietikon, Switzerland) was used. The average of three readings on the flag leaf of 20 wheat plants was recorded within each subplot. At harvest, the chlorophyll content was not measured because of wheat leaf senescence. In addition, soil mineral nitrogen (Nmin) was assessed on a weekly base throughout the cropping season [26]. Three soil samples were taken with a soil auger (0–20 cm) in each plot and pooled as a composite sample per treatment. The fresh soil was extracted with a 0.01 M CaCl2 solution (1:4, w/v) at the day of sampling and the extract analyzed for nitrate and ammonium spectrophotometrically (SAN-plus Segmented Flow Analyzer, Skalar Analytical B.V., AA Breda, The Netherlands).

2.4. Statistical Analyses

Linear mixed-effect models were used to evaluate the effect of tillage, fertilisation and weed treatments on the aboveground weed biomass (total biomass and separated by life form, i.e., annual vs. perennials and grasses vs. broadleaves), wheat biomass, and SPAD measurements for each sampling stage separately, as well for additional wheat parameters at harvest. The nested trial structure was considered in the random term. All weed data were log+1-transformed when necessary to meet model residuals requirements. Nmin was analyzed with a repeated measures ANOVA, including a compound symmetry auto-correlation structure. All statistical analyses were performed in R Development Core Team [27] and nlme package [28] was used for linear mixed-effect model analyses.

3. Results

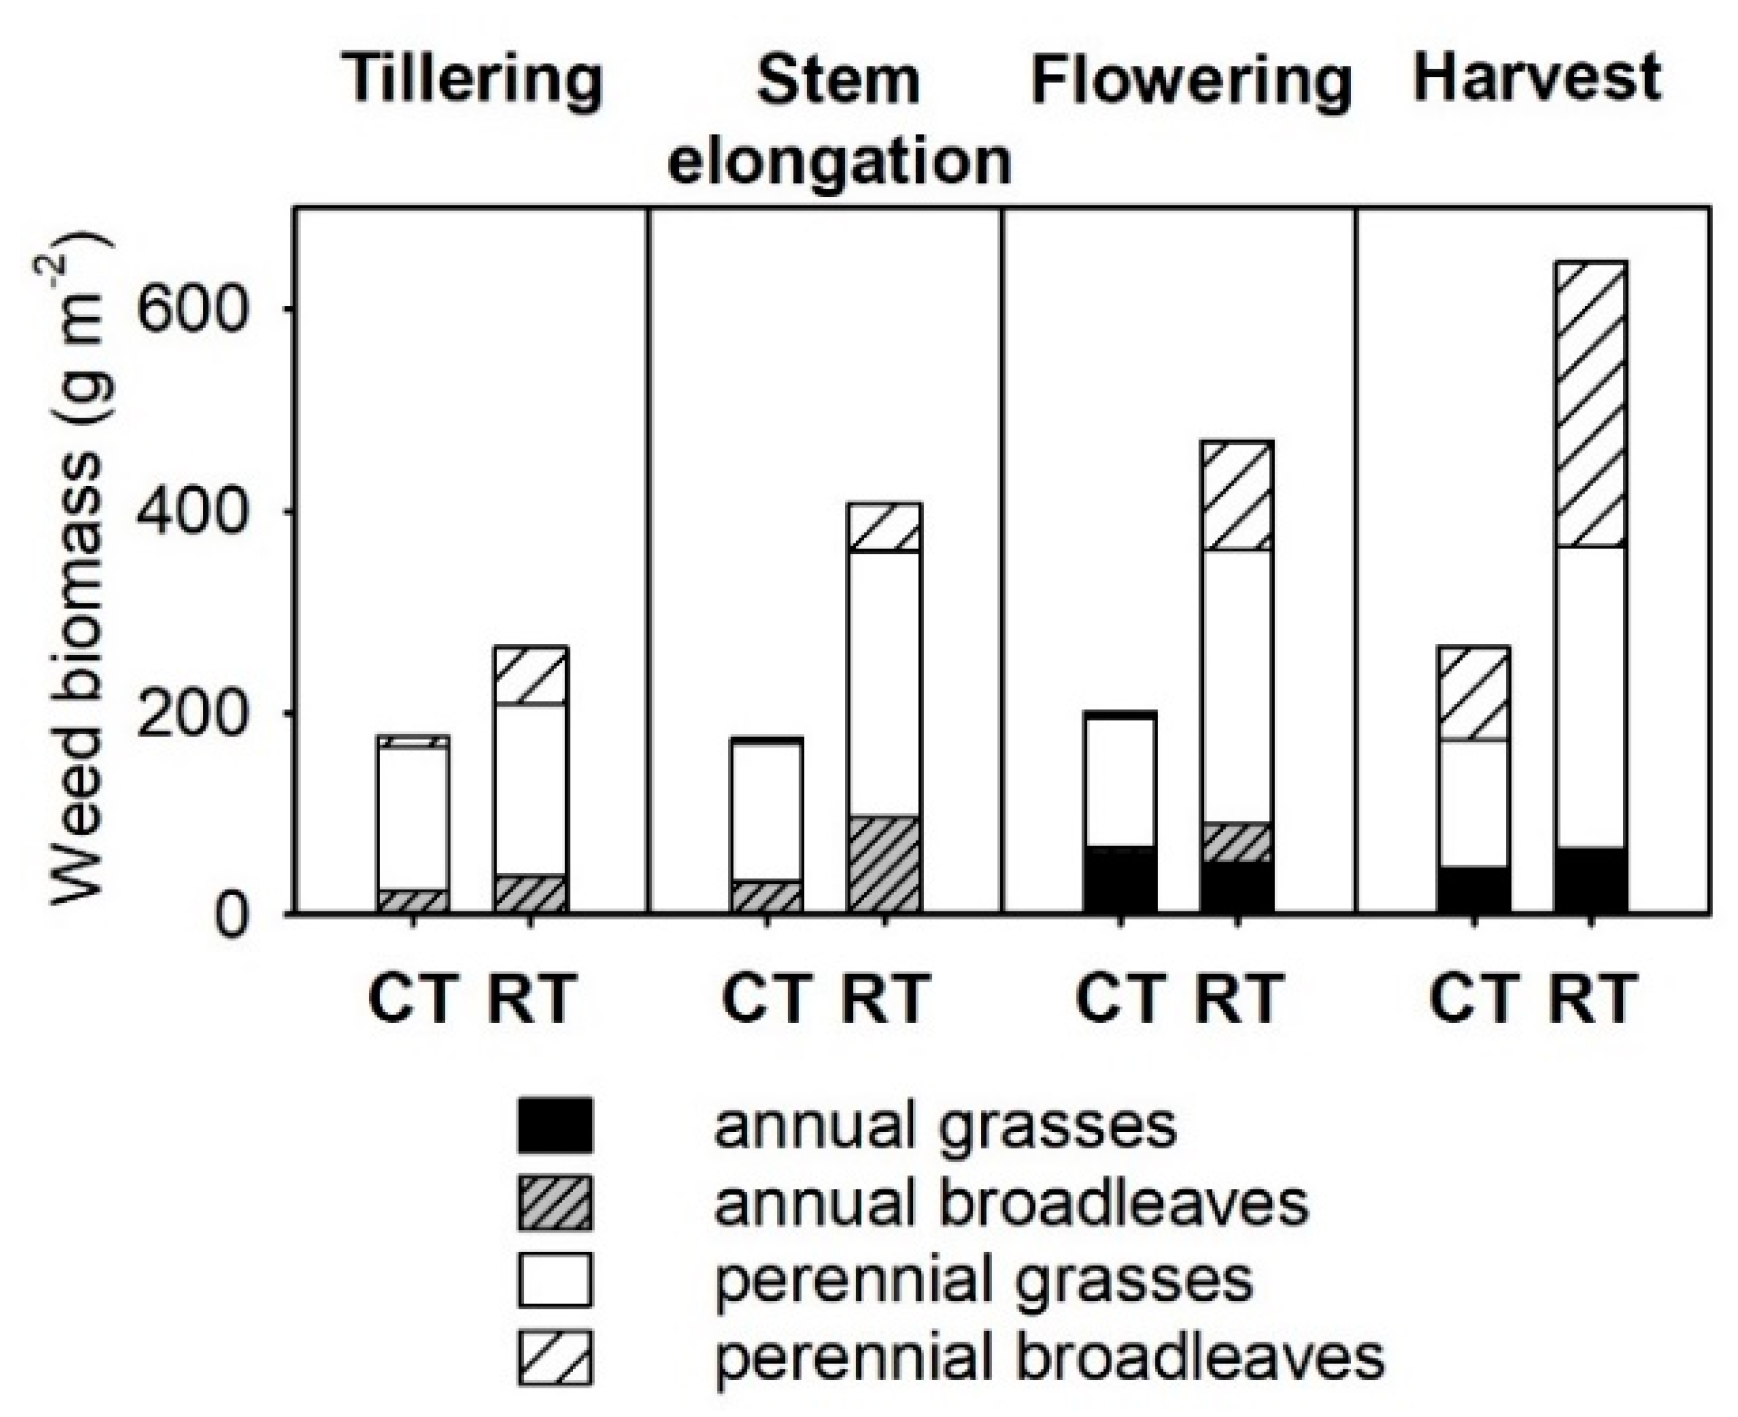
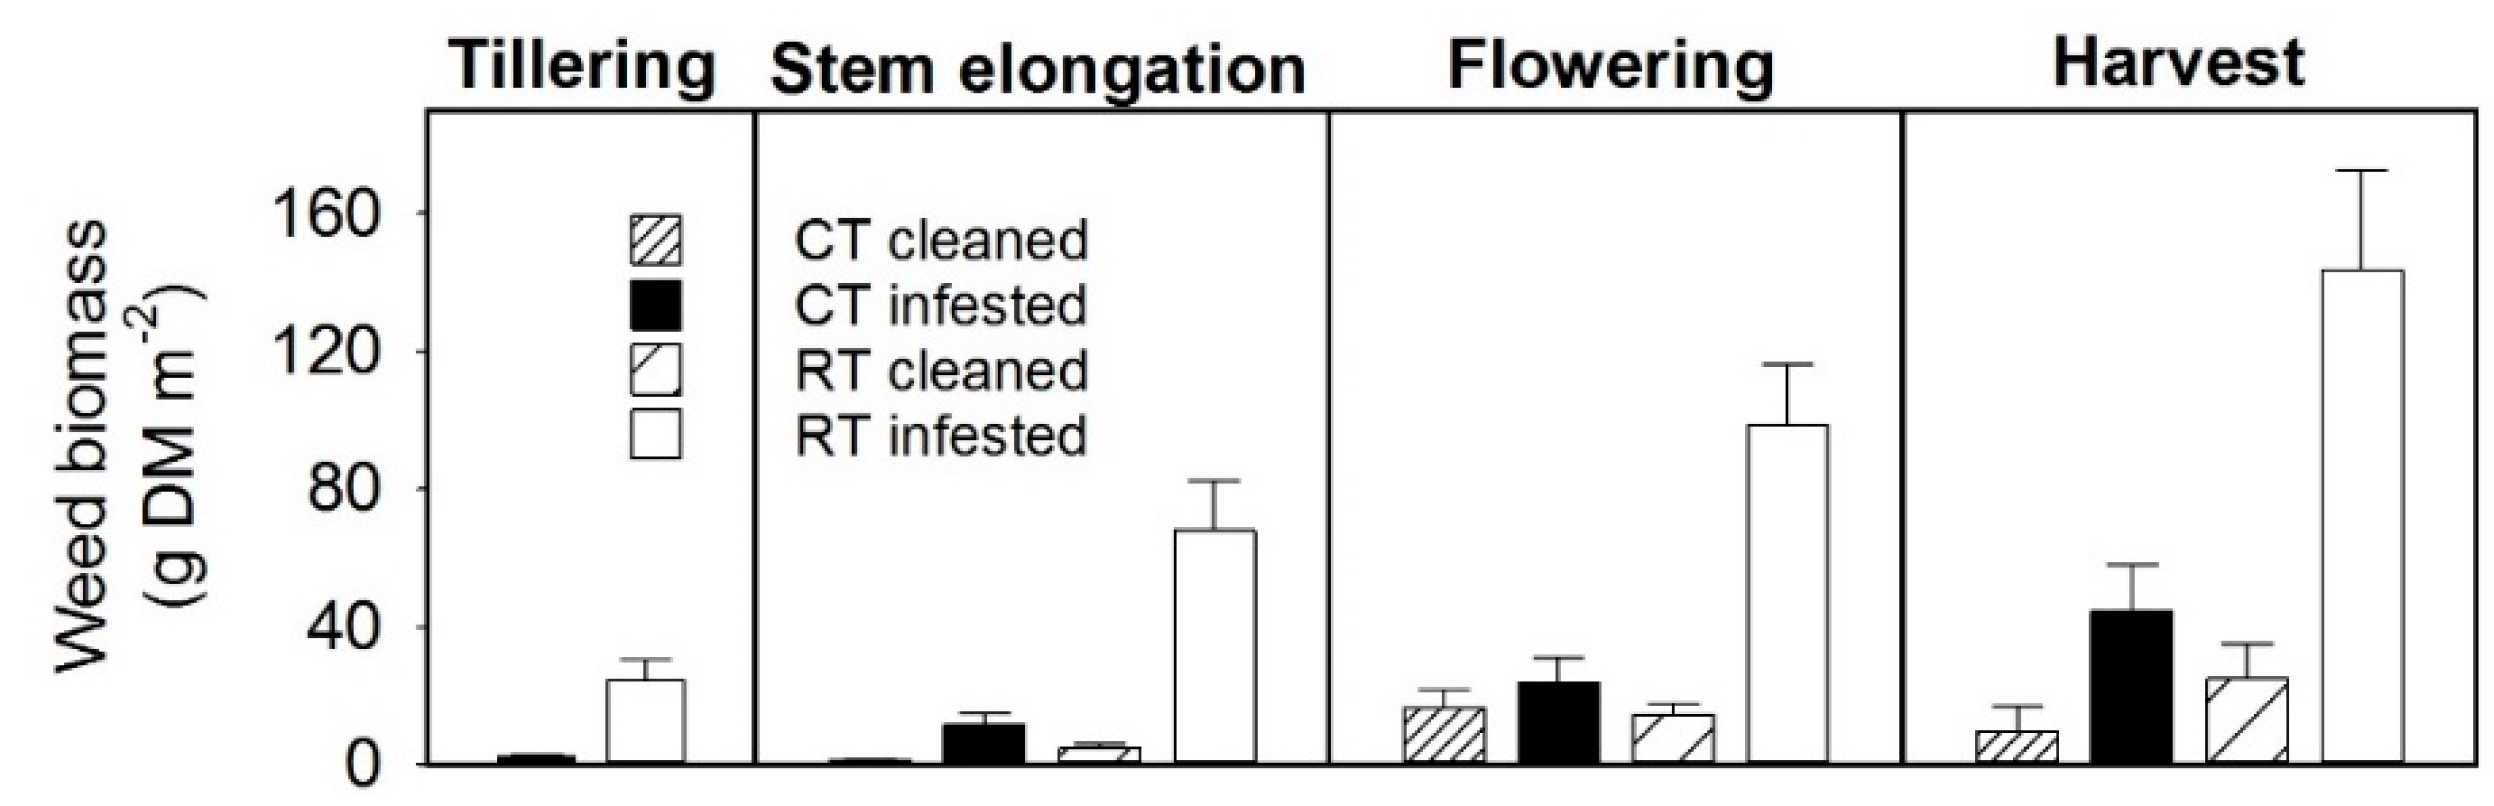
3.1. Weed Composition and Total Weed Biomass

A total of 19 weed species were identified during the whole cropping season. Seven species were grasses, one was annual (Alopecurus myosuroides Huds.), and six were perennials; among them Lolium perenne L., Lolium multiflorum Lam. and Poa trivialis L. were the most abundant. There were seven annual broadleaf species, such as Veronica persica Poiret and Myosotis sp., and five perennial species, of which Trifolium repens L. at the beginning of the season and Convolvulus arvensis L. towards the end of the season were the most abundant. Towards the end of the season, annual broadleaf species, mainly Veronica hederifolia L. and V. persica, virtually disappeared in both systems while the annual grass A. myosuroides increased in abundance. Perennials were more abundant than annual species in both tillage systems at three out of four wheat stages (Figure 1, Table 1). With a relative abundance of perennials of on average 69% in CT and 78% in RT, there was a clear tillage system impact. Similarly, grasses were overall more abundant than broadleaves except at harvest. A relative abundance across sampling dates of 67% and 61% for CT and RT, respectively, indicates only a minor tillage system effect.
Total weed biomass was significantly higher under reduced compared to conventional tillage at the beginning of the cropping season and in tendency higher in later stages, presumably, due to a larger heterogeneity in the distribution of perennials (Table 1, Appendix A Figure A1). The weed-cleaned subplots always had significantly less weed biomass compared to the infested ones (Table 1, Appendix A Figure A1). Fertilisation had no effects on weeds (Table 1).

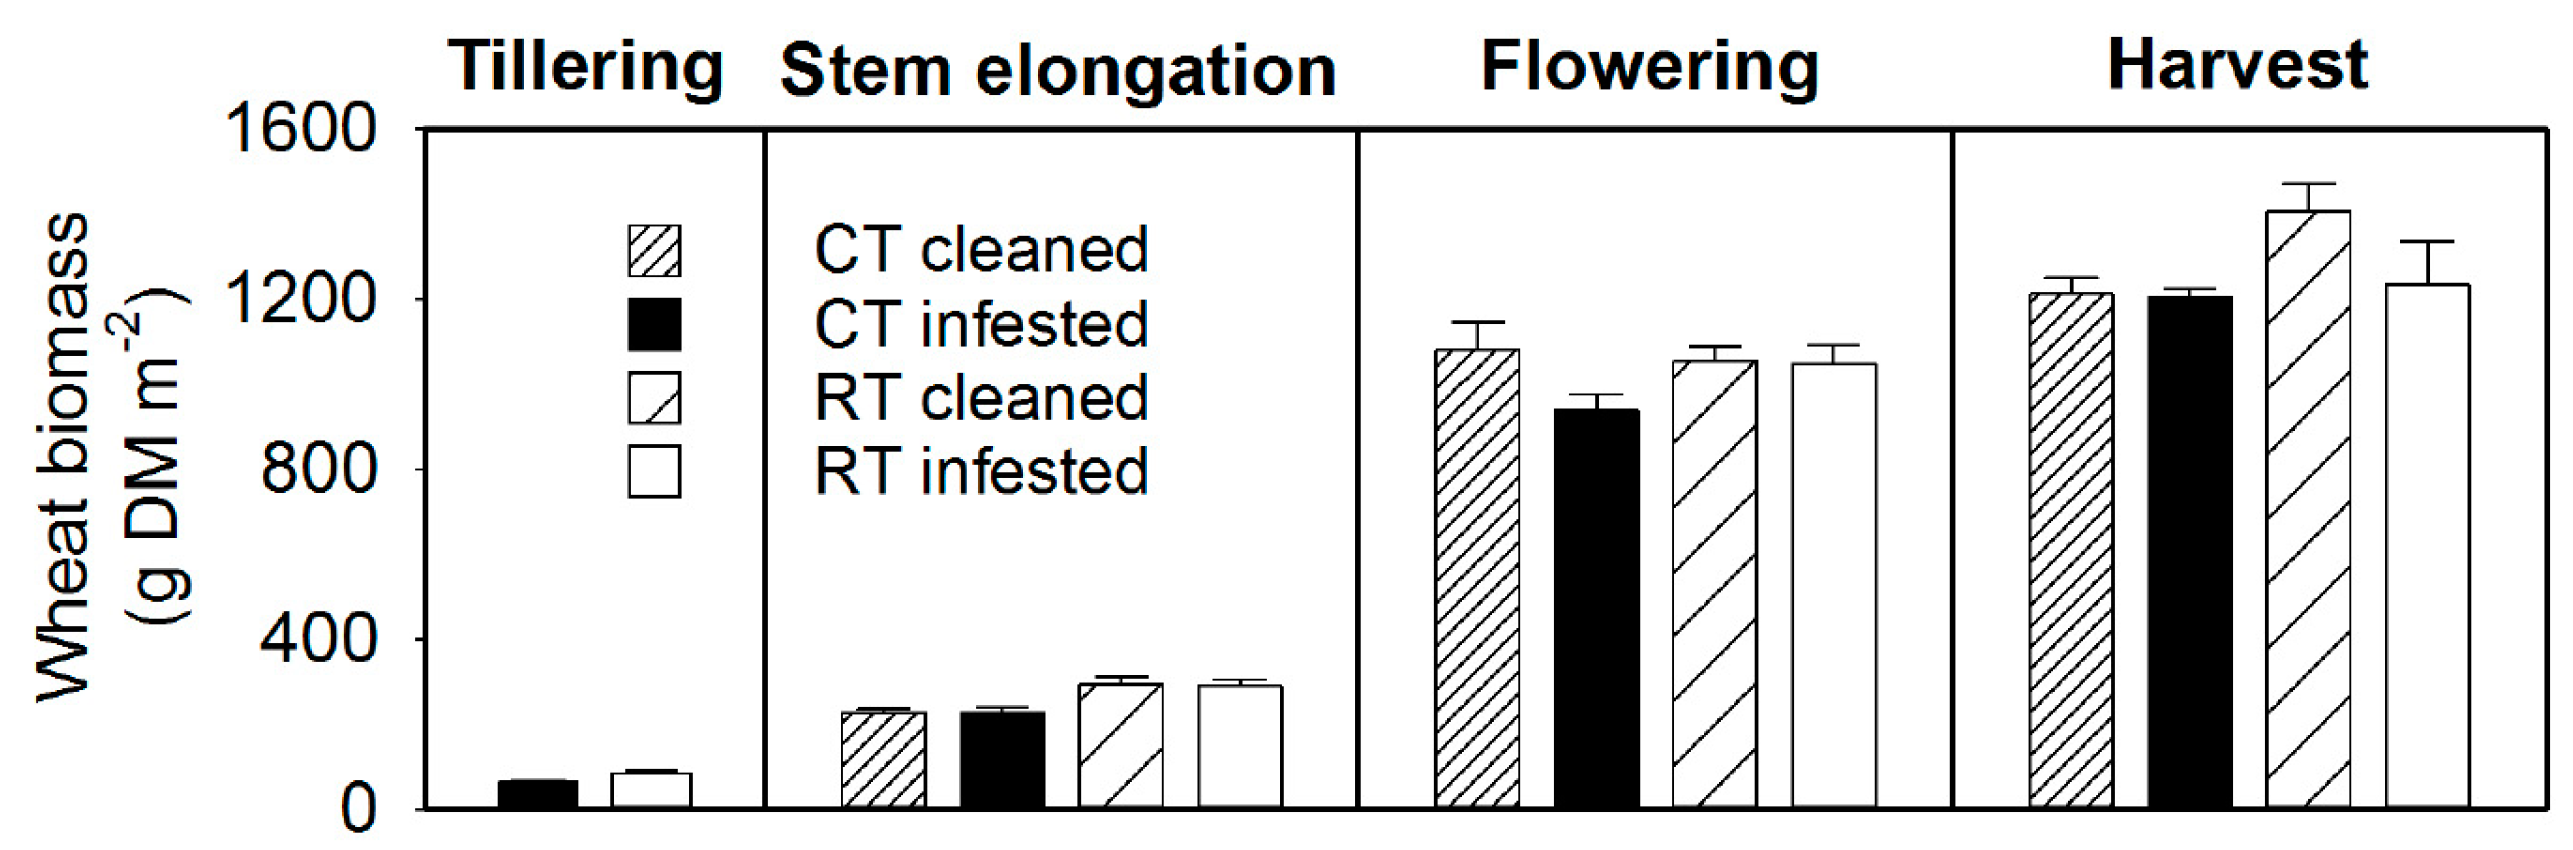
3.2. Wheat Performance

Dry wheat aboveground biomass was higher under reduced tillage at the beginning of the season (Table 1, Figure 2). At Flowering, there was a trend towards a higher wheat biomass in weed-cleaned subplots compared with weed-infested subplots in CT. Conversely, at Harvest, total wheat biomass was on average about 15% and significantly higher in reduced tilled plots when they were weed-cleaned compared to both CT subplots and the weed-infested RT subplots. The same effect was recorded for both ear and straw biomass and thus for the grain yield that was measured in weed-infested main plots and predicted for the weed-cleaned subplots (Table 2). Crude protein contents were similar between tillage systems. Predicted total N uptake was highest in weed-cleaned RT subplots accordingly. As a trend, the number of tillers was 4–8% higher in weed-cleaned subplots in both tillage treatments. Fertilisation had no effect on wheat performance in this season (Table 2).

3.3. SPAD Values and Soil Mineral Nitrogen (Nmin)

SPAD values were significantly higher under reduced tillage at all measured stages (Figure 3, Table 1). No differences between weeding treatments were found. Soil mineral nitrogen (Nmin) concentrations in the 0–20 cm soil layer were higher in RT than CT across the wheat season (repeated measures ANOVA, F-value 7.19, p-value 0.009, DF 78). This was most prominent just after tillage and sowing in autumn 2013 (Figure 3).

4. Discussion

4.1. Impact of Tillage Systems on Weed Flora

According to previous findings in the same trial [23,29] but also in other studies [11,17,30], total weed aboveground biomass was higher in the reduced tillage system than in ploughing. In the same trial, the analysis of 9-years rotation showed an increase in weed abundance of 2.3 times [23]. The most problematic weed at this site, C. arvensis, has however a relative tolerance to tillage [29] and was therefore also a challenge in both systems in this study, counting to 35% (CT) and 45% (RT) of the total weed biomass at harvest. Reduced tillage is therefore less successful in regulating this problematic weed. An increase in grasses under reduced tillage was also found elsewhere [31,32]. Annual grasses were largely represented by A. myosuroides with a high biomass especially at the end of the season. Yet, the higher abundance of grasses in RT was mainly caused by perennial grass species, as the abundance of annual grasses was similar in both tillage systems. In reduced tillage plots, the perennial grasses L. perenne, L. multiflorum, P. trivialis and Phleum pratense L. were the most abundant group of grasses. As L. perenne and P. pratense were part of the grass-clover mixture (besides Festuca pratensis, Dactylus glomerata and Trifolum pratense and T. repens) preceding wheat, their increase can most likely be attributed to the ley termination which was more difficult in the reduced tillage system. In 2013, autumn was rainy and thus the destruction of the grass-clover sward without soil inversion in RT was only partly successful. Grasses and clover regrew after sowing of wheat, which was hardly the case in CT, where ploughing buried the sward reliably. As seen in this study, volunteer regrowth can increase competition when weed management is not performed optimally. Ley destruction is thus a critical point within an organic rotation and reduced tillage systems need to be improved to guarantee a good volunteer [5]. As a result, total and relative biomass of perennials were higher under RT as shown previously in the same trial [23]. The increase in grass abundance over time in the RT of almost two-fold previously reported was less relevant in this study.

4.2. Impact of Tillage Systems on Winter Wheat Performance and Weeding Impact

Mineralization of the incorporated grass-clover sward was higher in RT than in CT. The slightly earlier ley termination in RT with two passes compared to one pass in CT might have contributed to the higher mineralization just after its termination. The higher mineralization led to better plant nutrition (as expressed by higher SPAD scores) in RT, especially at tillering, and persisted through the growing season. This could explain why weeding treatment did not affect SPAD values. The better plant nutrition translated also into higher biomass yields in early stages of wheat growth and was still prevalent at harvest (slightly higher crude protein content and total N uptake in RT). Previous results in the trial have shown a significant increase in soil organic carbon concentrations and stocks in RT compared with CT, as well as higher microbial biomass [26]. Overall, the long-term effect of RT practices in this trial showed improved soil properties in RT, which may have contributed to the higher N mineralization observed. For instance, the higher microbial biomass reported may have provided more nutrients, due to higher microbial activity and thus nutrient turnover. It must be also considered that the spring was warmer and drier than the ten-year average (Appendix A Table A1), which seemed to stimulate mineralization. A cold and wet soil not mineralizing in spring as seen as problematic in Reference [4] was not an issue in this study. Therefore, plant nutrition, at least in terms of nitrogen, was better in RT than in CT, which can be explained by both the improvement of the soil conditions and the good weather conditions. The different type of fertilization did not have a significant effect on wheat parameters (neither on weed biomass). The same results were reported in the same trial when analyzing long-term tendencies, i.e., from 2002 to 2011 [23].
Wheat yields did not differ between RT and CT in the presence of weeds. This is supported by the results of a 9-year rotation in the same trial for three different crops, i.e., wheat, sunflower and spelt, in spite of higher weed abundance [23]. Lower yields under reduced tillage have been mainly reported in crops sown in widely spaced rows, such as corn, soybean or faba bean, and concurred with much higher weed infestations [33].
In our study, the reduction of the weed presence had positive effects on the production of tillers in both tillage systems, but more interestingly, on the final wheat biomass and yield, but only in the RT system. An increase in wheat biomass in cleaned subplots was only significant for CT at the flowering stage. Yet, this was not translated into higher biomass and grain yield at harvest. This could indicate an interaction of weed competition and plant nutrition, which was lower in CT. On the contrary, 15% higher final biomass yield (+18% in predicted grain yield) in cleaned compared with weed infested subplots in RT suggests that weed competition jeopardizes the high yield potential of RT. In this study, it seems that the impact of weed presence on wheat growth was more serious at the very end of the growing season. This confirms observations from practical farming that C. arvensis, a highly competitive weed [34] and A. myosuroides are key weeds that need special caution and that the regrowth of perennial grasses needs to be avoided.
Thus, similar yields to CT can still be achieved in RT with a high weed pressure if plant nutrition is sufficient. Previous studies have shown changes in weed functional traits of weed communities in different tillage regimes. Many species in weed communities under reduced tillage were potentially less competitive because they were shorter and had less affinity for nutrients [35]. This could also explain the similar yields between different tillage systems despite the higher weed pressure. This means also that reducing weed pressure by improving weed control may even result in higher yields in RT. The average yield gap reported by Cooper et al. [14] may consequently be rather determined by nutrient supply, which seems to be often limited in RT. However, we must take into consideration that for other crops, such as maize or soybean, differences in weed infestation levels between RT and CT have been found to be much higher than for wheat [23], which increases the competition for resources with the crop and might lead to a high yield gap.

5. Conclusions

Our study supports reduced tillage as a feasible alternative to ploughed systems. Results show similar wheat grain yields and aboveground biomass in both tillage systems and the potential to obtain even higher wheat biomass under reduced tillage if weed pressure is decreased. Our results also show that good nutrient availability under reduced tillage is possible, and this may have counterbalanced the higher weed competition compared with ploughing.
Improvements in weed control should therefore especially focus on reducing weed infestation at later stages of wheat development. New machinery or adjustments of crop rotations and green manures to suppress perennial weeds need to be further addressed. Similar studies assessing direct weed-crop competition effects are suggested to be performed also in other crops, such as maize or soybean, where lower crop yields under reduced tillage are reported, due to very high weed infestation levels [23]. In addition, as seen in this study, there is a high potential to nourish crops by an intense nutrient turnover in RT. However, efforts in improving soil structure, especially in the lower topsoil, where compaction is often reported [5], needs to be addressed also to assure good plant nutrition even when weather conditions for nutrient mineralization are unfavorable.

Author Contributions

Conceptualization, J.P. and P.M.; Funding acquisition, P.M.; Investigation, M.A.J.H.; Project administration, A.B.; Supervision, A.B.; Validation, L.A., M.K.; Visualization, M.K.; Writing—original draft, M.A.J.H.; Writing—review and editing, M.K. and L.A.

Funding

This research was conducted within the framework of the TILMAN-ORG project funded by the CORE Organic II Funding Bodies and partners of the FP7 ERA-NET (www.coreorganic2.org) and with funding from the Swiss Federal Office for Agriculture and the following foundations: Software AG-Stiftung, Stiftung zur Pflege von Mensch, Mitwelt and Erde.

Acknowledgments

This study is based on the master thesis done within the framework of the international master of Agroecology organized by NMBU (Norway) and ISARA Lyon (France).

Conflicts of Interest

The authors declare no conflict of interest.

Appendix A

Figure A1. Total weed biomass (g dry matter m−2) per tillage system and weeding treatments at different wheat stages. Fertilisation treatments were pooled. CT = ploughing, RT = reduced.
Agronomy 09 00180 g0a1
Table A1. Weather data (temperature, precipitation) during the wheat-growing season considered in the weed competition study compared with the average of 2003–2013.
Weed Study Period Mean (2003–2013)
YearMonthTemperature
°C
Precipitation
mm
Temperature
°C
Precipitation
mm
2013October11.6105.410.380.8
2013November4.7129.85.273.7
2013December1.870.61.5108.5
2014January3.467.21.180.8
2014February4.565.61.357.9
2014March7.717.65.677.5
2014April11.377.610.579.0
2014May13.174.414.3109.4
2014June18.652.218.295.0
2014July18.5190.419.6124.6
Table A2. Farm operations during wheat cropping in 2013 and 2014, according to: tillage system (conventional (CT) and reduced (RT)) and fertilization treatment (slurry (SL) and manure compost with reduced amounts of slurry (MC)).
DateTreatmentsFarm OperationDetailsN Applied
CT-MCCT-SLRT-MCRT-SL(kg ha−1)
23.09.2013 XXGrass-clover termination (Skim plough)5–7 cm
02.10.2013 XXGrass-clover termination (Chisel plough)10 cm
09.10.2013XX Grass-clover termination (Ploughing)15–18 cm
20.10.2013XXXXRototiller/Sowing winter wheat var. Wiwa250 kg ha−1
11.03.2014X X Manure compost application14.4 t FM ha−1Nt = 102, Nmin = 7
19.03.2014X X Slurry application20 m3 FM ha−1Nt = 28, Nmin = 12
19.03.2014 X XSlurry application50 m3 FM ha−1Nt = 69, Nmin = 30
09.04.2014X X Slurry application17 m3 FM ha−1Nt = 26, Nmin = 10
09.04.2014 X XSlurry application37 m3 FM ha−1Nt = 57, Nmin = 21
FM = Fresh matter, Nt = total N, Nmin = mineral N as contained in manure and slurry.

References

  1. Gliessman, S. Agroecology: The Ecology of Sustainable Food Systems; Taylor & Francis: New York, NY, USA, 2007. [Google Scholar]
  2. Basch, G.; Gonzalzez-Sanchez, E.; Gomez McPherson, H.; Kassam, A. Opportunities for Conservation Agriculture in the EU Common Agricultural Policy 2014–2020. In Proceedings of the 5th World Congress of Conservation Agriculture incorporating 3rd Farming Systems Design Conference, Brisbane, Australia, 18 December 2018. [Google Scholar]
  3. Carter, M.R. Conservation Tillage. In Encyclopedia of Soils in the Environment; Hillel, D., Ed.; Elsevier: Oxford, UK, 2005; pp. 306–311. [Google Scholar]
  4. Mäder, P.; Berner, A. Development of reduced tillage systems in organic farming in Europe. Renew. Agric. Food Syst. 2012, 27, 7–11. [Google Scholar] [CrossRef]
  5. Krauss, M.; Mäder, P.; Peigné, J.; Cooper, J.E. Conservation tillage in organic farming. In Improving Organic Crop Cultivation; Köpke, U., Ed.; Burleigh Dodds Science Publishing: Cambridge, UK, 2018. [Google Scholar]
  6. Casagrande, M.; Peigné, J.; Payet, V.; Mäder, P.; Sans, F.X.; Blanco-Moreno, J.M.; Antichi, D.; Bàrberi, P.; Beeckman, A.; Bigongiali, F.; et al. Organic farmers’ motivations and challenges for adopting conservation agriculture in Europe. Org. Agric. 2015, 6, 281–295. [Google Scholar] [CrossRef]
  7. Meurer, K.H.E.; Haddaway, N.R.; Bolinder, M.A.; Katterer, T. Tillage intensity affects total SOC stocks in boreo-temperate regions only in the topsoil-A systematic review using an ESM approach. Earth Sci. Rev. 2018, 177, 613–622. [Google Scholar] [CrossRef]
  8. Lal, R.; Reicosky, D.C.; Hanson, J.D. Evolution of the plow over 10,000 years and the rationale for no-till farming. Soil Till. Res. 2007, 93, 1–12. [Google Scholar] [CrossRef]
  9. Holland, J.M. The environmental consequences of adopting conservation tillage in Europe: Reviewing the evidence. Agr. Ecosyst. Environ. 2004, 103, 1–25. [Google Scholar] [CrossRef]
  10. Peigne, J.; Cannavaciuolo, M.; Gautronneau, Y.; Aveline, A.; Giteau, J.L.; Cluzeau, D. Earthworm populations under different tillage systems in organic farming. Soil Till. Res. 2009, 104, 207–214. [Google Scholar] [CrossRef]
  11. Peigne, J.; Ball, B.C.; Roger-Estrade, J.; David, C. Is conservation tillage suitable for organic farming? A review. Soil Use Manag. 2007, 23, 129–144. [Google Scholar] [CrossRef]
  12. Berner, A.; Hildermann, I.; Fließbach, A.; Pfiffner, L.; Niggli, U.; Mäder, P. Crop yield and soil fertility response to reduced tillage under organic management. Soil Till. Res. 2008, 101, 89–96. [Google Scholar] [CrossRef]
  13. Soane, B.D.; Ball, B.C.; Arvidsson, J.; Basch, G.; Moreno, F.; Roger-Estrade, J. No-till in northern, western and south-western Europe: A review of problems and opportunities for crop production and the environment. Soil Till. Res. 2012, 118, 66–87. [Google Scholar] [CrossRef]
  14. Cooper, J.; Baranski, M.; Stewart, G.; Nobel-de Lange, M.; Bàrberi, P.; Fließbach, A.; Peigné, J.; Berner, A.; Brock, C.; Casagrande, M.; et al. Shallow non-inversion tillage in organic farming maintains crop yields and increases soil C stocks: A meta-analysis. Agron. Sustain. Dev. 2016, 36, 22. [Google Scholar] [CrossRef]
  15. Carr, P.M.; Mäder, P.; Creamer, N.G.; Beeby, J.S. Overview and comparison of conservation tillage practices and organic farming in Europe and North America. Renew. Agric. Food Syst. 2012, 27, 2–6. [Google Scholar] [CrossRef]
  16. Lehnhoff, E.; Miller, Z.; Miller, P.; Johnson, S.; Scott, T.; Hatfield, P.; Menalled, F. Organic Agriculture and the Quest for the Holy Grail in Water-Limited Ecosystems: Managing Weeds and Reducing Tillage Intensity. Agriculture 2017, 7, 33. [Google Scholar] [CrossRef]
  17. Gruber, S.; Claupein, W. Effect of tillage intensity on weed infestation in organic farming. Soil Till. Res. 2009, 105, 104–111. [Google Scholar] [CrossRef]
  18. Carr, P.M.; Gramig, G.G.; Liebig, M.A. Impacts of Organic Zero Tillage Systems on Crops, Weeds, and Soil Quality. Sustainability 2013, 5, 3172–3201. [Google Scholar] [CrossRef]
  19. Milberg, P.; Hallgren, E. Yield loss due to weeds in cereals and its large-scale variability in Sweden. Field Crop Res. 2004, 86, 199–209. [Google Scholar] [CrossRef]
  20. Travlos, I.S.; Cheimona, N.; Roussis, I.; Bilalis, D.J. Weed-Species Abundance and Diversity Indices in Relation to Tillage Systems and Fertilization. Front. Environ. Sci. 2018, 6. [Google Scholar] [CrossRef]
  21. Gruber, S.; Pekrun, C.; Mohring, J.; Claupein, W. Long-term yield and weed response to conservation and stubble tillage in SW Germany. Soil Till. Res. 2012, 121, 49–56. [Google Scholar] [CrossRef]
  22. Peigné, J.; Messmer, M.; Aveline, A.; Berner, A.; Mäder, P.; Carcea, M.; Narducci, V.; Samson, M.-F.; Thomsen, I.K.; Celette, F.; et al. Wheat yield and quality as influenced by reduced tillage in organic farming. Org. Agric. 2014, 4, 1–13. [Google Scholar] [CrossRef]
  23. Armengot, L.; Berner, A.; Blanco-Moreno, J.; Mäder, P.; Sans, F.X. Long-term feasibility of reduced tillage in organic farming. Agron. Sustain. Dev. 2015, 35, 339–346. [Google Scholar] [CrossRef]
  24. Baldivieso-Freitas, P.; Blanco-Moreno, J.M.; Armengot, L.; Chamorro, L.; Romanya, J.; Sans, F.X. Crop yield, weed infestation and soil fertility responses to contrasted ploughing intensity and manure additions in a Mediterranean organic crop rotation. Soil Till. Res. 2018, 180, 10–20. [Google Scholar] [CrossRef]
  25. Meier, U. Entwicklungsstadien Mono-und Dikotyler Pflanzen: BBCH Monografie; Open Agrar Repositorium: Quedlinburg, Germany, 2018. [Google Scholar]
  26. Krauss, M.; Ruser, R.; Müller, T.; Hansen, S.; Mäder, P.; Gattinger, A. Impact of reduced tillage on greenhouse gas emissions and soil carbon stocks in an organic grass-clover ley—Winter wheat cropping sequence. Agric. Ecosyst. Environ. 2017, 239, 324–333. [Google Scholar] [CrossRef] [PubMed]
  27. R Core Team. R: A Language and Environment for Statistical Computing; R Foundation for Statistical Computing: Vienna, Austria, 2013. [Google Scholar]
  28. Pinheiro, J.; Bates, D.; DebRoy, S.; Sarkar, D.; R Core Team. nlme: Linear and Nonlinear Mixed Effects Models. R Package Version 3.1-118. 2014. Available online: https://cran.r-project.org/web/packages/nlme/citation.html (accessed on 1 March 2019).
  29. Sans, F.X.; Berner, A.; Armengot, L.; Mäder, P. Tillage effects on weed communities in an organic winter wheat–sunflower–spelt cropping sequence. Weed Res. 2011, 51, 413–421. [Google Scholar] [CrossRef]
  30. Santín-Montanyá, M.I.; Martín-Lammerding, D.; Walter, I.; Zambrana, E.; Tenorio, J.L. Effects of tillage, crop systems and fertilization on weed abundance and diversity in 4-year dry land winter wheat. Eur. J. Agron. 2013, 48, 43–49. [Google Scholar] [CrossRef]
  31. Nichols, V.; Verhulst, N.; Cox, R.; Govaerts, B. Weed dynamics and conservation agriculture principles: A review. Field Crop. Res. 2015, 183, 56–68. [Google Scholar] [CrossRef]
  32. Melander, B.; Munier-Jolain, N.; Charles, R.; Wirth, J.; Schwarz, J.; van der Weide, R.; Bonin, L.; Jensen, P.K.; Kudsk, P. European Perspectives on the Adoption of Nonchemical Weed Management in Reduced-Tillage Systems for Arable Crops. Weed Technol. 2017, 27, 231–240. [Google Scholar] [CrossRef]
  33. Légère, A.; Vanasse, A.; Stevenson, F.C. Low-Input Management and Mature Conservation Tillage: Agronomic Potential in a Cool, Humid Climate. Agron. J. 2013, 105, 745–754. [Google Scholar] [CrossRef]
  34. Orloff, N.; Mangold, J.; Miller, Z.; Menalled, F. A meta-analysis of field bindweed (Convolvulus arvensis L.) and Canada thistle (Cirsium arvense L.) management in organic agricultural systems. Agric. Ecosyst. Environ. 2018, 254, 264–272. [Google Scholar] [CrossRef]
  35. Armengot, L.; Blanco-Moreno, J.M.; Barberic, P.; Bocci, G.; Carlesi, S.; Aendekerk, R.; Berner, A.; Celette, F.; Grosse, M.; Huiting, H.; et al. Tillage as a driver of change in weed communities: A functional perspective. Agric. Ecosyst. Environ. 2016, 222, 276–285. [Google Scholar] [CrossRef]
Figure 1. Weed biomass of four different growing form types (g fresh matter m−2) per tillage system (weed-infested treatment only) at different wheat stages. Fertilisation treatments were pooled. CT = ploughing, RT = reduced tillage.
Agronomy 09 00180 g001
Figure 2. Total wheat biomass (g dry matter m−2) per tillage system and weeding treatments at different wheat stages. Fertilisation treatments were pooled. CT = ploughing, RT = reduced tillage.
Agronomy 09 00180 g002
Figure 3. Soil mineral nitrogen concentrations in 0–20 cm (Nmin, mg kg−1) during the wheat growing season 2013/2014 (selection modified after Figure 1 in Reference [26]). Major field management is shown below. Bar plots show SPAD scores at major wheat stages (TS = Tillering, ES = Stem elongation, FS = Flowering). CT = ploughing, RT = reduced tillage.
Agronomy 09 00180 g003
Table 1. Statistical results of tillage, fertilisation and weed specific effects on (a) total weed and biomass of different life forms, (b) wheat biomass and (c) SPAD scores at different wheat stages. Interactions with fertilisation were not significant and therefore excluded for simplification.
TilleringStem ElongationFloweringHarvest
F-values and significance levels
(a) Total weed biomass (see Figure A1, Appendix A)
Tillage (T)23.6 *14.4 *6.92 (*)5.88 (*)
Fertilisation0.06ns0.01ns2.80ns0.01ns
Weeding (W)-100.5 ***11.4 **29.9 ***
T × W-6.55 *7.29 *1.26 ns
Weed biomass: Annual vs. perennial species (see Figure 1)
Tillage (T)21.1 *10.8 *20.1 *9.12 (*)
Fertilisation0.51 ns0.66 ns1.53 ns0.04 ns
Life form (L)9.91 **0.41 ns6.13 *4.61 (*)
T × L7.95 *3.93 (*)50.2 ***3.43 (*)
Weed biomass: Grasses vs. broadleaves (see Figure 1)
Tillage (T)19.7 *21.3 *17.4 *9.22 (*)
Fertilisation1.65 ns0.05 ns0.94 ns0.72 ns
Life form (L)82.2 ***3.75 (*)8.65 *0.08 ns
T × L0.83 ns2.44 ns4.30 (*)0.20 ns
(b) Total wheat biomass (see Figure 2)
Tillage (T)4.98 ns17.5 *0.67 ns1.24 ns
Fertilisation0.26 ns0.08 ns1.54 ns0.66 ns
Weeding (W)-0.01 ns3.49 (*)8.66 *
T × W-0.04 ns3.04 ns6.86 *
(a) SPAD (Figure 3)
Tillage (T)3.66 ns7.08 (*)6.85 (*)-
Fertilisation0.13 ns2.14 ns0.00 ns-
Weeding (W)-0.00 ns2.40 ns-
T × W-0.44 ns0.07 ns-
Significance levels = (*) p < 0.1, * p < 0.05, ** p < 0.01, *** p < 0.001, ns = not significant, – data not measured (details in Material and Methods); Denominator degree of freedom (denDF) refers to Tillering (Tillage = 3, Fertilisation = 6), later stages (Tillage = 3, Fertilisation = 6, Weeding/Life form = 12, Interactions = 12).
Table 2. Mean (standard deviation) and statistical results of the effect of tillage system and weeding treatments on wheat parameters assessed at harvest.
Ear BiomassStraw BiomassGrain YieldCrude ProteinTotal N UptakeNumber of Tillers
t DM ha−1t DM ha−1t DM ha−1%kg N ha−1per m2
Treatment (Fertilisation pooled)
CT cleaned5.75 (0.45)6.37 (0.61)4.43 (0.40) a-99.3 (9.3) a427.8 (64.6)
CT infested5.73 (0.33)6.30 (0.33)4.41 (0.30) 11.9 (0.33)99.4 (5.6)411.4 (36.6)
RT cleaned6.71 (0.81)7.37 (0.99)5.21 (0.51) a-121.2 (9.4) a438.2 (59.7)
RT infested5.79 (1.28)6.54 (1.70)4.43 (0.37)12.1 (0.33)103.0 (12.1)406.9 (57.2)
F-values and significance levels
Tillage (T)1.30 ns1.17 ns5.98 (*)2.44 ns16.1 *0.01 ns
Fertilisation0.61 ns0.68 ns1.67 ns2.14 ns0.40 ns0.23 ns
Weed (W)10.8 **6.52 *11.42 **-11.9 **3.81 (*)
T × W9.61 **4.51 (*)10.25 **-11.9 **0.38 ns
CT = ploughing, RT = reduced tillage. Significance levels (ANOVA) = (*) p < 0.1, * p < 0.05, ** p < 0.01, *** p < 0.001, ns = not significant. a Grain yield and crude protein in grain were not assessed in weed-cleaned subplots. For a grain yield estimation, the same grain/straw index as assessed in main plots was taken for cleaned subplots. Total N uptake was predicted taking N contents of main plots. Denominator degree of freedom (denDF) refers to Tillage = 3, Fertilisation = 6, Weeding = 12, T × W = 12.

