A Migratory Divide Among Red-Necked Phalaropes in the Western Palearctic Reveals Contrasting Migration and Wintering Movement Strategies
 Rob S. A. van Bemmelen1,2*
  Yann Kolbeinsson3
  Raül Ramos4
  Olivier Gilg5,6
  José A. Alves7,8
  Malcolm Smith9
  Hans Schekkerman10
  Aleksi Lehikoinen11
  Ib Krag Petersen12
  Böðvar Þórisson7
  Aleksandr A. Sokolov13 Kaisa Välimäki11,14 Tim van der Meer1 J. David Okill15
  Mark Bolton16
  Børge Moe17
  Sveinn Are Hanssen18
  Loïc Bollache5,6
  Aevar Petersen19 Sverrir Thorstensen20 Jacob González-Solís4 Raymond H. G. Klaassen21 Ingrid Tulp1
- 1Wageningen Marine Research, IJmuiden, Netherlands
- 2Resource Ecology Group, Wageningen University, Wageningen, Netherlands
- 3Northeast Iceland Nature Research Centre, Husavik, Iceland
- 4Biodiversity Research Institute (IRBio) and Department of Evolutionary Biology, Ecology and Environmental Sciences (BEECA), Faculty of Biology, Universitat de Barcelona, Barcelona, Spain
- 5Chrono-environnement, Université de Bourgogne Franche-Comté, Besançon, France
- 6Groupe de Recherche en Ecologie Arctique, Francheville, France
- 7Department of Biology & Centre for Environmental and Marine Studies CESAM, University of Aveiro, Aveiro, Portugal
- 8South Iceland Research Centre, University of Iceland, Laugarvatn, Iceland
- 9RSPB Scotland, Shetland, United Kingdom
- 10SOVON, Nijmegen, Netherlands
- 11The Helsinki Lab of Ornithology, Finnish Museum of Natural History, University of Helsinki, Helsinki, Finland
- 12Department for Bioscience, Aarhus University, Aarhus, Denmark
- 13Arctic Research Station of Institute of Plant and Animal Ecology, Russian Academy of Sciences, Labytnangi, Russia
- 14Department of Psychology, Centre for Interdisciplinary Brain Research, University of Jyväskylä, Jyväskylä, Finland
- 15Trondra, Shetland, United Kingdom
- 16RSPB Centre for Conservation Science, Royal Society for the Protection of Birds, Sandy, United Kingdom
- 17Norwegian Institute for Nature Research (NINA), Trondheim, Norway
- 18Norwegian Institute for Nature Research (NINA), Framsenteret, Tromsø, Norway
- 19Independent Researcher, Reykjavik, Iceland
- 20Independent Researcher, Akureyri, Iceland
- 21Conservation Ecology Group, Groningen Institute for Evolutionary Life Sciences (GELIFES), Groningen University, Dutch Montagu's Harrier Foundation, Groningen, Netherlands
Non-breeding movement strategies of migratory birds may be expected to be flexibly adjusted to the distribution and quality of habitat, but few studies compare movement strategies among populations using distinct migration routes and wintering areas. In our study, individual movement strategies of red-necked phalaropes (Phalaropus lobatus), a long-distance migratory wader which uses saline waters in the non-breeding period, were studied using light-level geolocators. Results revealed a migratory divide between two populations with distinct migration routes and wintering areas: one breeding in the north-eastern North Atlantic and migrating ca. 10,000 km oversea to the tropical eastern Pacific Ocean, and the other breeding in Fennoscandia and Russia migrating ca. 6,000 km—largely over land—to the Arabian Sea (Indian Ocean). In line with our expectations, the transoceanic migration between the North Atlantic and the Pacific was associated with proportionately longer wings, a more even spread of stopovers in autumn and a higher migration speed in spring compared to the migration between Fennoscandian-Russian breeding grounds and the Arabian Sea. In the wintering period, birds wintering in the Pacific were stationary in roughly a single area, whereas individuals wintering in the Arabian Sea moved extensively between different areas, reflecting differences in spatio-temporal variation in primary productivity between the two wintering areas. Our study is unique in showing how habitat distribution shapes movement strategies over the entire non-breeding period within a species.
Introduction
Animal movements are strongly linked to habitat and resource availability. For example, during the non-breeding season, migratory birds cover long distances to track spatio-temporal peaks in resource abundance and avoid unfavorable conditions over large spatial scales (Newton, 2010; Thorup et al., 2017). Non-breeding movements may consist of a long-distance migration to wintering areas and movements within the wintering areas, which can cover long distances and—in some species—are carried out by only a portion of the individuals (Trierweiler et al., 2013; Koleček et al., 2018). Components of movement strategy, such as the number of staging sites, the distances between them, and the time spent at each staging site, are thought to be dictated by the availability and relative quality of habitat (Alerstam and Lindström, 1990; Gudmundsson et al., 1991). Movement strategies are expected to be flexibly adjusted to habitat availability and quality within the boundaries set by, for example, maximum fattening rates and fuel loads, resulting in different strategies among individuals or populations using different migration routes and wintering areas. Indeed, migration strategies do differ between populations in many species (Buehler and Piersma, 2008; Delmore et al., 2012; Alves et al., 2013). At the same time, surprisingly similar migration strategies have been observed in other species, despite geographically distinct migration routes (Fraser et al., 2013; Trierweiler et al., 2014). With so few studies, the extent to which species flexibly adjust large-scale movement strategies to habitat remains poorly understood.
The red-necked phalarope Phalaropus lobatus is a small wader which breeds in fresh water ponds in arctic and subarctic tundra. The species is probably best known for its unusual mating system, with reversed sex-roles where polyandry takes place and the male cares for eggs and chicks (Reynolds et al., 1986). In the non-breeding period, it adopts a pelagic lifestyle in three disjunct tropical ocean areas: the tropical eastern Pacific, the Arabian Sea, and off the East Indies (Cramp and Simmons, 1983). Due to the challenges involved in studying small seabirds at sea, its non-breeding movements remained elusive until recently, when light-level geolocators revealed individual non-breeding movements. Four Swedish males were shown to winter in the Arabian Sea in the north-west Indian Ocean (van Bemmelen et al., 2016), confirming what was already expected based on a small number of ring recoveries (Schiemann, 1977). No ring recovery exists for populations breeding on islands in the north-eastern North Atlantic (Scotland, Faroe Islands, Iceland, and Greenland), despite substantial ringing efforts (Schiemann, 1977; Wernham et al., 2002). Recently, three male red-necked phalaropes were tracked from the Scottish breeding area to the northern Humboldt Current in the Pacific (Smith et al., 2014, 2018), suggesting that north-eastern North Atlantic populations migrate westwards after breeding. The migration routes to the Pacific and Arabian Sea differ in distance (respectively, ca. 11,000 km vs. ca. 6,000 km one-way; Smith et al., 2014; van Bemmelen et al., 2016), and habitat (mostly oversea vs. largely overland), given that red-necked phalaropes depend on saline waters for staging (Cramp and Simmons, 1983; van Bemmelen et al., 2016). In addition, the wintering grounds contrast in spatio-temporal variation in primary productivity, with stable conditions in the Pacific sites but strong fluctuations in the Arabian Sea (Longhurst, 2006). The occurrence of two distinct breeding populations of red-necked phalarope with divergent migration routes and wintering areas provides a rare opportunity to study how, within a single species, habitat distribution shapes movement strategies over the entire non-breeding period.
A first objective of the current study is to investigate the generality of previous tracking studies (Smith et al., 2014, 2018; van Bemmelen et al., 2016) using non-breeding movements of red-necked phalaropes from nine breeding locations between East-Greenland (22°W) and Western Siberia (69°E) recorded by light-level geolocators. Subsequently, both migration strategies and wintering movement strategies are compared between the two routes and wintering areas. Based on optimal migration theory and assuming that suitable feeding conditions are more widespread along the marine western migration route, red-necked phalaropes migrating to the Pacific are expected to make shorter flights with more frequent but briefer stopovers on migration to and from the breeding grounds, thereby avoiding the costs of carrying large fuel loads (Alerstam and Lindström, 1990). In contrast, red-necked phalaropes migrating to the Arabian Sea are expected to show a more direct flight, with few but longer stopovers, as more widely separated saline waters along their route forces them to build up larger fuel loads to cover longer flights (Alerstam and Lindström, 1990). Different movement strategies may favor selection toward certain morphological adaptations, such as longer, more pointed, wings for longer migration distances (Alerstam, 1990; Leisler and Winkler, 2003). Thus, we also tested for morphological variation potentially associated with the two migration strategies. After arrival at the wintering grounds, birds wintering in the Pacific are expected to move only short distances within the wintering grounds (“residency”), given the high and constant primary productivity of the northern Humboldt Current (Chavez and Messié, 2009). In contrast, birds wintering in the Arabian Sea are expected to move between several distant areas during the wintering period (“itinerancy”), reflecting large seasonal and spatial variation in primary productivity (Longhurst, 2006). In addition to the above, individual consistency between years and the potential effect of sex on migration timing and strategies are explored. We expect females to arrive earlier than males to maximize their potential of obtaining males (Oring and Lank, 1982; Reynolds et al., 1986).
Materials and Methods
Catching and Geolocator Deployments
Red-necked phalaropes were captured and fitted with geolocators from 2012 to 2017 in Greenland (Constable Pynt: 70°45′N−22°38′W), two sites in Iceland (Flói: 63°56′N−21°15′W and Aðaldalur: 65°51′N−17°04′W), Scotland (Fetlar: 60°36′N−0°52′W), Sweden (Ammarnäs: 65°59′N−16°01′E), Finland (Enontekiö: 68°58′N−21°16′E), Norway (Slettnes: 71°05′N−28°13′E), and two sites in Russia (Tobseda: 68°36′N−52°19′E; Erkuta: 68°14′N−69°9′E), see Figure 1. Adults were captured while foraging in tundra ponds using mist nets or at their nests using walk-in traps or spring traps. Different geolocator types and deployment methods were applied because studies in Scotland, Finland and Iceland each began as independent projects before joining the project covering Greenland, Sweden, Norway and Russia. Geolocators were either leg-mounted using a modified darvic ring with flag (Greenland and the first year at Flói, Iceland) or back-mounted using leg-loop harnesses (all other sites and years, Rappole and Tipton, 1991). Leg-loops were constructed from 1 mm silastic tubing (WMQ 60) with an elasticated core (only first study year in Scotland and in Finland) or 1 mm wide flat braided shelf-string (British Trust for Ornithology, UK). Geolocator models used were the Mk10 model (British Antarctic Survey, Cambridge, UK), (a modified version of) the Intigeo P65A (Migrate Technology Ltd, Cambridge, UK) and the SOI-GDL2 v1.3 in Finland and v2.3 in Scotland (Swiss Ornithological Institute, Sempach, Switzerland), weighing, respectively 1.0 g, 1.0 g and 0.7 g. At a mean body mass of 38.3 g for females (n = 170) and 33.4 g for males (n = 468), a geolocator mass of 1 g represents about 2.6% of mean body mass in females and 3.0% in males, or 1.7 and 2.0% in case of a geolocator weight of 0.7 g. We are not aware of biases in position estimations inherent to specific geolocator types. The following biometrics were collected: wing length (to the nearest 1.0 mm), bill length (to the nearest 0.1 mm), total head length (head + bill; to the nearest 1.0 mm), tarsus length (to the nearest 1.0 mm) and body mass (to the nearest 0.1 g). In addition to collecting biometrics for the birds equipped with geolocators, biometrics were obtained from other individuals at the study sites, and also from individuals captured in Iceland (Mývatn: 65°36′N−16°60′W and Flatey Island: 65°22′N−22°55′W) and Russia (Medusa Bay: 73°04′N−80°30′E). Using annual encounter data from 212 individuals with geolocators, we estimated apparent survival φ and resighting probability p using Cormack-Jolly-Seber (CJS) models for live encounter data in the “Rmark” package in R, an interface to the program Mark (Laake, 2013). AICc was used to select the best model from a range of CJS models fitted with parameters for φ, p and study site either fixed or varying per year. Four CJS models had ΔAICc values <2, including the simplest model (ΔAICc = 0.64), which estimated p at 0.52 (CI = 0.31–0.71) and φ at 0.32 (CI = 0.23–0.43). An apparent survival rate of 0.32 is notably low for a wader species (Méndez et al., 2018) but is within the range of 0.17 to 0.56 reported from sites in Alaska (Colwell et al., 1988; Schamel and Tracy, 1991; Sandercock, 1997) and likely reflects a low site fidelity rather than survival. Nevertheless, a weak effect of geolocator deployment cannot be ruled out, considering we could not compare against a control group without a geolocator, and knowing that a geolocator attached to a leg flag and weighing >2.5% of the body mass led to lower return rates in other small wader species (Weiser et al., 2016). Trapping and tagging red-necked phalaropes in Greenland has been approved by the Ministry of Fisheries, Hunting and Agriculture (Government of Greenland); in Scotland by the Special Methods Technical Panel of the British Trust for Ornithology and Scottish Natural Heritage; in Finland by the Lapland Center for Economic Development, Transport and the Environment; in Norway by the Norwegian Food Safety Authority (FOTS ID 6328, 7421, 8538) and in Sweden by the Malmö-Lunds djurförsöksetiska nämnd (M160-11, M470-12).
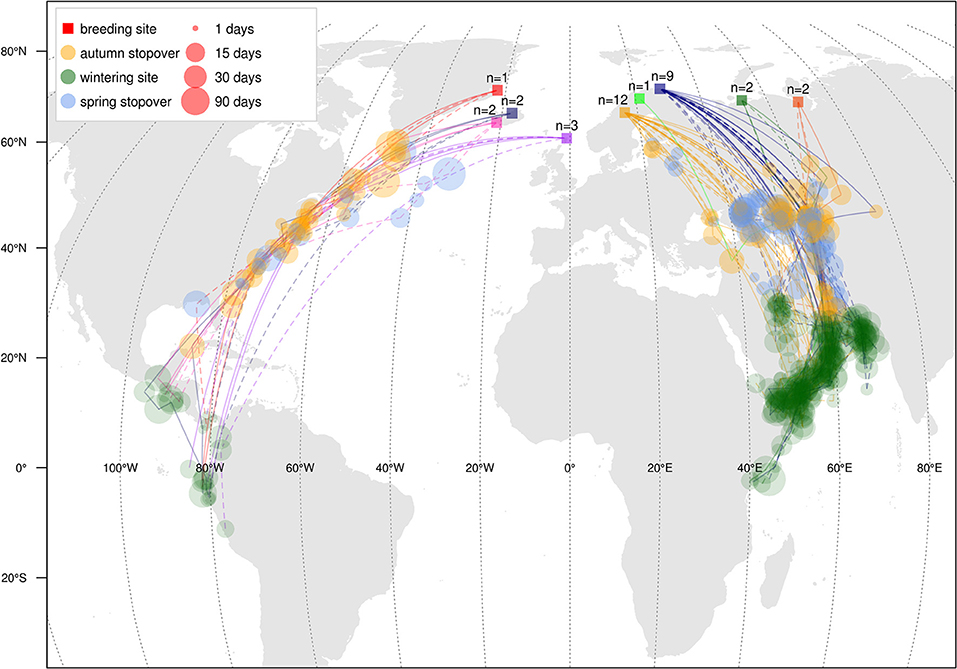
Figure 1. Autumn (solid lines) and spring (dashed lines) migration stopovers and wintering areas of individual Red-necked Phalaropes derived from light-level geolocator tracks. Colored squares show the nine breeding sites (with corresponding sample sizes, i.e., tracked individuals). Dot size represents staging duration. Staging dots are connected by great-circle lines, which do not necessarily represent the exact routes taken.
Geolocator Data Analysis
Data were downloaded from retrieved loggers and processed using BASTrack software (BAS, UK) and time was adjusted for clock drift. Twilights events were determined using the “twilightCalc” function in GeoLight package version 2.0 (Lisovski and Hahn, 2012), in R version 3.4 (R Core Team, 2017) using a light threshold of two and subsequently checked for errors by plotting the date against time of sunrise or sunset. For a range of potential sun angles (−7 to 2°), we plotted (for each track) the position estimates and selected the sun angle that (1) minimized the amplification of latitudinal error close to the equinoxes while (2) resulting in similar latitudes at both sides of the equinox, and (3) where positions fitted the shape and position of the oceans and inland seas. Final sun angles were between −5.5 to −5.0° for BAS loggers, −5.0 to −3.5° for Migrate Technology loggers without stalks, −5.5 to −4.5° for Migrate Technology loggers with stalks, and 0° for the Swiss Ornithological Institute loggers.
Stationary periods were delineated based on patterns in time of sunset and sunrise, using the function “changeLight” from the “GeoLight” package in R, with a minimum staging duration of 2 days. For each stationary period, the geographical centroid was calculated. For stationary periods with latitudes greatly affected by proximity to the equinox (e.g., resulting in positions in the central Indian Ocean), a latitude was assumed at the coastline north of the original position estimate, which was always in close proximity to other staging locations. Subsequently, stationary periods with geographical centroids closer than 200 km were joined. Stationary areas with centroids in the Arabian Sea, Persian Gulf or Pacific were defined as the wintering period. Staging areas preceding the wintering period were assigned to the autumn migration and those following the wintering period to spring migration. Departure from and arrival at the breeding area were calculated as the time needed to cover the great-circle distance to the first or last position estimate, respectively, at a speed of 13.3 ms−1 (Alerstam and Gudmundsson, 1999). Migration distance was measured using the sum of great-circle distances, using the “rdist.earth” function in the “fields” package in R, covered from the breeding site via the centroids of each staging site to the centroid of the first (autumn migration) or last (spring migration) wintering area. Similarly, distance traveled during winter was calculated as the great circle distance between staging areas assigned to the winter period. The fat load needed for the initial migratory movement in still air was estimated using the software package Flight v. 1.25 (Pennycuick, 2008). For each potential body mass (at increments of 1 g), the fat fraction in which the migration simulation finished with a lean body mass was estimated by an iterative process. Pennycuick (2008) defined lean body mass as the “body mass of a bird with zero fat reserves, but not actually starving.” Here, lean body mass was taken to be the minimum weight for each sex in our database, excluding one male of 24 g and one female of 28.0 g: 26.0 g for males (n = 440) and 29.3 g for females (n = 164). Note that taking a lower lean body mass results in higher fat fractions and thus larger potential flight ranges. After estimating the body mass required to cover the distance to the first stopover, the time required to fuel for this flight was calculated assuming a fat deposition rate (FDR) of 3.2% of lean body mass (Sikora and Zielinksi, 2000; Lindström, 2003). As no FDR values are known for red-necked phalaropes at the wintering areas, the sensitivity of migration speed was explored by plotting migration speed for a range of possible FDR values at each wintering ground (Supplementary Figure 1). In two individuals migrating in spring from the Pacific to the north-eastern North Atlantic, no stopovers of 2 or more days were identified. In these cases, the first leg was taken as the distance to the centroid of three clustered position estimates off Florida, which is near the first staging area of other individuals following the western route (Figure 1). Migration duration was taken as the number of days in transit between the breeding and the wintering area, plus the estimated time needed to fuel for the initial leg. Migration speed was calculated as the total migration distance divided by the migration duration.
The following parameters were derived for each track: migration distance, total migration duration (including stopovers and fuelling time for the first leg, see above), distance to the first staging area, length of the longest stopover, number of stopovers, migration speed, and timing of departure from and arrival at both the breeding and wintering area. First, t-tests were used to test whether any of the aforementioned parameters differed between sexes among Swedish birds, the only area with sufficient females to compare sexes (see Results). ANOVAs were then constructed comparing each of the parameters between four “regions:” “Atlantic” (Greenland, Iceland and Scotland), “Sweden” (Ammarnäs), “Norway” (Slettnes), and “Russia” (Tobseda and Erkuta). A contrast between “Atlantic” (hereafter referred to as “western” birds, populations or migration route) and the three other regions (hereafter referred to as “eastern” birds, populations or migration route) was used to test for differences in migration strategy parameters between the two flyways. The number of stopovers was compared between the flyways using the same contrast structure in a Poisson Generalized Linear Model (GLM). The number of stopovers per unit distance was tested using the same Poisson GLM with the log of the migration distance included as an offset. In addition to the analysis of the geolocator data, body mass measurements from breeding sites were compared in a Linear Mixed-effect Model (LMM) with flyway as the only main effect and site as a random effect, using the nlme package in R (Pinheiro et al., 2018). From these body mass measurements, maximum flight ranges were estimated using the relationship as derived from Pennycuick's model (see above). For comparison of fuel loads at staging sites, we obtained body mass measurements at the Bay of Fundy, Canada, along the western migration route, from Mercier (1985) and from saline lakes in Kazakhstan, along the eastern migration route, from Gavrilov et al. (1983).
To compare winter movement strategies between the two wintering areas, the number of staging areas was compared using a Poisson GLM and the duration of the longest stationary period and the total distance covered within the winter period were compared using ANOVAs with the same contrast structure as used in the analysis of migration characteristics. In addition, we linked phalarope movements to spatio-temporal patterns in food availability. First, net ocean primary productivity for 8-day periods, based on the Vertically Generalized Production Model (VGPM) algorithm (Behrenfeld and Falkowski, 1997), were obtained from O'Malley (2015). Second, a 300 km wide polygon parallel to the coast was drawn and split into four main areas: (1) northern Humboldt Current to the Pacific coast off Central America, (2) Red Sea via the Gulf of Aden and Oman to Pakistan, (3) Persian Gulf to the Gulf of Oman, and (4) East coast of Somalia. Areas were subdivided bins perpendicular to the coast, thus in longitude bins (Arabian Sea) or latitude bins (Pacific), each 100 km in width. Finally, to test whether tagged individual red-necked phalaropes were associated with areas of high primary productivity, for each 8-day period and longitude/latitude bin, the loge of the 95% quantile of primary productivity values was correlated with the number of staging red-necked phalaropes, using Poisson LMMs, with “area” and “longitude/latitude bin” as random effects to account for spatial correlation. To test whether wintering movements are directed toward areas with higher primary productivity, or a steeper decline in primary productivity (which could be due to higher grazing intensity by zooplankton), we calculated the difference in primary productivity and its slope between departure from one site and arrival at the next site and tested whether this differed from zero using an intercept-only LMM, with individual as a random effect.
In the Greenlandic bird, the logger was mounted to a leg flag and also recorded submersion in saline water every 3 s and summed the number of “wets” every 10 min. This “wet/dry” data was used to delineate migration flights (Battley and Conklin, 2017). Other loggers were back-mounted and only occasionally recorded submersion, and were unsuitable for delineating long flights.
Biometrics
We tested for differences in morphology between the two populations using biometric data from eleven breeding locations from Greenland to Taymyr, Russia. As females are larger than males (Cramp and Simmons, 1983), we built separate LMMs for each sex, comparing wing length, bill length and tarsus length between western and eastern birds, and with “breeding site” as a random effect. Wings can be longer either due to more pointedness of wings or due to larger body size. In absence of data on pointedness, we took tarsus length as a measure of body size and fitted a model of wing length by flyway and tarsus length.
Results
Sample Size
In total, 34 geolocator tracks (each track referring to 1 year of data between two breeding periods) of 26 individuals were obtained from eastern populations. From the western population, 10 tracks of 8 individuals were obtained. Nine tracks (1 from a western bird and 8 from eastern birds) were incomplete due to premature failure or a flat battery of the logger at the wintering areas; 5 of these failures happened in the second year of tracking. Repeated tracks were obtained for 2 western and 7 eastern individuals (see below). To compare movement strategy variables between western and eastern birds, only the first track of each individual was included. Also, the single Finnish bird was excluded as it had much higher variation in estimates of twilights and positions than the other loggers. The final dataset for comparisons of movement strategies thus included 8 full tracks from western birds (1 female, 7 males) and 22 full tracks plus 3 autumn migrations from eastern birds (6 females, 19 males).
Migration Routes
The data show two distinct migration routes from Western Palearctic red-necked phalaropes (Figure 1). All Fennoscandian-Russian birds migrated to the Arabian Sea (n = 26, including the Finnish bird), whereas those breeding at North Atlantic islands wintered in the Pacific; either in the northern Humboldt Current (n = 6) or off the westcoast of Central America (n = 2).
Sex Differences in Migration Strategy
Only the Swedish sample contained sufficient females (n = 5) and males (n = 7) to compare sexes. Between Swedish males and females, no migration strategy variables were significantly different, either during autumn or spring migration. Although the trends in our data comply with the expectation of earlier migration in females, overlap between sexes in timing rendered them non-significant (p > 0.1), but females arrived near-significantly earlier than males at the breeding area [t(1, 9) = −2.0, p = 0.078]. Like the Swedish birds, the single female from Norway fell within the range of values for all migratory strategy variables. She was earlier than most males in the timing of departure from the breeding area, arrival at and departure from the wintering area. However, she arrived later than most Norwegian males at the breeding area. Among the western birds, the single female departed from the Icelandic breeding area and arrived at and departed from the wintering area at the same time as the males, but arrived earlier at the breeding area. She performed the migration faster than most but not all males, using four stopovers in autumn and none in spring, resulting in a relatively short autumn migration and the shortest spring migration. Considering that no significant sex-differences in migration strategies were detected and the small overall sample size (especially for western birds), no sex-effect was considered in the results we present for subsequent tests comparing western and eastern populations. Nevertheless, analyses were repeated with females excluded to see if the results would change qualitatively.
Autumn Migration Strategy
Mean departure time from the breeding grounds was slightly earlier for western than eastern birds [ = 9 July, 19 July, t(3, 29) = −2.7, p = 0.012, Table 1]. However, mean arrival at the wintering grounds did not differ between the two flyways [ = 10 September, = 31 August, t(3, 29) = 0.9, p = 0.400]. Migration duration was slightly longer among western birds [ = 73.5 d, = 52.9 d, t(3, 29) = 3.3, p = 0.002, Figure 2], while autumn migration distance was 1.5 times longer in western than in eastern birds [ = 9,238 km, = 6,069 km, t(3, 29) = 12.1, p < 0.001]. The initial migration leg from the breeding area to the first stopover site was similar in length in western and eastern birds [ = 2,916 km, = 2,638 km, t(3, 29) = 1.3, p = 0.218]. During autumn migration of both western and eastern birds, the longest stopover occurred at about 45°N; western birds staged in (the vicinity of) the Bay of Fundy, Canada, whereas eastern birds used areas near the Black Sea, NW and NE of the Caspian Sea, the Aral Sea, and areas in the vicinity of these seas. The longest stopover was shorter in western than in eastern birds [ = 12.4 d, = 22.2 d, t(3, 29) = −2.8, p = 0.008]. It should be noted, however, that some birds had several stopovers around 45°N. If the duration of the stopovers between 40 and 50°N is summed for each bird, western birds stage significantly shorter between these latitudes than eastern birds [ = 16.2 d, = 24.2 d, t(3, 29) = −2.2, p = 0.037]. In addition to these long stopovers at around 45°N, shorter stops were made both before and after the main stopover. Significantly more stopovers were made by western birds than eastern [ = 3.9, = 2.0, t(3, 29) = 2.6, p = 0.010], but this difference disappeared when correcting for the migration distance [t(3, 29) = 0.7, p = 0.468], indicating that mean migration distance between staging sites was similar between the flyways. The number of days on migration, not classified as staging, was higher among western than eastern birds ( = 37.3 d, = 15.5 d, z3, 29 = 5.0, p < 0.001). Overall migration speed was similar between western and eastern birds [ = 132 km d−1, = 120 km d−1, t(3, 29) = 1.4, p = 0.165]. FDR before departure from the breeding grounds effected slower migration speeds, but this effect leveled off at higher migration speeds. In addition, FDR had little effect on differences in migration speed between the two populations: only when FDR would be much lower in eastern breeding areas than in western breeding areas, would the populations differ in migration speed (Supplementary Figure 1). Qualitatively identical results were found when excluding females from the autumn migration analysis, except that both breeding departure timing [t(3, 20) = −2.0, p = 0.062] and number of stopovers were near-significantly different between eastern and western birds [z(3, 20) = 1.7, p = 0.096].
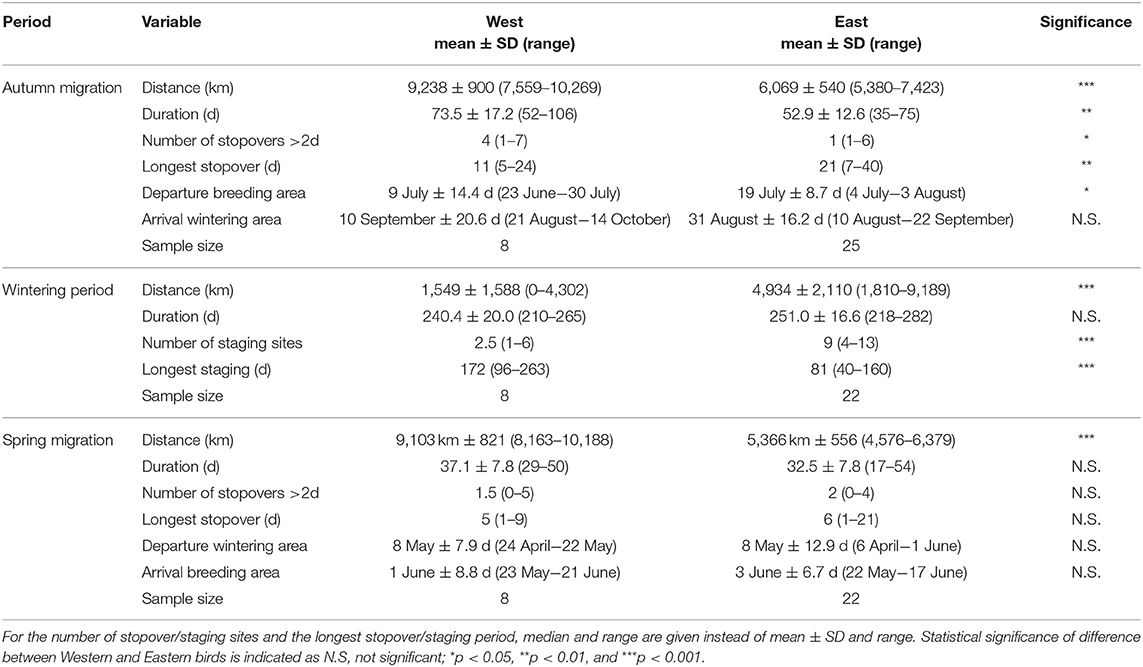
Table 1. Characteristics of autumn and spring migration of red-necked phalaropes migrating between north-eastern North Atlantic breeding areas and the Pacific (“West”) and between Fennoscandian-Russian breeding areas and the Arabian Sea (“East”).
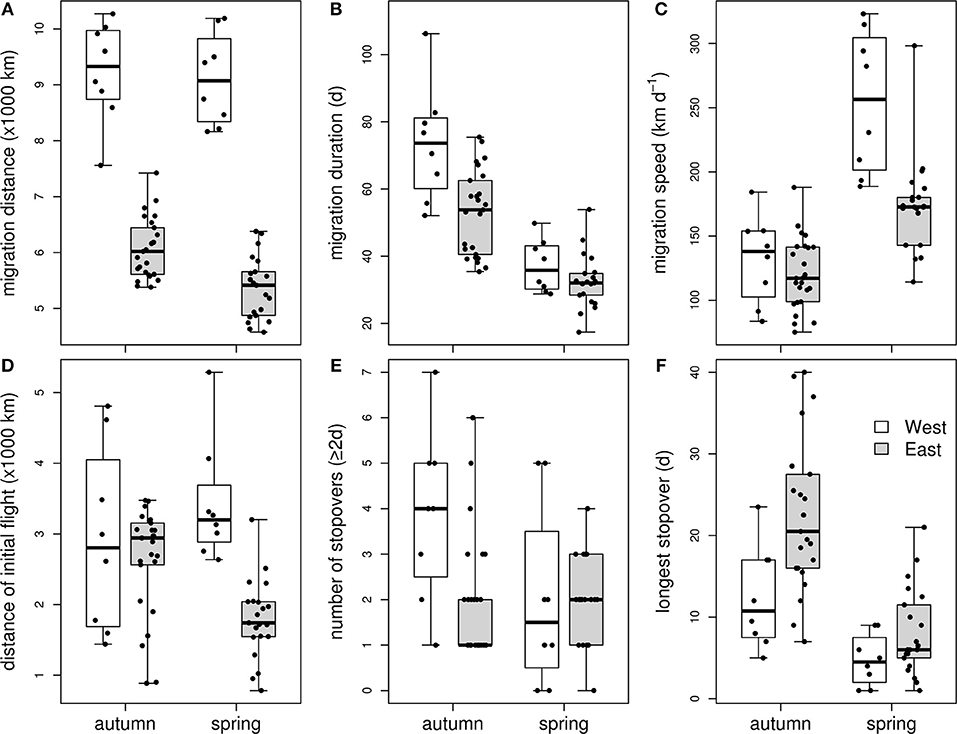
Figure 2. Characteristics of autumn and spring migration of Red-necked Phalaropes migrating from breeding sites in Greenland, Iceland, and Scotland to the Pacific (“West”, white boxplots) or migrating from Fennoscandian-Russian breeding sites to the Arabian Sea (“East”, gray boxplots): migration distance (A), duration of the migration periods (B), migration speed (C), distance of the first migration leg (D), number of stopovers of at least 2 days (E), and the duration of the longest stopover (F).
Maximum Range of First Autumn Leg
The distance from the breeding area to the first stopover was similar in western and eastern birds (see above) and consistent with body mass measurements from the breeding grounds, which were not significantly different between the areas for both males [t(10, 455) = 1.4, p = 0.195] and females [t(5, 162) = −0.5, p = 0.644]. Predicted flight range for model-based averages of body mass are 2,532 km for western and 2,642 km for eastern males and 4,260 km for western and 3,928 km for eastern females. Repeating this for the 75% quantile body mass per flyway translates into 3,214 km for western and 2,675 km for eastern males, and 3,033 km for western and 3,300 km for eastern females. Similarly, flight range for individuals with maximum body mass was predicted to be 4,573 km for western and 5,036 km for eastern males, and 4,646 km for western and 5,036 km for eastern females (Figure 3). Flight ranges predicted for mean and 75% quantile body mass were similar to the ranges inferred from our geolocator data, but flight range estimates based on maximum body mass were higher than our longest recorded first legs (Figure 2).
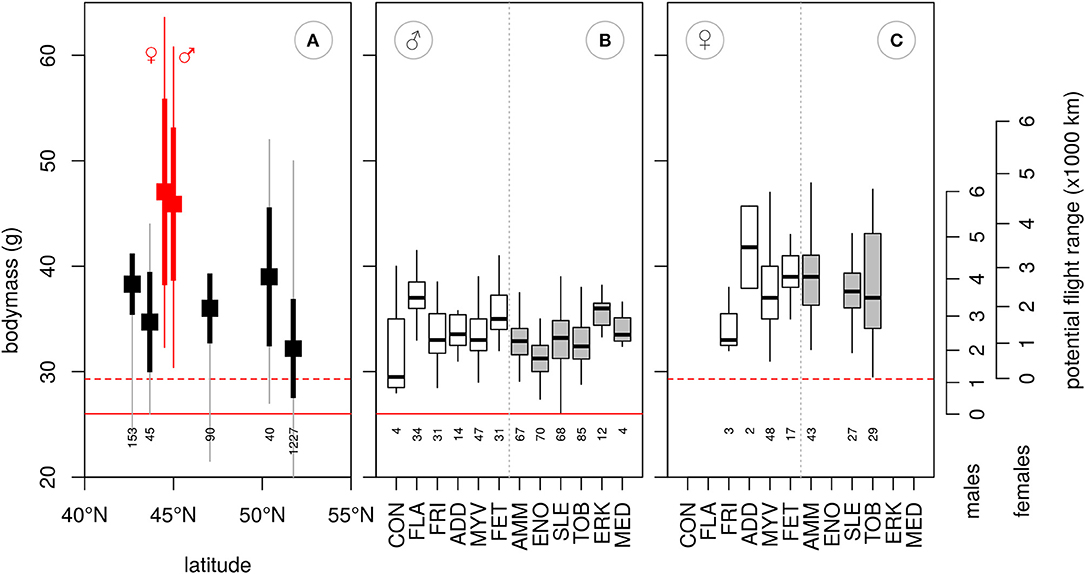
Figure 3. Mean body mass obtained from (A) female and male Red-necked Phalaropes at autumn staging areas along the western (red, Bay of Fundy, Canada, Mercier, 1985), and unsexed birds from the eastern migration route (black, various sites in Kazakhstan, Gavrilov et al., 1983). Thick vertical lines represent ±SD, thin lines are ranges. Body mass of males (B) and females (C) at breeding sites. Western (white boxes) and eastern (gray boxes) populations are divided by a vertical gray dotted line. Whiskers extent to minimum and maximum values. Lean body mass of each sex, as inferred from our sample, are shown by the red horizontal solid (males) and dotted (females) lines. The right axis shows the potential maximum flight range for males and females (see main text). Breeding sites are ordered from West to East, and are abbreviated as follows: CON, Constable Pynt; Greenland, FLA, Flatey Island, Iceland; FRI, Fridland, Iceland; ADD, Að*aldalur, Iceland; MYV, Myvatn, Iceland; FET, Fetlar, Scotland; AMM, Ammarnäs, Sweden; ENO, Enontekiö, Finland; SLE, Slettnes, Norway; TOB, Tobseda, Russia; ERK, Erkuta, Russia; MED, Medusa Bay, Russia. Numbers below box-plots represent sample sizes.
Spring Migration Strategy
Departure time from the wintering grounds did not differ between the two wintering areas [ = 8 May, = 8 May1, t(3, 26) = 0.7, p = 0.511], and arrival at the breeding grounds was also similar between western and eastern birds [ = 1 June, = 3 June, t(3, 26) = −1.1, p = 0.293, Table 1]. Like in autumn, spring migration distance was ca. 1.7 times longer in western birds as compared to eastern birds [ = 9,103 km, = 5,366 km, t(3, 26) = 15.3, p < 0.001, Figure 2], but migration duration did not differ [ = 37 d, = 32 d, t(3, 26) = 1.5, p = 0.147]. The migration strategy in spring was similar to the autumn migration strategy, with a main stopover at about 45°N (using the same or nearby areas as in autumn). At the main stopovers, western birds staged about as long as eastern birds [ = 4.8 d, = 8.0 d, t(3, 26) = −1.3, p = 0.191]. The number of stopovers was not different between western and eastern birds [ = 2.0, = 2.0, z(3, 26) = −0.1, p = 0.900], but when corrected for migration distance, a near-significant difference emerged [z(3, 26) = −1.9, p = 0.063]. Interestingly, two western birds (including the single female) and one eastern male from Slettnes did not stage for as many as 2 or more days anywhere along the spring migration route. Visual inspection of their tracks suggest they staged once (western male), twice (western female) or thrice (eastern male) for 1.5 days, i.e., under the threshold of 2 days used in delineation of staging periods. Nevertheless, no more days between staging areas (i.e., days that were not classified as staging periods) were spent by western birds than eastern birds [ = 19.6 d, = 19.4 d, z(3, 26) = 0.1, p = 0.883], but this became significant when correcting for migration distance [z(3, 26) = −2.8, p = 0.005]. Thus, western birds covered more distance without stopovers than eastern birds. In spring, their first leg from the wintering grounds was significantly longer than that of eastern birds [ = 3,304 km, = 1,052 km, t(3, 26) = 5.9, p < 0.001]. Their overall migration speed was also significantly higher [ = 255 km d−1, = 172 km d−1, t(3, 26) = 4.3, p < 0.001]. Particularly the migration speed of western birds was affected by FDR before departure from the wintering grounds (Supplementary Figure 1). FDR had little effect on the difference in migration speed: the difference in migration speed would become non-significant only if FDR would be low in the Pacific wintering area (Supplementary Figure 1). Excluding females from the spring migration analysis led to qualitatively identical results.
Wet/dry data from the Greenlandic bird with the geolocator attached to a leg flag showed that long (>3 h) dry periods, assumed to reflect periods in flight, usually started within an hour of sunset and lasted into the morning of the next day (Supplementary Figure 2). Hence, this individual migrated mainly at night, but also performed a non-stop flight of 48 h when crossing the Caribbean in spring. In this individual, the number of flights was much greater than the number of stopovers of two or more days recorded for its migration using the methods outlined above (21 flights vs. 6 staging periods in autumn 2013, 10 flights vs. 2 staging periods in spring 2014, and 21 flights vs. 3 staging periods in autumn 2014). Our results suggest that distances between main staging areas were covered by migrating only by night.
Winter Movement Strategies
Winter movement strategies differed markedly between birds in the two wintering areas (Figures 1, 4; Table 1). Birds wintering in the Pacific used fewer sites than those wintering in the Arabian Sea [ = 2.9, = 8.8, z(3, 26) = −4.926, p < 0.001]. Among western birds, the longest staging period was longer [ = 240 d, = 251 d, t(3, 26) = 4.5, p < 0.001]. Their summed great-circle distances between staging areas were shorter [ = 1,549 km, = 4,934 km, t(3, 26) = −3.8, p < 0.001]. Excluding females led to qualitatively identical results. Winter movements of western birds mainly occurred at the start and end of the wintering period, when birds moved between the northern Humboldt Current and areas off central America. In the Arabian Sea, itinerant individuals often arrived at the winter quarters off Oman before moving to either off Pakistan or off Somalia (in particular the Gulf of Aden). Such itinerant individuals shifted location up to several times (4–13), before moving to stage in the Persian Gulf or the Gulf of Oman in early spring. More or less resident individuals in the Arabian Sea staged in the Gulf of Aden, Gulf of Oman or off the coast of Pakistan during the entire winter. In summary, individuals wintering in the Pacific mostly stayed in the same area (residency), whereas individuals wintering in the Arabian Sea showed a larger range of behaviors, from using only a small area to multiple, widely separated areas (itinerancy). Wintering movements appear to correspond to spatio-temporal patterns in ocean primary productivity (Figure 5). Primary productivity correlated significantly with number of phalaropes both in the Arabian Sea (z = 6.0, p < 0.001) and in the Pacific (z = 3.0, p = 0.003). However, we did not find evidence for higher primary productivity at arrival at a new site relative to departure from the previous site (z = 0.9, p = 0.369), or for higher primary productivity during staging at a new site compared to the same period at the previous site (z = 0.5, p = 0.607).
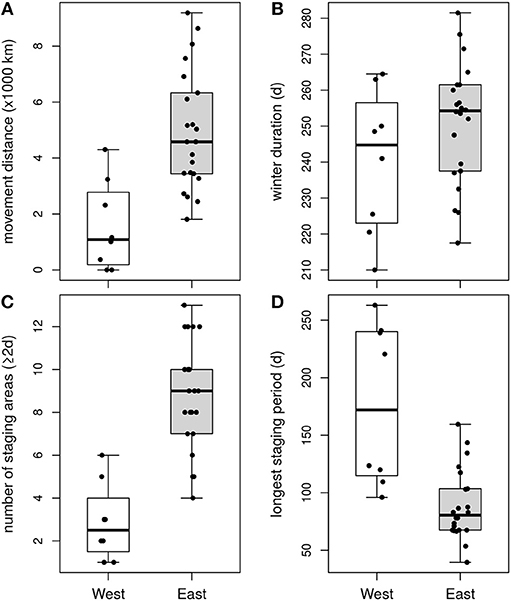
Figure 4. Characteristics of winter movements of red-necked phalaropes wintering in the Pacific (“West”, white boxes) and the Arabian Sea (“East”, gray boxes): cumulative distance between staging areas (A), duration of the wintering period (B), number of staging areas (C), and duration of the longest staging period (D).
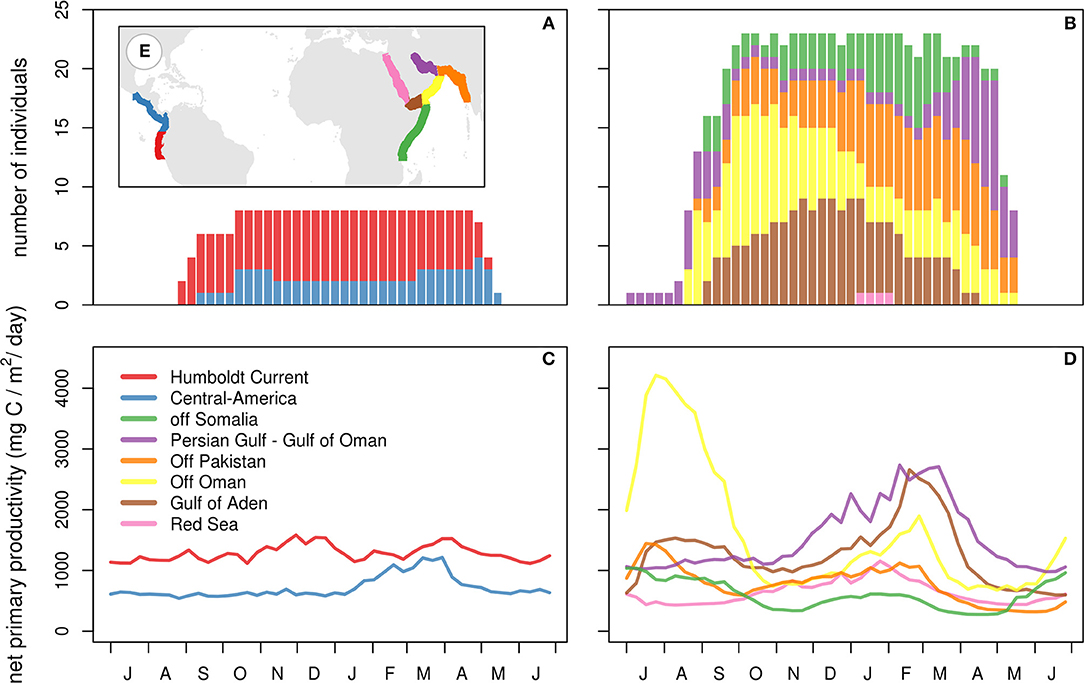
Figure 5. Number of tracked red-necked phalaropes (A,B) and mean net primary productivity (C,D) in each of two sectors in the Pacific (A,C) and six sectors in the Arabian Sea and adjacent areas (B,D); see (E) for configuration of the sectors.
Repeated Tracks
Data from 2 years were obtained for one individual from Greenland (male), one from Iceland (male), three from Sweden (females), and three from Norway (one female, two males). In addition, data for 3 years were obtained for one male from Norway. Halfway along the final track, four loggers failed prematurely: one in late January and three in February. Locations of and time spent at staging and wintering sites appear fairly consistent between years (Figure 6). Individuals wintering in the Arabian Sea mostly had very similar routes between the same main sites within the wintering period, although some exceptions occurred (for example, Figure 6F). The number of individuals with repeated tracks was too small for statistical tests of repeatability.
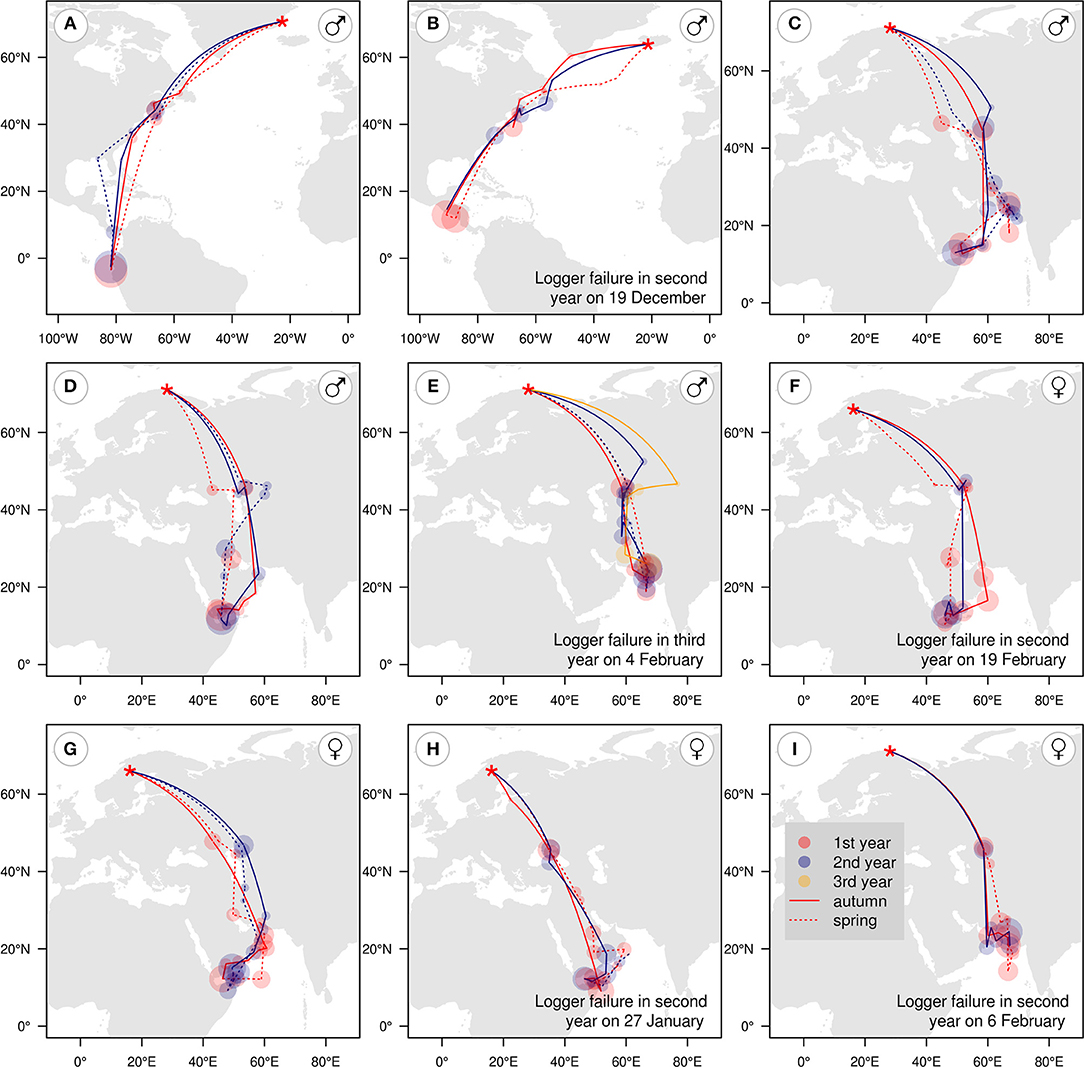
Figure 6. Migration stopovers and wintering areas of five males and four female red-necked phalaropes tracked over 2 years from breeding sites in Greenland (A), Iceland (B), Norway (C–E,I), and Sweden (F–H), with breeding sites indicated by red stars. Shaded circles show staging areas in the first (red), second (blue), or third (orange) year of tracking, with circle size proportional to staging duration and staging areas connected by great-circle lines (which do not necessarily represent routes taken) for autumn and early winter (solid lines) and late winter and spring (dotted lines).
Biometrics
In both sexes, wings were longer in western populations [females: = 116.6 mm, = 112.9, t(4, 152) = 4.4, p = 0.013; males: = 111.8, = 109.0, t(9, 415) = 5.1, p < 0.001, Figure 7]. In males, tarsi were longer in western populations; in females, this was only near-significant [females: = 21.5, = 20.4, t(3, 111) = 3.0, p = 0.056; males: = 21.4, = 20.2, t(7, 297) = 9.7, p < 0.001]. Wings remained significantly longer in western populations in each sex when including tarsus length in the model [females: flyway t(3, 109) = 3.6, p = 0.037; tarsus t(3, 109) = 2.8, p = 0.006; males: flyway t(7, 294) = 4.0, p = 0.005; tarsus: t(7, 294) = 3.2, p = 0.002]. Bill lengths were not different [females: = 21.9, = 21.4, t(3, 137) = 0.7, p = 0.511; males: = 21.1, = 21.0, t(7, 316) = −0.1, p = 0.914].
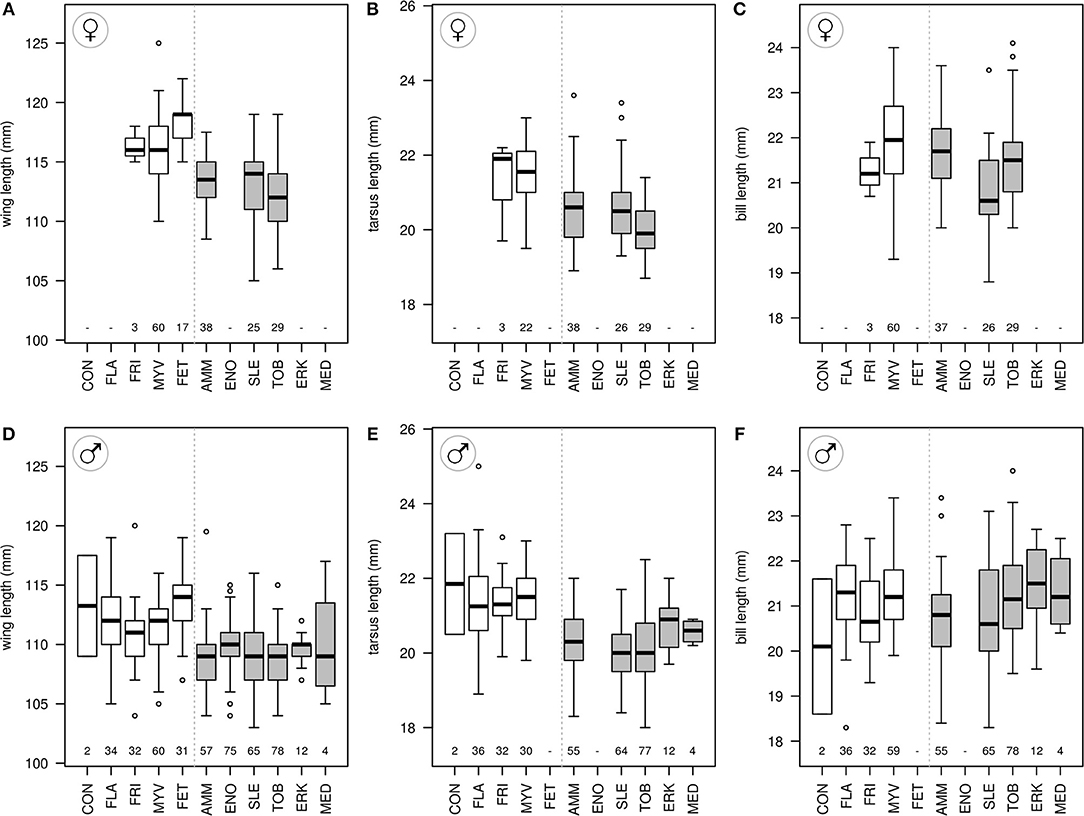
Figure 7. Biometrics (wing, tarsus, and bill length) for female (A–C) and male (D–F) red-necked phalaropes for western (white boxes) and eastern (gray boxes) breeding sites. Boxes represent 50% of the values with the median as a horizontal line, and vertical bars extend to 95% quantiles. For abbreviations of sampling sites, see Figure 3. Numbers below boxplots show sample sizes.
Discussion
Our study demonstrates the existence of two distinct populations of red-necked phalaropes within the Western Palearctic: one that breeds in Fennoscandia and Russia and winters in the Arabian Sea (Indian Ocean) and another that breeds on islands in the north-eastern North Atlantic (Greenland, Iceland and Scotland) and winters in the Pacific. The migration route across the Atlantic and into the Pacific was already suggested in part or wholly by earlier authors (Alerstam, 1990; Smith et al., 2014), but is now confirmed for birds breeding in Greenland and Iceland. The eastern route to the Arabian Sea was already shown for Swedish males (van Bemmelen et al., 2016), but is now also shown for other Fennoscandian and Russian populations. The contrast in the availability of suitable saline stopover habitat along the two routes and the contrast in spatio-temporal variability in ocean productivity between the two wintering areas provided the rare opportunity to study the effect of non-breeding habitat on large-scale movement strategies within a species. Both autumn and spring migration strategies differed between the oversea route to the Pacific and the overland route to the Arabian Sea. Red-necked phalaropes wintering in the strongly seasonal Arabian Sea moved between several areas whereas those wintering in the non-seasonal eastern Pacific remained roughly in a single area.
The migration of red-necked phalaropes migrating oversea to the Pacific was more evenly spread over staging periods along the migration route than those heading overland to the Arabian Sea, which showed a prolonged staging period at about 45°N. According to optimal migration theory, whenever suitable stopover habitat is abundant, short flights and refueling periods should be alternated as this minimizes the costs of carrying fuel loads (Alerstam and Lindström, 1990). Thus, when habitat is uniformly distributed and of equal quality along the migration route, regular spacing of many stopovers, each visited for a similar time period, is expected. However, variation in quality between potential staging sites can induce skipping behavior and unequal staging durations (Gudmundsson et al., 1991; Klaassen et al., 2011). In red-necked phalaropes following the western migration route, variation in quality of habitat is indicated by the non-uniform distribution of staging periods. Whereas no staging areas were identified in the early and late parts, a prolonged stopover was identified at or near the Bay of Fundy, a well-known staging site where our tagged birds remained for about 12 days, somewhat less than the 15 or 20 days estimated using other methods (Mercier, 1985; Hunnewell et al., 2016). Here, staging red-necked phalaropes fatten up considerably more than what would be expected for a strategy of making short flights with several short stops along the western Atlantic coast (Figure 3, Mercier, 1985), indicating a strategy of overloading (Gudmundsson et al., 1991). Despite the high cost of transporting fuel loads, overloading seems a common strategy among waders (Piersma, 1987; Gudmundsson et al., 1991; Alves et al., 2012) and can be expected in time-minimized migrations when fuelling rates at successive stopovers are lower. Overloading at the Bay of Fundy would enable red-necked phalaropes to stop and refuel shortly at sites south to Florida and then to rapidly traverse the relatively unproductive waters of the Caribbean Sea, an area where we identified only two short autumn stopovers among all individuals (Figure 1). In contrast to the western route in autumn, overloading does not seem to occur at the main staging areas along the eastern route, as indicated by body masses obtained in Kazakhstan and the Caspian Sea (Figure 3, Gavrilov et al., 1983) that seem enough to cover the last stretch to the Arabian Sea. Field observations on fuelling rates at all potential staging sites along the migration route are needed to ultimately understand the migration behavior in the red-necked phalarope.
Migration strategies also differed between the two flyways in spring. A two-day non-stop flight allowed western birds to quickly traverse the unproductive waters of the Caribbean Sea (Supplementary Figure 2), after which migration was continued in shorter, mainly nocturnal, flights (Rubega et al., 2000). In contrast, a strategy with several stopovers at scattered wetlands was adopted by eastern individuals to reach the main stopover areas around 45°N. Spring migrations were also notably fast among red-necked phalaropes migrating from the Pacific to the north-eastern North Atlantic, with few or no stops longer than 2 days. A rapid spring migration is usually explained by selection acting at the breeding grounds, e.g., timely arrival at the breeding grounds to compete for mates or territories, or to achieve optimal timing of reproduction relative to seasonal peaks in food abundance (Nilsson et al., 2013). However, as both populations have similar advantages of timely arrival at the breeding grounds, the difference in spring migration speeds is more likely to be explained by differences along the migration route or at the wintering grounds. Explanations for faster speeds may include the occurrence of favorable winds, such as the westerlies prevailing north of the Tropic of Cancer, and potentially higher fuelling rates along the western route between Florida and the Bay of Fundy, than at similar latitudes along the eastern route.
The differences in migration strategies between red-necked phalarope populations suggest flexible adjustment of migration strategies within species. In contrast, the migration strategies of thrushes, swallows and raptors showed consistent autumn migration strategies among populations following different routes (Delmore et al., 2012; Fraser et al., 2013; Trierweiler et al., 2014), demonstrating rigid migration strategies, as has been suggested in several other studies on passerines (Irwin and Irwin, 2004; Bensch, 2009). The effect size of habitat distribution on movement strategies likely depends on the flexibility of habitat requirements for a given species, the absolute degree to which the distribution of suitable habitat differs between compared routes or sites, and the relative quality (fuel rate and predation risk) between sites along each route. Thus, differences in movement strategies are more likely to be detected in diet or habitat specialists, such as the red knot Calidris canutus (Buehler and Piersma, 2008) or the red-necked phalarope, than for generalist species for which habitat is more widespread, and more evenly distributed along the migration route. As specialists will have less alternative migration routes and strategies when habitat quality changes, they are required to make larger behavioral adjustments than generalist species, rendering specialists particularly vulnerable. Large-scale tracking studies like ours—in particular of specialist species—is thus critical to understand the potential effect of threats to migrants (Sutherland et al., 2012).
The westward migration route to the Pacific is surprising considering that the migration distance to the Pacific is longer than to the Arabian Sea. The longer migration distance and different migration strategy employed by the western birds may explain why the wings of red-necked phalaropes breeding at Greenland, Iceland and Scotland are longer than those of birds breeding in Fennoscandia and Russia. Assuming longer wings are also more pointed, an association between migration distance and wing length is consistent with other studies (Alerstam, 1990; Leisler and Winkler, 2003; Fiedler, 2005; Altizer and Davis, 2010), and would be explained by selection for aerodynamically more efficient pointed wings for longer migration. As shown by Minias et al. (2015), wing pointedness is a better predictor for migration strategy among wader species than wing length, but only wing length was measured in our study. That variation in wing length of red-necked phalaropes is associated with migration distance is additionally supported by the wing lengths of Canadian populations, which are shorter than our samples from Greenland, Iceland and Scotland and similar to Fennoscandian/Russian red-necked phalaropes. The Canadian populations presumably winter in the eastern Pacific and do not have to cross the Atlantic (Reynolds, 1987).
Red-necked phalaropes wintering in the Pacific showed only minor movements, whereas most individuals wintering in the Arabian Sea moved around considerably throughout winter (van Bemmelen et al., 2016). Wintering movements have received growing attention in recent years, especially in species wintering in the Neotropics and in Africa (Fraser et al., 2012; Heckscher et al., 2015; Norevik et al., 2019). Also in seabirds, wintering movements occur (Phillips et al., 2005; Hedd et al., 2012; Orben et al., 2015). Although we are not aware of studies contrasting wintering movement strategies between distinct wintering areas in a single species, differences in wintering movement strategies between populations of the same species with overlapping wintering areas have been reported in terrestrial species (Stutchbury et al., 2016; Koleček et al., 2018). Itinerant strategies occurred among great reed warblers Acrocephalus arundinaceus wintering in sub-Saharan non-breeding sites; with translocations over larger distances by those breeding and wintering further eastwards (Koleček et al., 2018). Wintering movement strategy of common swifts Apus apus wintering in Africa appears to correlate with breeding origin, with both Swedish and Dutch birds sharing a major wintering area in the Congo basin, but only Dutch birds vacating this area midwinter to make a round trip to south-east Africa (Åkesson et al., 2012; Klaassen et al., 2014). In red-necked phalaropes, the occurrence of different wintering movement strategies within the same species suggests flexibility of movement behavior within the species.
The difference in movement strategies between red-necked phalaropes wintering in the Pacific and in the Arabian Sea is consistent with our expectation of how birds should respond to differences in spatio-temporal variation in primary productivity between the two wintering areas. Primary productivity shows only minor seasonal variation in the Pacific (Chavez and Messié, 2009), but large spatio-temporal variability driven by monsoon winds in the Arabian Sea (Longhurst, 2006). Although phalaropes mainly occupied areas with high primary productivity, movements did not appear to result in higher experienced primary productivity. In great reed warblers and pallid swifts Apus pallidus, intra-tropical movement of individuals is explained by improved conditions (inferred from remotely sensed indices of food availability) at destinations in comparison to where they initially staged (Koleček et al., 2018; Norevik et al., 2019). For red-necked phalaropes, however, remotely sensed primary productivity may not be a reliable proxy of food availability, as red-necked phalaropes feed on zooplankton which may not be directly related to primary productivity (Cramp and Simmons, 1983; Brown and Gaskin, 1988). Data on distribution and abundance of zooplankton is however scant and scattered in both time and space. A further complication when linking movement to food availability in our study species is the spatial resolution of both the tracking data (which in the case of geolocators deployed on seabirds is ca. 185 km; Phillips et al., 2004) and the remotely sensed productivity (cell size of 1/6 a degree, approximately 8 km in the Arabian Sea). Both spatial resolutions are coarser than the small-scale ephemeral phenomena, such as thermal oceanic fronts, that may be targeted by red-necked phalaropes at sea (Haney, 1985; Brown and Gaskin, 1988).
The large variation between individuals in the number of movements within the Arabian Sea suggests that itinerancy is facultative, as has been shown for several other species wintering in the Neotropics or Africa (Stutchbury et al., 2016; Koleček et al., 2018). At the same time, wintering movement patterns seem consistent within individual red-necked phalaropes between years (Figure 6). High individual consistency in non-breeding movement patterns appears to be widespread among seabirds (Dias et al., 2011; McFarlane Tranquilla et al., 2014; van Bemmelen et al., 2017) and is hypothesized to develop during an explorative phase in the pre-breeding years (Pulido, 2007; Guilford et al., 2011; Senner et al., 2015). If this is the case, then given that the pre-breeding period lasts several years in most seabirds (Weimerskirch, 2002), but only 1 year in red-necked phalaropes (Schamel and Tracy, 1988), individuality in itineraries may arise in a single non-breeding season.
Migratory divides can co-occur in areas where multiple species have secondary contact zones after recolonization of northern breeding areas from southern ice age refugia, or in areas that are at similar migration distances from suitable wintering areas or at locations that present a barrier to migration (Alerstam and Gudmundsson, 1999; Newton, 2010; Møller et al., 2011). For example, a migratory divide at a longitude of about 100°E is shared among many Palearctic birds breeding in the Arctic (Alerstam and Gudmundsson, 1999) and central Europe or Scandinavia among European passerines (Møller et al., 2011). Among Nearctic birds, no area with co-occurring migratory divides has been identified, but several species with a circumpolar breeding distribution have a migratory divide in Arctic Canada and/or have evolved into different (sub)species that migrate either within the New World or to the Old World. However, the position of the migratory divide among Western Palearctic red-necked phalaropes is not shared with other species. The south-eastward migration of Scandinavian and Russian populations of phalaropes is shared with a small number of species, such as broad-billed sandpiper Calidris falcinellus, little ringed plover Charadrius dubius and red-spotted bluethroat Luscinia svecica svecica (Verkuil et al., 2006; Hedenström et al., 2013; Lislevand et al., 2015), but the westward migration of populations from the north-eastern North Atlantic to the Pacific is unique. The migration route to the Pacific is highly suggestive of a biogeographic legacy, wherein the Nearctic breeding population expanded eastwards while retaining the migration route to the Pacific wintering area. Considering no geographic plumage or biometry variation has been described for the red-necked phalarope (Cramp and Simmons, 1983), this hypothesis can best be tested in a future population genetic study. Migratory divides delineating the breeding populations migrating to the East Indies are still unknown (Mu et al., 2018) but could be revealed by tracking Red-necked Phalaropes from breeding areas in Siberia and the Nearctic. The divide between birds wintering in the East Indies and eastern Pacific will indicate what part of the Canadian population, besides the populations from the north-eastern North Atlantic, may have been affected by the huge but unexplained population crash observed in the Bay of Fundy in the 1980s (Nisbet and Veit, 2015). Siberian and Nearctic breeding populations may migrate oversea as well as overland to the wintering areas in the East Indies and eastern Pacific (Jehl, 1986; Rubega et al., 2000; Mu et al., 2018), providing further opportunities to test the effect of habitat on migration strategies. The observed migration pattern of Western Palearctic birds also raises the question of why red-necked phalaropes apparently do not winter in substantial numbers in productive waters in the tropical Atlantic, such as the Canary Current (Camphuysen and van der Meer, 2005). Potential explanations for their absence in the Atlantic include a lack of suitable stopover sites along the route to reach these areas, or competition with the larger but ecologically similar gray phalarope Phalaropus fulicarius, with which no overlap in wintering area occurs in the Pacific (Cramp and Simmons, 1983). Despite being absent from the tropical Atlantic, the differences in both migration strategies and wintering movement strategies between populations indicate adjustment of movement strategies to habitat distribution within the species.
By tracking individual migratory birds from two distinct populations and capitalizing on international collaboration, our study provides a rare demonstration of how habitat distribution shapes large-scale movement strategies over the entire non-breeding period. The added value to previous studies is that we (1) demonstrate population differences in movement strategies within a species, (2) base our results on tracking data at the individual level, and (3) show that movement strategies are largely consistent within individuals. The individual consistency of movement strategies in adults suggests variation between individuals may best be regarded as the result of developmental plasticity (Piersma and Drent, 2003; Gill et al., 2014). Developmental plasticity may be an important mechanism for population-level adjustments of movement strategies to habitat distribution in the red-necked phalarope. Thus, mapping the ontogeny of movement strategies and how individual strategies affect fitness will be key to understanding the origin of flexibility in movement strategies. Understanding flexibility will be important when considering a species' ability to respond to (climate-induced) environmental change (Parmesan and Yohe, 2003; Chen et al., 2011). Given the decline of many populations of long-distance migratory species (Møller et al., 2008; Both et al., 2010), more studies like ours are needed to understand how species characteristics affect the flexible adjustment of movement strategies to habitat availability at individual and population-levels.
Data Availability
All datasets generated for this study are included in the manuscript and/or the Supplementary Files.
Author Contributions
YK and JG-S initiated our collaboration. RvB, IT, RR, and RK conceived the focus of the manuscript. RvB and RR analyzed the data. RvB wrote the first draft of the manuscript. All authors collected geolocator and/or biometric data and provided critical feedback on the manuscript.
Funding
RvB was funded by the Netherlands Organization for Scientific Research (project number 866.13.005) and supported by the LUVRE project. We also thank the European Union (FP7-PEOPLE-2013-CIG, 618841) for funding our research. BM and SH were supported by Fram Center and RR was supported by a postdoctoral contract of the Juan de la Cierva program, from the Spanish Ministerio de Ciencia e Innovación (JCI-2012-11848, CGL2013-42585-P, CGL2016-78530-R). Work at Constable Pynt by OG and LB (part of program 1,036 Interactions) were supported by the French Polar Institute, IPEV. Work at Fetlar was funded by the RSPB and the Shetland Ringing Group. AL received financial support from the Academy of Finland (grant 275606). AS was supported through the grant of RFBR #18-05-60261 Arctic, JAA from FCT (SFRH/BPD/91527/2012) and BÞ from RANNIS (152470-052) and University of Iceland equipment fund. KV received support from Kone foundation.
Conflict of Interest Statement
The authors declare that the research was conducted in the absence of any commercial or financial relationships that could be construed as a potential conflict of interest.
The handling editor declared a shared affiliation, though no collaboration, with two of the authors, BM and SAH, at the time of review.
Acknowledgments
Our study would not have been possible without the help and enthusiasm of the many fieldworkers. Ammarnäs: Piet Admiraal, Christian Brinkman, Michiel Elderenbosch, Christian Hoefs, Vincent Hin, Johannes Hungar, Guido Keijl, Fons de Meijer, Morrison Pot, and Bram Ubels. Also, thanks to Martin Green and Åke Lindström for help in various ways. Erkuta: Jasper Koster, Brigitte Sabard, Vladimir Gilg, and Vadim Heuacker. Enontekiö: The Kilpisjärvi waterbird monitoring expedition: Daniel Burgas, Heikki Eriksson, Sara Fraixedas, Sanna Mäkeläinen, Hanna Laakkonen, Petteri Lehikoinen, Mari Pihlajaniemi, Jarkko Santaharju, and Jenni Santaharju. Slettnes: Daniel van Denderen, Jan van Dijk, Daan Liefhebber, Maria van Leeuwe, Morrison Pot, Marc van Roomen, Janne Schekkerman, Cees Tesselaar, and Rinse van der Vliet. Tobseda: Jasper Koster, Thomas Lameris, Stefan Sand, and Kees Schreven. Constable Pynt (part of program 1,036 Interactions, supported by the French Polar Institute, IPEV): Brigitte Sabard, Adrian Aebischer, Antoine Dervaux, Eric Buchel, Vadim Heuacker, Mickael Sage, and Vladimir Gilg. Fridland (Flói): Verónica Méndez, Camilo Carneiro, Harry Ewing, and Einar Gunnlaugsson. Fetlar: George Petrie, Pete Ellis, Phil Harris, and Roger Riddington. Francine Mercier kindly provided the raw body mass measurements of phalaropes from her 1980s study in the Bay of Fundy. Thanks to Christoph Mayer and Felix Liechti (Swiss Ornithological Institute) for providing loggers and to Foto Fennica for funding the Finnish loggers. Thanks to Linda McPhee for improving the readability of the manuscript, and to the editor and two referees for helpful comments that improved the quality of the manuscript.
Supplementary Material
The Supplementary Material for this article can be found online at: https://www.frontiersin.org/articles/10.3389/fevo.2019.00086/full#supplementary-material
References
Åkesson, S., Klaassen, R., Holmgren, J., Fox, J. W., and Hedenström, A. (2012). Migration routes and strategies in a highly aerial migrant, the common swift Apus apus, revealed by light-level geolocators. PLoS ONE 7:e41195. doi: 10.1371/journal.pone.0041195
Alerstam, T., and Gudmundsson, G. A. (1999). Migration patterns of tundra birds: tracking radar observations along the Northeast Passage. Arctic 52, 346–371. doi: 10.14430/arctic941
Alerstam, T., and Lindström, Å. (1990). “Optimal bird migration: the relative importance of time, energy and safety,” in Bird Migration: The Physiology and Ecophysiology, ed E. Gwinner (Berlin: Springer), 331–351.
Altizer, S., and Davis, A. K. (2010). Populations of monarch butterflies with different migratory behaviors show divergence in wing morphology. Evolution 64, 1018–1028. doi: 10.1111/j.1558-5646.2010.00946.x
Alves, J. A., Gunnarsson, T. G., Hayhow, D. B., Appleton, G. F., Potts, P. M., Sutherland, W. J., et al. (2013). Costs, benefits, and fitness consequences of different migratory strategies. Ecology 94, 11–17. doi: 10.1890/12-0737.1
Alves, J. A., Gunnarsson, T. G., Potts, P. M., Gélinaud, G., Sutherland, W. J., and Gill, J. A. (2012). Overtaking on migration: does longer distance migration always incur a penalty? Oikos 121, 464–470. doi: 10.1111/j.1600-0706.2011.19678.x
Battley, P. F., and Conklin, J. R. (2017). Geolocator wetness data accurately detect periods of migratory flight in two species of shorebird. Wader Study 124, 112–119. doi: 10.18194/ws.00068
Behrenfeld, M. J., and Falkowski, P. G. (1997). Photosynthetic rates derived from satellite-based chlorophyll concentration. Limnol. Oceanogr. 42, 1–20. doi: 10.4319/lo.1997.42.1.0001
Bensch, S. (2009). Is the range size of migratory birds constrained by their migratory program? J. Biogeogr. 26, 1225–1235. doi: 10.1046/j.1365-2699.1999.00360.x
Both, C., Van Turnhout, C. A., Bijlsma, R. G., Siepel, H., Van Strien, A. J., and Foppen, R. P. (2010). Avian population consequences of climate change are most severe for long-distance migrants in seasonal habitats. Proc. Biol. Sci. 277, 1259–1266. doi: 10.1098/rspb.2009.1525
Brown, R. G. B., and Gaskin, D. E. (1988). The pelagic ecology of the Grey and Red-necked Phalaropes Phalaropus fulicarius and P. lobatus in the Bay of Fundy, eastern Canada. Ibis 130, 234–250. doi: 10.1111/j.1474-919X.1988.tb00974.x
Buehler, D. M., and Piersma, T. (2008). Travelling on a budget: predictions and ecological evidence for bottlenecks in the annual cycle of long-distance migrants. Philos. Trans. R. Soc. B Biol. Sci. 363, 247–266. doi: 10.1098/rstb.2007.2138
Camphuysen, C., and van der Meer, J. (2005). Wintering seabirds in West Africa: foraging hotspots off Western Sahara and Mauritania driven by upwelling and fisheries. Afr. J. Mar. Sci. 27, 427–437. doi: 10.2989/18142320509504101
Chavez, F. P., and Messié, M. (2009). A comparison of Eastern boundary upwelling ecosystems. Prog. Oceanogr. 83, 80–96. doi: 10.1016/j.pocean.2009.07.032
Chen, I.-C., Hill, J. K., Ohlemüller, R., Roy, D. B., and Thomas, C. D. (2011). Rapid range shifts of species of climate warming. Science 333, 1024–1026. doi: 10.1126/science.1206432
Colwell, M. A., Reynolds, J. D., Gratto, C. L., Schamel, D., and Tracy, D. M. (1988). Phalarope philopatry. Proc. Int. Ornithol. Congr. 19, 585–593.
Cramp, S., and Simmons, K. E. L. (1983). Handbook of the Birds of Europe, the Middle East and North Africa, The Birds of the Western Palearctic, Volume III: Waders to Gulls, eds S. Cramp and K. E. L. Simmons (Oxford: Oxford University Press).
Delmore, K. E., Fox, J. W., and Irwin, D. E. (2012). Dramatic intraspecific differences in migratory routes, stopover sites and wintering areas, revealed using light-level geolocators. Proc. Biol. Sci. 279, 4582–4589. doi: 10.1098/rspb.2012.1229
Dias, M. P., Granadeiro, J. P., Phillips, R. A., Alonso, H., and Catry, P. (2011). Breaking the routine: individual Cory's shearwaters shift winter destinations between hemispheres and across ocean basins. Proc. Biol. Sci. 278, 1786–1793. doi: 10.1098/rspb.2010.2114
Fiedler, W. (2005). Ecomorphology of the external flight apparatus of Blackcaps with different migration behavior. Ann. N. Y. Acad. Sci. 1046, 253–263. doi: 10.1196/annals.1343.022
Fraser, K. C., Stutchbury, B. J., Silverio, C., Kramer, P. M., Barrow, J., Newstead, D., et al. (2012). Continent-wide tracking to determine migratory connectivity and tropical habitat associations of a declining aerial insectivore. Proc. Royal Soc. B Biol. Sci. 279, 4901–4906. doi: 10.1098/rspb.2012.2207
Fraser, K. C., Stutchbury, B. J. M. M., Kramer, P. M., Silverio, C., Barrow, J., Newstead, D., et al. (2013). Consistent range-wide pattern in fall migration strategy of Purple Martin (Progne subis), despite different migration routes at the Gulf of Mexico. Auk 130, 291–296. doi: 10.1525/auk.2013.12225
Gavrilov, E. I., Jerochov, S. N., Gavrilov, A. E., and Chrokov, V. V. (1983). Über den Herbstzug des Odinswassertreters (Phalaropus lobatus) in Kasachstan. Die Vogelwarte 32, 103–116.
Gill, J. A., Alves, J. A., Sutherland, W. J., Appleton, G. F., Potts, P. M., and Gunnarsson, T. G. (2014). Why is timing of bird migration advancing when individuals are not? Proc. R. Soc. B. Biol. Sci. 281:20132161. doi: 10.1098/rspb.2013.2161
Gudmundsson, G. A., Lindström, Å., and Alerstam, T. (1991). Optimal fat loads and long-distance flights by migrating Knots Calidris canutus, Sanderlings C. alba and Turnstones Arenaria interpres. Ibis 133, 140–152. doi: 10.1111/j.1474-919X.1991.tb04825.x
Guilford, T., Freeman, R., Boyle, D., Dean, B., Kirk, H., Phillips, R., et al. (2011). A dispersive migration in the Atlantic Puffin and its implications for migratory navigation. PLoS ONE 6:e21336. doi: 10.1371/journal.pone.0021336
Haney, J. C. (1985). Wintering phalaropes off the southeastern United States: applications of remote sensing imagery to seabird habitat analysis at oceanic fronts. J. Ornithol. 56, 321–333.
Heckscher, C. M., Halley, M. R., and Stampul, P. M. (2015). Intratropical migration of a Nearctic-Neotropical migratory songbird (Catharus fuscescens) in South America with implications for migration theory. J. Trop. Ecol. 31, 285–289. doi: 10.1017/S0266467415000024
Hedd, A., Montevecchi, W. A., Otley, H., Phillips, R. A., and Fifield, D. A. (2012). Trans-equatorial migration and habitat use by sooty shearwaters Puffinus griseus from the South Atlantic during the nonbreeding season. Mar. Ecol. Prog. Ser. 449, 277–290. doi: 10.3354/meps09538
Hedenström, A., Klaassen, R. H. G., and Åkesson, S. (2013). Migration of the Little Ringed Plover Charadrius dubius breeding in South Sweden tracked by geolocators. Bird Study 60, 466–474. doi: 10.1080/00063657.2013.843635
Hunnewell, R. W., Diamond, A. W., and Brown, S. C. (2016). Estimating the migratory stopover abundance of phalaropes in the outer Bay of Fundy, Canada. Avian Conserv. Ecol. 11:11. doi: 10.5751/ACE-00926-110211
Irwin, D. E., and Irwin, J. H. (2004). “Siberian migratory divides: the role of seasonal migration in speciation,” in Birds of Two Worlds. The Ecology and Evolution of Migration, eds R. Greenberg and P. P. Marra (Baltimore, MD: Smithsonian Institution Press), 27–40.
Jehl, J. R Jr. (1986). Biology of red-necked phalaropes (Phalaropus lobatus) at the western edge of the Great Basin in fall migration. Great Basin Natural. 46, 185–197.
Klaassen, R., Klaassen, H., Berghuis, A., Berghuis, M., Schreven, K., Horst, Y., et al. (2014). Trekroutes en overwinteringsgebieden van Nederlandse Gierzwaluwen ontrafeld met geolocators. Limosa 87, 173–181.
Klaassen, R. H., Alerstam, T., Carlsson, P., Fox, J. W., and Lindström, Å. (2011). Great flights by great snipes: long and fast non-stop migration over benign habitats. Biol. Lett. 7, 833–835. doi: 10.1098/rsbl.2011.0343
Koleček, J., Hahn, S., Emmenegger, T., and Procházka, P. (2018). Intra-tropical movements as a beneficial strategy for Palearctic migratory birds. R. Soc. Open Sci. 5:171675. doi: 10.1098/rsos.171675
Laake, J. L. (2013). RMark: An R Interface for Analysis of Capture-Recapture Data with MARK. AFSC Processed Report 2013–01.
Leisler, B., and Winkler, H. (2003). “Morphological consequences of migration in passerines,” in Avian Migration, eds P. Berthold, E. Gwinner, and E. Sonnenschein (Berlin: Springer-Verlag), 175–186.
Lindström, Å. (2003). “Fuel deposition rates in migrating birds: causes, constraints and consequences,” in Avian Migration, eds P. Berthold, E. Gwinner, and E. Sonnenschein (Berlin: Springer-Verlag GmbH), 307–320.
Lislevand, T., Chutný, B., Byrkjedal, I., Pavel, V., Briedis, M., Adamik, P., et al. (2015). Red-spotted Bluethroats Luscinia s. svecica migrate along the Indo-European flyway: a geolocator study. Bird Study 62, 508–515. doi: 10.1080/00063657.2015.1077781
Lisovski, S., and Hahn, S. (2012). GeoLight—processing and analysing light-based geolocator data in R. Methods Ecol. Evol. 3, 1055–1059. doi: 10.1111/j.2041-210X.2012.00248.x
McFarlane Tranquilla, L. A., Montevecchi, W. A., Fifield, D. A., Hedd, A., Gaston, A. J., Robertson, G. J., et al. (2014). Individual winter movement strategies in two species of murre (Uria spp.) in the Northwest Atlantic. PLoS ONE 9:e90583. doi: 10.1371/journal.pone.0090583
Méndez, V., Alves, J. A., Gill, J. A., and Gunnarsson, T. G. (2018) Patterns processes in shorebird survival rates: a global review. Ibis 160, 723–741. doi: 10.1111/ibi.12586
Mercier, F. M. (1985). Fat reserves and migration of Red-necked Phalaropes (Phalaropus lobatus) in the Quoddy region, New Brunswick, Canada. Can. J. Zool. Can. Zool. 63, 2810–2816. doi: 10.1139/z85-420
Minias, P., Meissner, W., Włodarczyk, R., Ozarowska, A. O., Piasecka, A., Kaczmarek, K., et al. (2015). Wing shape and migration in shorebirds: a comparative study. Ibis 157, 528–535. doi: 10.1111/ibi.12262
Møller, A. P., Garamszegi, L. Z., Peralta-Sánchez, J. M., and Soler, J. J. (2011). Migratory divides and their consequences for dispersal, population size and parasite-host interactions: evolutionary consequences of migratory divides. J. Evol. Biol. 24, 1744–1755. doi: 10.1111/j.1420-9101.2011.02302.x
Møller, A. P., Rubolini, D., and Lehikoinen, E. (2008). Populations of migratory bird species that did not show a phenological response to climate change are declining. Proc. Natl. Acad. Sci. U.S.A. 105, 16195–16200. doi: 10.1073/pnas.0803825105
Mu, T., Tomkovich, P. S., Loktionov, E. Y., Syroechkovskiy, E. E., and Wilcove, D. S. (2018). Migratory routes of red-necked phalaropes Phalaropus lobatus breeding in southern Chukotka revealed by geolocators. J. Avian Biol. 49, 1–6. doi: 10.1111/jav.01853
Nilsson, C., Klaassen, R. H., and Alerstam, T. (2013). Differences in speed and duration of bird migration between spring and autumn. Am. Nat. 181, 837–845. doi: 10.1086/670335
Nisbet, I. C. T., and Veit, R. R. (2015). An explanation for the population crash of red-necked phalaropes Phalaropus lobatus in the Bay of Fundy in the 1980s. Mar. Ornithol. 43, 119–121.
Norevik, G., Boano, G., Hedenström, A., Lardelli, R., Liechti, F., and Åkesson, S. (2019). Highly mobile insectivorous swifts perform multiple intra-tropical migrations to exploit an asynchronous African phenology. Oikos 128:e05531. doi: 10.1111/oik.05531
O'Malley, R. (2015). Ocean Productivity. Available online at: http://www.science.oregonstate.edu/ocean.productivity/ (accessed April 27, 2018).
Orben, R. A., Paredes, R., Roby, D. D., Irons, D. B., and Shaffer, S. A. (2015). Wintering North Pacific black-legged kittiwakes balance spatial flexibility and consistency. Movement Ecol. 3:36. doi: 10.1186/s40462-015-0059-0
Oring, L. W., and Lank, D. B. (1982). Sexual selection, arrival times, philopatry and site fidelity in the polyandrous spotted sandpiper. Behav. Ecol. Sociobiol. 10, 185–191. doi: 10.1007/BF00299684
Parmesan, C., and Yohe, G. (2003). A globally coherent fingerprint of climate change impacts across natural systems. Nature 421, 37–42. doi: 10.1038/nature01286
Phillips, R. A., Silk, J. R. D., Croxall, J. P., Afanasyev, V., and Bennett, J. (2005). Summer distribution and migration of nonbreeding albatrosses: individual consistencies and implications for conservation. Ecology 86, 2386–2396. doi: 10.1890/04-1885
Phillips, R. A., Silk, J. R. D., Croxall, J. P., Afanasyev, V., and Briggs, D. R. (2004). Accuracy of geolocation estimates for flying seabirds. Mar. Ecol. Prog. Ser. 266, 265–272. doi: 10.3354/meps266265
Piersma, T. (1987). Hink, stap of sprong? Reisbeperkingen van arctische steltlopers door voedselzoeken, vetopbouw en vliegsnelheid. Limosa 60, 185–194.
Piersma, T., and Drent, J. (2003). Phenotypic flexibility and the evolution of organismal design. Trends Ecol. Evol. 18, 228–233. doi: 10.1016/S0169-5347(03)00036-3
Pinheiro, J., Bates, D., DebRoy, S., and Sarkar, D. (2018). nlme: Linear and Nonlinear Mixed Effects Models. R Package Version 3. 1–137. Available online at: https://CRAN.R-project.org/package=nlme
Pulido, F. (2007). The genetics and evolution of avian migration. BioScience 57, 165–174. doi: 10.1641/B570211
R Core Team. (2017). R: A Language and Environment for Statistical Computing. Vienna: Foundation for Statistical Computing. Available online at: http://www.R-project.org/
Rappole, J. H., and Tipton, A. R. (1991). New harness design for attachment of radio transmitters to small passerines. J. Ornithol. 62, 335–337.
Reynolds, J. D. (1987). Mating system and nesting biology of the Red-necked Phalarope Phalaropus lobatus: what constrains polyandry? Ibis 129, 225–242. doi: 10.1111/j.1474-919X.1987.tb03203.x
Reynolds, J. D., Colwell, M., and Cooke, F. (1986). Sexual selection and spring arrival times of red-necked and Wilson's phalaropes. Behav. Ecol. Sociobiol. 18, 303–310.
Rubega, M. A., Schamel, D., and Tracy, D. M. (2000). “Red-necked phalarope (Phalaropus lobatus), version 2.0,” in The Birds of North America eds A. F. Poole and F. B. Gill (Ithaca, NY: Cornell Lab of Ornithology). doi: 10.2173/bna.538
Sandercock, B. K. (1997). The breeding biology of red-necked phalaropes Phalaropus lobatus at Nome, Alaska. Wader Study Group Bull. 83, 50–54.
Schamel, D., and Tracy, D. M. (1988). Are yearlings distinguishable from older Red-necked Phalaropes? J. Ornithol. 59, 235–238.
Schamel, D., and Tracy, D. M. (1991). Breeding site fidelity and natal philopatry in the sex role-reversed red and red-necked phalaropes. J. Ornithol. 62, 390–398.
Senner, N. R., Conklin, J. R., and Piersma, T. (2015). An ontogenetic perspective on individual differences. Proc. R. Soc. Lond. B. Biol. Sci. 282:20151050. doi: 10.1098/rspb.2015.1050
Sikora, A., and Zielinksi, P. (2000). Autumn migration of the red-necked phalarope in the Visula river mouth during 1983–2000. Notatki Ornitol. 41, 273–282.
Smith, M., Bolton, M., Okill, D. J., Summers, R. W., Ellis, P., Liechti, F., et al. (2014). Geolocator tagging reveals Pacific migration of red-necked phalarope Phalaropus lobatus breeding in Scotland. Ibis 156, 870–873. doi: 10.1111/ibi.12196
Smith, M., Bolton, M., Okill, J. D., Harris, P., Petrie, G., Riddington, R., et al. (2018). Further evidence of transatlantic migration routes and Pacific wintering grounds of Red-necked Phalaropes breeding in Shetland. Br. Birds 111, 428–437.
Stutchbury, B. J., Siddiqui, R., Applegate, K., Hvenegaard, G. T., Mammenga, P., Mickle, N., et al. (2016). Ecological causes and consequences of intratropical migration in temperate-breeding migratory birds. Am. Nat. 188, S28–S40. doi: 10.1086/687531
Sutherland, W. J., Alves, J. A., Amano, T., Chang, C. H., Davidson, N. C., Max Finlayson, C., et al. (2012). A horizon scanning assessment of current and potential future threats to migratory shorebirds. Ibis 154, 663–679. doi: 10.1111/j.1474-919X.2012.01261.x
Thorup, K., Tøttrup, A. P., Willemoes, M., Klaassen, R. H., Strandberg, R., Vega, M. L., et al. (2017). Resource tracking within and across continents in long-distance bird migrants. Sci. Adv. 3, 1–11. doi: 10.1126/sciadv.1601360
Trierweiler, C., Klaassen, R. H., Drent, R. H., Exo, K.-M., Komdeur, J., Bairlein, F., et al. (2014). Migratory connectivity and population-specific migration routes in a long-distance migratory bird. Proc. Biol. Sci. 281:20132897. doi: 10.1098/rspb.2013.2897
Trierweiler, C., Mullié, W. C., Drent, R. H., Exo, K. M., Komdeur, J., Bairlein, F., et al. (2013). A Palaearctic migratory raptor species tracks shifting prey availability within its wintering range in the Sahel. J. Anim. Ecol. 82, 107–120. doi: 10.1111/j.1365-2656.2012.02036.x
van Bemmelen, R., Moe, B., Hanssen, S., Schmidt, N., Hansen, J., Lang, J., et al. (2017). Flexibility in otherwise consistent non-breeding movements of a long-distance migratory seabird, the long-tailed skua. Mar. Ecol. Prog. Ser. 578, 197–211. doi: 10.3354/meps12010
van Bemmelen, R. S. A., Hungar, J., Tulp, I., and Klaassen, R. H. G. (2016). First geolocator tracks of Swedish red-necked phalaropes reveal the Scandinavia-Arabian Sea connection. J. Avian Biol. 47, 295–303. doi: 10.1111/jav.00807
Verkuil, Y., Van Der Have, T. M., Van Der Winden, J., Keijl, G. O., Ruiters, P. S., Koolhaas, A., et al. (2006). Fast fuelling but light flight in Broad-billed Sandpipers Limicola falcinellus: stopover ecology at a final take-off site in spring (Sivash, Ukraine). Ibis 148, 211–220. doi: 10.1111/j.1474-919X.2006.00490.x
Weimerskirch, H. (2002). “Seabird demography and its relationship with the marine environment,” in Biology of Marine Birds, eds E. A. Schreiber and J. Burger (Boca Raton, FL: CRC Press), 115–135.
Weiser, E. L., Lanctot, R. B., Brown, S. C., Alves, J. A., Battley, P. F., Bentzen, R., et al. (2016). Effects of geolocators on hatching success, return rates, breeding movements, and change in body mass in 16 species of Arctic-breeding shorebirds. Mov. Ecol. 4:12. doi: 10.1186/s40462-016-0077-6
Keywords: flexibility, itinerancy, migration strategy, Phalaropus lobatus, plasticity, red-necked phalarope
Citation: van Bemmelen RSA, Kolbeinsson Y, Ramos R, Gilg O, Alves JA, Smith M, Schekkerman H, Lehikoinen A, Petersen IK, Þórisson B, Sokolov AA, Välimäki K, van der Meer T, Okill JD, Bolton M, Moe B, Hanssen SA, Bollache L, Petersen A, Thorstensen S, González-Solís J, Klaassen RHG and Tulp I (2019) A Migratory Divide Among Red-Necked Phalaropes in the Western Palearctic Reveals Contrasting Migration and Wintering Movement Strategies. Front. Ecol. Evol. 7:86. doi: 10.3389/fevo.2019.00086
Received: 23 November 2018; Accepted: 06 March 2019;
Published: 04 April 2019.
Edited by:
Brett K. Sandercock, Norwegian Institute for Nature Research (NINA), NorwayReviewed by:
Stephen Brown, Manomet Center for Conservation Sciences, United StatesMonique De Jager, Netherlands Institute of Ecology (NIOO-KNAW), Netherlands
Copyright © 2019 van Bemmelen, Kolbeinsson, Ramos, Gilg, Alves, Smith, Schekkerman, Lehikoinen, Petersen, Þórisson, Sokolov, Välimäki, van der Meer, Okill, Bolton, Moe, Hanssen, Bollache, Petersen, Thorstensen, González-Solís, Klaassen and Tulp. This is an open-access article distributed under the terms of the Creative Commons Attribution License (CC BY). The use, distribution or reproduction in other forums is permitted, provided the original author(s) and the copyright owner(s) are credited and that the original publication in this journal is cited, in accordance with accepted academic practice. No use, distribution or reproduction is permitted which does not comply with these terms.
*Correspondence: Rob S. A. van Bemmelen, rvanbemmelen@gmail.com