Article

Does Agricultural Commercialization Affect Food Security: The Case of Crop-Producing Households in the Regions of Post-Reform Vietnam?

Wageningen Economic Research, Prinses Beatrixlaan 582-528, 2595 BM The Hague, The Netherlands
*
Author to whom correspondence should be addressed.
Sustainability 2019, 11(5), 1263; https://doi.org/10.3390/su11051263
Submission received: 31 December 2018 / Revised: 18 February 2019 / Accepted: 20 February 2019 / Published: 27 February 2019

Abstract

:
Agricultural commercialization remains a widely pursued approach in development projects to improve food security in low-income countries, although there is no clear scientific evidence for it. This study examines the impact of agricultural commercialization on the food security status of crop-producing households in the regions of Vietnam in the 1990s. We used the food system framework including output and input markets. We explore three indicators of commercialization: Cash crop production share (CCPS), crop output market participation share (COMPS), and crop input market participation share (CIMPS) based on fertilizer use. For food security, we looked at caloric intake and dietary diversity (Food Variety Score). We use a balanced panel data sample from the Vietnam Living Standards Survey (VLSS) of 1992/93 and 1997/98. We apply four specifications for all combinations of commercialization indicators and food security indicators for seven regions: OLS 1992/93, OLS 1997/98, pooled sample, and difference estimator. The results show that the effect of commercialization on food security is widely heterogeneous. It depends upon the commercialization indicator and the region in Vietnam. In general, there is no clear evidence for the direction of commercialization on either caloric intake or dietary diversity; however, it is clear that the impacts are generally more positive for southern regions than for northern regions of Vietnam.

1. Introduction

Commercialization has been presented as a way out of poverty and as a way to improve food security for poor farming households in low-income countries since the 1980s [
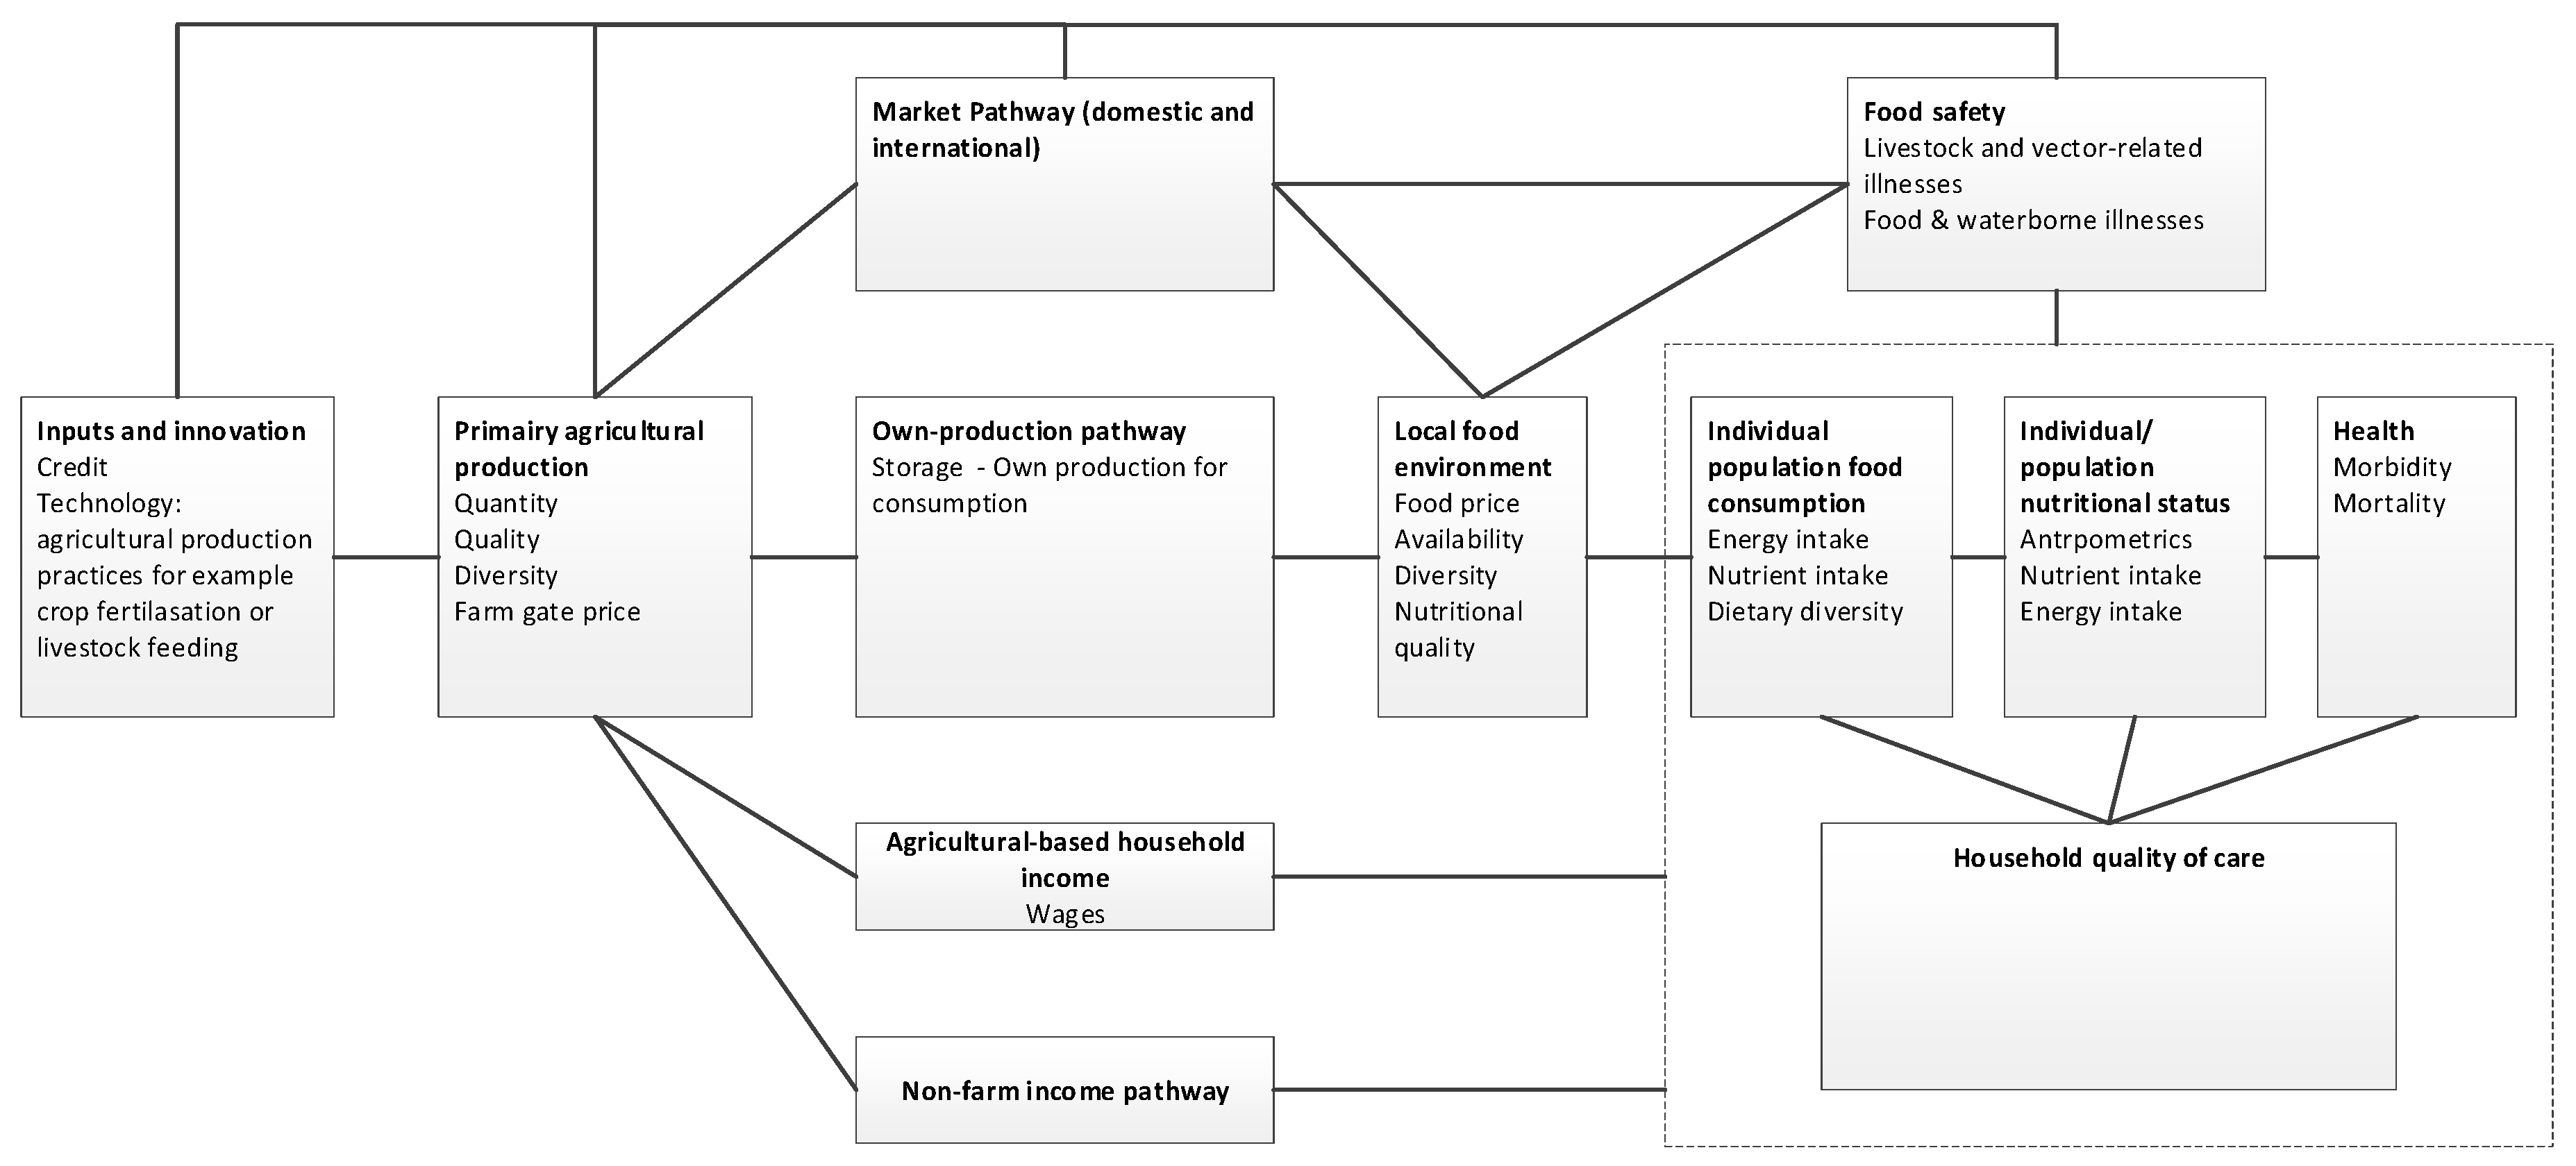
1]. So far, the promotion of commercialization has been targeted at the agricultural outputs of poor farming households. There are two reasons to re-examine this relationship. Firstly, commercialization should be regarded from a food-system perspective, which means that different elements of the food system, as defined in earlier studies [2], can contribute to commercialization. From the farmer perspective, commercialization is not limited to increased market outputs or the production of cash crops. It can also refer to the purchasing of fertilizer or the hiring of labor, for instance. Secondly, not all low- and middle-income countries have available detailed surveys with which the impact of commercialization on farming households can be analyzed. For instance, Myanmar is a centrally planned economy that is opening up to a more market-oriented economy. However, Myanmar lacks reliable surveys for analyzing the impacts of commercialization on poverty and food security. Therefore, we sought a country with similar characteristics, which has experienced political and economic transition, and which has available household surveys to analyze the impact of commercialization on food security. Therefore, we chose to look at the impact of commercialization on food security in Vietnam in the 1990s, as it reflects a similar degree of political and economic change to that which Myanmar is experiencing now. Therefore, this study will focus on the impact of commercialization from a food-system perspective on food security of farming households in Vietnam in the 1990s.
In the 1990s, Vietnam experienced high levels of economic growth [3] caused by a set of economic reforms, the so-called doi moi [4]. These reforms started around 1986 and focused on transforming the centrally planned economy gradually towards a more market-oriented system [5]. At the same time, Vietnam achieved a significant reduction in poverty [3]. The share of the population living in poverty dropped from 58% in 1993 to 37% in 1998 [6], while the share of undernourishment declined from 45.6% to 35.4% between 1991 and 1995 [6]. The privatization of the agricultural sector was one of the key elements of the doi moi. Farm households were, from that moment onwards, allowed to make their own decisions on the allocation of land, the type of crops produced, and whether or not they sell their produce at markets. Additionally, the market prices of crops and inputs were liberalized [5], and collective farms were privatized—similar to that observed in China a couple of years earlier [4]. In 1996, ten years after the doi moi started, the agricultural sector was still employing 70% of the population [6].
There are studies that analyzed the impact of economic reforms and trade liberalization on agriculture and the income distribution in rural Vietnam [7,8]. However, it is still unclear how economic prosperity, caused by these political and economic changes, has affected food security in this period of poverty in Vietnam. In the literature on commercialization and food security, there has been limited empirical research on the topic despite much discussion on the topic in the literature in the 1980s and 1990s [9]. Most empirical studies found a positive effect of commercialization on income, but only a marginal effect on nutrition or food security [9]. Most studies were applied in the African context, with hardly any examples for the South East Asia region published.
This study will analyze the impact of commercialization on food security from a food system’s perspective. In particular, we will analyze the relationship between indicators of commercialization and food security using three commercialization indicators, namely, the share of cash crops in production, the share of market participation, and share of inputs used from the market. For food security, we distinguish two indicators, namely caloric intake and the Food Variety Score (FVS). As we explore the relationship between the commercialization of agriculture and food security, we will solely consider farm households involved in crop production in our analysis. Moreover, we only include farm households for which we have two observations in time so that we can explore the change over time at the farm household level. As the food systems differ across the seven administrative regions [10], we explore the relationships for each of the seven regions separately.
The set of explanatory variables include commercialization, socio-economic, and farm characteristics. Using panel data from the Vietnam Living Standards Survey (VLSS) for 1992–1993 and 1997-1998, we explore different model specifications for explaining food security such as an Ordinary Least Squared (OLS) model for the individual cross-sectional data sets of 1992/93 and 1997/98, an OLS for the pooled sample of two data sets, and a fixed effects (FE) difference estimator.
The structure of the paper is as follows. Section 2 discusses the literature on commercialization and the impact on income and food security of smallholder farmers. Section 2 presents the methodology, and Section 3 discusses the data of the VLSS in more detail. Section 4 examines the results and, finally, Section 5 presents the conclusions of the study and provides further discussion.

2. Literature and Methodology

2.1. Literature Review

Agriculture in low-income countries is known to be a crucial provider of income, livelihoods, and environmental services [11]. Moreover, agriculture and its commercialization are seen as particularly promising ways out of poverty for poor farming households in low-income countries [1]. In theory, specialization and commercialization of agriculture are much more efficient than subsistence farming. Specialization and commercialization of agriculture can improve the productivity and competitiveness of smallholder farmers. Gains in income could occur through comparative advantages, economies of scale, and increased productivity caused by social learning effects [12]. In addition, the improved agricultural productivity reduces the amount of labor required on farms, which implies mobility of labor from agriculture towards other sectors of the economy [12]. However, the commercialization of agriculture can also lead to a decline in crop production diversity at the farm household level [13]. This would mean that households can become less self-sufficient and more dependent on local food markets. In regions where markets are not well-integrated, volatile market prices of crops and inputs, inefficient marketing institutions, and poor infrastructure pose risks to household income [14,15]. Moreover, due to the lack of access to credit, households are unable to mitigate these risks [14]. In such regions, subsistence farming serves as a kind of insurance against the risks and costs of the market [1].
In order to achieve improved agricultural productivity, attention should be given to increasing access to assets and diversifying income sources other than from agriculture [11]. Since we are focusing on the impact of commercialization on food security of farming households, other impacts of commercialization are beyond the scope of this study.
Farming households have different ways in which they can improve their food security status. We adopt the framework which distinguishes three different pathways [16], see Figure 1. The market pathway represents the most direct impact of commercialization of agriculture from an output perspective, i.e., higher quantities of agricultural commodities sold at the market. However, commercialization of agriculture might also affect the own-production pathway, as it implies changes in input use which affect agricultural productivity, and potentially results in higher own production.
In the literature, we observed two streams of thoughts, which are interesting to take into account. The first explored the impact of commercialization on farmers’ income and poverty. These studies hypothesized that commercialization has a positive impact on a farmer’s income. In addition, some of these studies assumed that improved income will also affect food security in a positive way. The results on farmers’ income from these studies ranged from negative to positive depending on the local conditions, while the effects of increased income on food security were either positive or neutral, depending on household decisions. The decisions tended to vary based on culture and social groups [17]. Increased income could increase the demand for more diversified and nutritious diets, namely an increase in expenditures on animal products, fruits, and vegetables to replace cereals and pulses [18]. Although increased diversification tends to yield higher levels of micronutrient content in diets, this might not be the case for caloric intake [19]. When income increases, households do not spend everything on obtaining more calories. Instead, they often buy better-tasting and more expensive calories [20]. Moreover, non-food expenditures are also an important factor at play. Households might prioritize to purchase non-food items over increasing their caloric intake [20].
For example, in a study in the Philippines, cash crops production significantly increased household income, but due to the purchasing of more expensive calories and non-food items, this increase did not translate into a higher preschooler nutritional status [21]. In a study concerning Southwestern Kenya, similar results were found [22]. Cash crop production increased income and showed a small positive effect on household caloric intake. The additional income, however, was mainly spent on non-food items such as housing and school fees.
The second stream of literature focused on the impact of commercialization and food security directly. The impact of commercialization on food security could also function through changes in farmers’ own production [16], rather than only through income.
On the one hand, increases in income provide farmers with the opportunity to make investments that could lead to higher productivity, which would improve food security [23,24]. On the other hand, commercialization can lead to less diversification of crops and more specialization at the smallholder level, but in general, diversification tends to increase at the sector level [25]. In the case of the Malawian domestic food crisis for instance, the effect of commercialization on food security was negative [26]. During the period of food price shocks, cash crop production was associated with negative health effects on children in the utero state [26].
A more recent study based on data from three African countries confirmed the earlier findings that there is little evidence for a relationship between commercialization and food security [9]. In contrast to many earlier studies, the study did not investigate cash crop production as an indicator of commercialization but used the share of output sold at the market of total production [9]. However, the commercialization of input factors, i.e., participation at input markets of fertilizer and pesticides, for instance, as included in this study, was not considered.
The relationship between agricultural commercialization and food security can also be considered at a more macro-economic level. Agricultural commercialization causes households in different areas with different resources to specialize in different crops as the agricultural transformation takes place. This leads to greater diversification on the level of the agricultural sector as a whole. Finally, the highest level of aggregation, the economy as a whole, eventually shows the highest level of diversification. Originally, this diversity is expected to be low, but the increased importance and accessibility of international trade will fuel the inherent desire of people for more diverse diets [25].

2.2. Commercialization

One of the main focuses of this research is comparing different ways of operationalizing commercialization. Most research on commercialization has been explored from the perspective of agricultural development [9]. These studies use a very simple definition of commercialization with an indicator that only focuses on whether a farmer grows cash crops or not. When farmers are growing cash crops, it means that they are market-oriented for selling their production. Cash-crop production is frequently accompanied by the modernization and intensification of cultivation through improved inputs or investments [27].
In this paper, we will look at the impact of commercialization at the farm level from a more holistic perspective, namely the food system perspective. This means that we do not only link commercialization to what farmers produce but also link it to what farmers require for their productions, such as the different factor inputs (e.g., land, labor, and capital, but also inputs like seed, fertilizer, etc.). Even when cash-crop growing is considered to be the definition of commercialization, commercialization of agriculture involves multiple aspects including the input and the output side of production [1,12].
In total, we will consider two separate measures of commercialization, each of which represents a crucial element of agricultural commercialization, namely output and input markets. We will consider the effect of each of these measures on food security separately. The most commonly used measure of commercialization is that of output markets. The cash crop indicator that was mentioned above is also an example of this, as this indicator would consider whether or not households are participating in cash crop production—which in the case of cash crops is equal to output markets, as they are not destined for own consumption at all.

2.2.1. Cash crop production share (CCPS)

In practice, smallholder farmers that are involved in cash-crop growing are likely to be involved in trading non-cash crops as well. Therefore, we will not use the dichotomous indicator for involvement in cash-crop production but we will use the cash-crop share in the total production value. The advantage of this share is that it is more comparable with other indicators that we will explore in this study.
Suppose that a farmer can grow K different types of crops. We define a subset K c of cash crops. Then the CCPS indicator is defined as:
C C P S i = c = 1 K c P c ¯ Q i c k = 1 K P k ¯ Q i k
where Q i c is the quantity of cash crop c produced by farm household i evaluated at an average community level price P c ¯ , and Q i k is the total quantity of crop k produced by farm household i, evaluated at an average community level price P k ¯ . K c is the set of crops identified as cash crops and c is the index of cash crops with c K c . The set of cash crops K c is a subset of the set of all crops K .
So, if a farm household i only sells cash crops, C C P S i = 1 . If a farm household does not sell any cash crops, C C P S i = 0 . Note that this farmer could sell non-cash crops at the market, which will not be reflected by the CCPS indicator.

2.2.2. Crop output market participation share (COMPS)

In order to take into account all market sales of crops by a farmer household, we use the COMPS indicator, which is calculated as the proportion of the value of crops sold at the market and the total value of crop production [28].
C O M P S i = k = 1 K P k ¯ S i k k = 1 K P k ¯ Q i k  
where S i k is the quantity of crops k sold at the market by farm household i evaluated at an average community level price P k ¯ . Note that S i k Q i k . Therefore, when a farm household i sells the whole crop production at the market, S i k = Q i k and C O M P S i = 1 . When a farm household does not sell any crop production at the market, S i k = 0 and C O M P S i = 0 .

2.2.3. Crop input market participation share (CIMPS)

Both the CCPS and COMPS indicators above are based on the market sales of a household farm, which only partly comply with the food-system perspective. In order to obtain a more comprehensive picture, we propose the crop input market participation share (CIMPS) indicator. It is defined as the share of purchased inputs value to the total value of inputs used for production.
C I M P S i = r = 1 R W r ¯ X i r r = 1 R W r ¯ I i r
where X i r is the amount of input r purchased (or hired in the case of labor) by the farm household i at the average input price W r ¯ , I i r is the total amount of input r used in the production of the household, R is the set of different inputs, and r is the index of inputs with r R . So, when the farm households only uses inputs from the market, X i k = I i k , and C I M P S i = 1 . Conversely, when the farm household does not purchase any inputs from the market, X i k = 0 and C I M P S i = 1 . In the case of the CIMPS indicator, we use the (calculated) value of inputs so that we can sum different inputs, which is infeasible when using physical amounts. Moreover, the use of physical amounts could be problematic in the case of fertilizer use because different crops require different amounts of fertilizer [12].

2.3. Food Security

A common indicator of food security in the literature is the energy intake of food consumption [21,28,29]. We specify this measure in our study as the caloric energy intake per day per adult male equivalent.
However, even when households have sufficient levels of caloric intake, they might still lack diversity in the intake of their nutrients [29]. To explore dietary diversity, we apply the Food Variety Score (FVS), which reflects the diversity of diets of households, as the VLSS lacks data on micronutrient consumption. The FVS is a count of the number of food items consumed, which is calculated for all households separately. In the FVS, all food items are equally weighted.
With the two food security indicators together, a more comprehensive outlook on food security can be encapsulated. For instance, farm households might have sufficient caloric intake, but their diet still might lack diversity in nutrients, as indicated by FVS [29]. Conversely, farm households might have insufficient caloric energy intake but a high variety of their diet. The two indicators need to be examined together to reach an accurate and balanced conclusion.

2.4. Regression Specifications

To avoid multi-collinearity, three separate regression models are specified, each with a different indicator for commercialization. The specifications are:
Y i t = β 0 + β 1 C i t + β 2 Z i t + ε i t
where Y i t is the food security status of household i at time t, C i t is the farm household’s commercialization indicator, Z i t is a set of explanatory variables, and ε i t is the error term.
The explanatory variables include socio-economic and farm characteristics of the farm household. Socio-economic characteristics comprise of age, gender, and education level of the household head, as well as the household size and the dependency ratio. The dependency ratio is the ratio of the number of children and elderly in a household over the number of household members in the labor force. Farm characteristics include land holdings, the value of farm equipment, and the livestock holdings. Moreover, region-specific dummies to correct for unobserved heterogeneity across regions or use panel data to correct for unobserved heterogeneity across individuals are also used.
When regressing the effect of commercialization on food security at the household level, there may be differences in access to credit or access to markets that influence the household’s transaction costs, and these are captured by household- and region-specific factors [30]. Thus, the circumstances of a farm household partly pre-determine the effect of commercialization. Farmers in remote areas with large distances to markets are less likely to participate in market activities (selling crop yields or buying crop inputs).
In similar studies, the food security model specified in Equation (4) is likely to suffer from misspecification because of a potential causal relationship between food security and commercialization, or unobserved heterogeneity. As Equation (4) reflects the impact of commercialization on food security, the status of food security might also affect the degree of commercialization in the next growing season. As we observe the food security status after a harvesting period, we expect that the commercialization indicators affect the food security status but not the other way around. In other words, it is unlikely that endogeneity of commercialization factors is present.
As indicated in Equation (4), we apply a panel data specification in our analyses. However, the panel data estimation results with the fixed effects (FE) estimator indicated that there is only minor variation in our samples and subsamples over time. As a result, we only looked at the first difference estimator, based on the specification in Equation (5).
Δ Y i t = β 0 + β 1 Δ C i t + β 2 Δ Z i t + ε i t
In Equation (5), there is the same set of explanatory variables as in Equation (1). For all combinations of two food security indicators ( Y i t ) and three commercialization indicators ( C i t ) , we estimated four specifications: OLS 1992/93, 1997/98, pooled OLS, and first difference estimations.

3. Data

This study uses two cross-sections of the Vietnam Living Standards Survey (VLSS), namely for the periods 1992/93 and 1997/98. The VLSS was conducted by Vietnam’s General Statistics Office (GSO) in collaboration with the World Bank [31,32]. Both surveys are representative at the national and regional level. The surveys include 4800 and 6002 households for 1992/93 and 1997/98, respectively (Table 1). A total of approximately 4300 households participated in both surveys [3].
The questionnaires of the surveys included questions on households’ food consumption, agriculture (production and equipment), demographics, and socio-economic aspects. In addition, community questionnaires of the VLSS were administered in 120 rural communities included in the sample. This community questionnaire consists of questions on demographics, economy and infrastructure, education, health and agriculture, and prices.
According to the VLSS in 1992/93, 82.4% of the Vietnamese households were involved in agriculture, and this share declined to 72.6% in 1998, see Table 1. For households involved in crop production, the share declined from 78.3% in 1992/93 to 69.9% in 1997/98. The declining trend in agricultural involvement in Vietnamese households was also observed by the World Bank, which reported a strong decline in the employment in agriculture from 70% of the total employment to 65.3% between 1996 and 1998 [11].
For analyzing the impact of commercialization on food security, we select a sample of households which are involved in crop production and were present in both surveys. In this way, we can see the development of household farms with respect to both commercialization activities and food security. Farm households with missing data or extreme/outlying values on relevant indicators on commercialization and food security were excluded. We trimmed caloric intake per adult male equivalent per day to the range of 500–5000 kilocalories. The final sample contained 2943 farm households.

3.1. Food Security

Both the caloric intake and the FVS were derived from the food consumption section of the VLSS. It registers food consumption for households rather than individuals. Respondents were asked to recall food consumption for two lengths of periods, annually with information on annual food expenditures and physical units and fortnightly with information on whether or not food items were consumed recently. For caloric intake, we used the annual information to calculate the total amount consumed for each food item, as we will explain later on. The FVS is not provided by the VLSS, but we derived it from the survey. First, we counted the food items bought in the previous fortnight. This ignores the food items (crops or animal products) produced or stored by the household. Then, we calculated the number of food items which were produced and stored for consumption. Both lists were then combined into a single list for each household, and the number of food items on the combined list was counted.
The use of derived or constructed food security indicators has some issues. On the one hand, food security indicators might be overestimated. Firstly, recall periods of actual food consumption are preferably one day or one week. Secondly, the consequence of long recall periods is that consumers achieve higher levels of dietary diversity by definition. Thirdly, the diversity of food consumption is likely to be overestimated. On the other hand, the food consumption data has a category “food away from home”, i.e., lunch or dinner eaten outside the home. For this food category, it is unclear what kind of food items or how much food was eaten. This category was significant. By ignoring this category, food security indicators might be underestimated. As a consequence, the values of the FVSs derived from the VLSS may be rather high.
The energy intake of food items was not directly included in the VLSS, and we used the annual food consumption data in combination with energy conversion factors for food items, see Table A1 in Appendix A. This approach implicitly assumes that no food is wasted [33]. The caloric intake will fluctuate with the size and the type of household members. In order to make the caloric intake comparable between different types of household sizes, we calculated the caloric intake per day per Adult Male Equivalent (AME). The AME indicator was derived from the household composition based on the conversion factors for age and gender of the household members, see Table A2 in Appendix A. The mean AME in 1992/93 was 4.05 and in 1997/98, it was 3.95. This is a decline of 0.5%, while the average household size declined by more than 3%, see Table A3 in Appendix A.
The average households’ caloric intake in the sample increased from 2514 kcal per AME per day in 1992/93 to 2531 kcal in 1997/98, which is an increase of 0.7% (Table 2). In 1992/93, Central Highlands showed the highest average energy intake (2854 kcal) and North Central Coast the lowest (2307 kcal). The other regions all have an average caloric intake that is similar to the national average. In 1997/98, the differences in energy intake across regions are negligible—the Red River Delta showed the highest energy intake (2620 kcal) and South Central Coast the lowest (2434 kcal) in 1997/98. The highest increase observed was 6.8% in the North Central Coast region, and the highest decline was—13.2% in the Central Highlands.
Table 3 shows the constructed Food Variety Score for the different regions in Vietnam. The FVS increased from 9.4 in 1992/93 to 10.8 1997/98, which is an increase of 14.6%. The highest FVS found was in the Central Highlands for both cross-sections of the sample, namely 11.6 and 12.1 in 1992/93 and 1997/98, respectively. The north mountains and midlands region showed the lowest FVS in 1992/93 (8.2) and in 1997/98 (9.7). The FVSs of all regions increased except for the Mekong Delta, where the FVS declined from 11.0 in 1992/93 to 10.1 in 1997/98. The highest increase in the period was observed in the Southeast region with an increase of 32.3%.
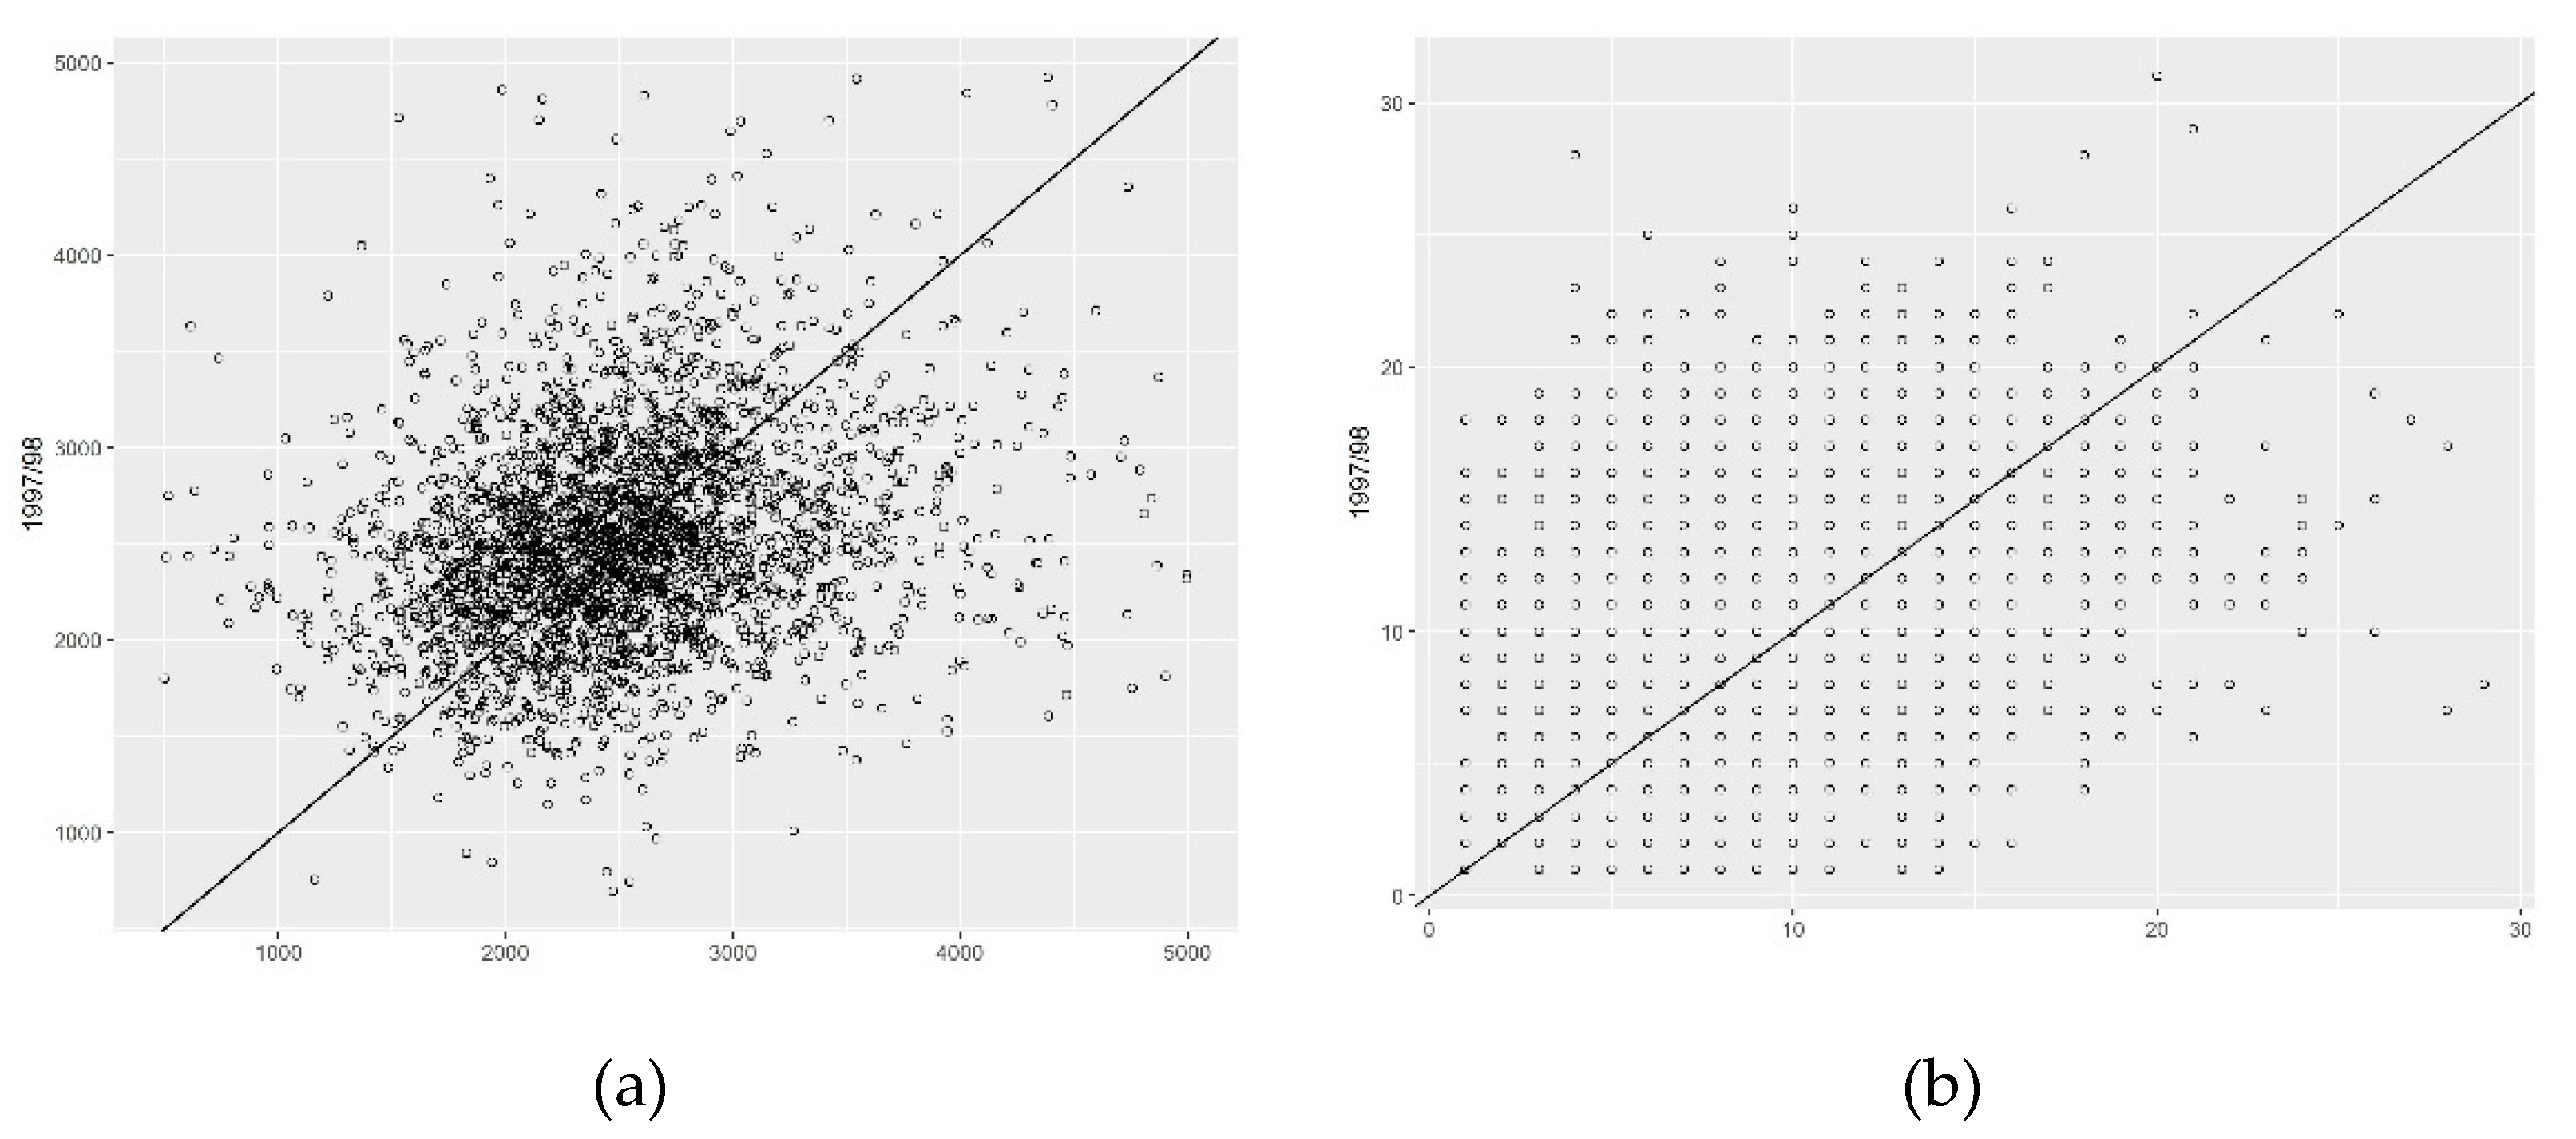
Therefore, four regions (i.e., North mountains and midlands, Red River Delta, North Central Coast, and Southeast) showed higher caloric intake and diversity, while Mekong Delta showed a decline in both indicators. Central Highlands and South Central Coast had lower caloric intakes but larger diversity. It is important to note that we only compared the average of the food security indicators. The individual score of farm households may differ from this average trend in food security, see Figure 2.

3.2. Commercialization

After the political and economic changes that took place in Vietnam, it is reasonable to expect farmers and farm households to have more opportunities to access markets, which, from a food-system perspective, refers to both for selling their outputs, as well as for purchasing their agricultural inputs. Farmers grow cash crops usually for market sales or exports. In Vietnam, the crops produced for export are cashew, coffee, pepper, rubber, and tea [34]. Rice is both produced for export and domestic consumption, but the share of rice that is sold on the domestic markets is much lower than the shares of the cash crops named above [34]. Moreover, rice is not only the main crop produced in Vietnam, but there are also land restrictions that enforce the production of rice in certain areas [35]. For these reasons, rice is not included in the list of cash crops as was done in some earlier studies [34].
Table 4 shows the descriptive statistics of the CCPS indicator, which measures the share of cash-crop value in the total value of production. At the national level, the share of cash crops is 3–4% in both cross-sections. Table 4 shows that there is a large difference in the CCPS indicator values across regions. Central Highlands and the Southeast region are regions known for their cash-crop production.
In Central Highlands and the Southeast region, the CCPS indicator is significant and has increased over time, while in the other regions the CCPS indicator is lower than 2%. In Central Highlands, the CCPS indicator increased from 47% to almost 75% in the period of analysis, which represents almost a 59% increase. The CCPS indicator for the Southeast region increased more marginally, from 19.3% to 19.9% (a 3% increase).
Table 5 shows the descriptive statistics of the COMPS indicator, which reflects the total share of the marketed output in the total production value. The national average was 28.2% in 1992/93 and 40.2% in 1997/98. This represents an increase of 42.4%. All regions showed a substantial increase of the COMPS over time. As shown in Table 5, there are large differences across regions. Central Highlands and the Southeast region have high values of COMPS in 1992/93, as well as in 1997/98. Both regions also have significant shares of cash crops which is also reflected in the COMPS. The increase of the COMPS for both regions between 1992/93 and 1997/98 was between 20% and 25%, and this is lower than the national average (42.4%), see Table 7. The Mekong Delta region showed a high value for the COMPS compared to the northern, non-cash crop regions.
The CIMPS reflects the share of inputs purchased in the total input use for production. Although we could have taken into account multiple types of input such as labor, seeds, etc., we limited this indicator to fertilizer use alone because there were no reliable indicators for other inputs purchased at the market such as pesticides or irrigation water. There are two types of fertilizers in the VLSS, namely chemical fertilizer and organic fertilizer. Chemical fertilizer was always purchased at the market, while organic fertilizer can be produced by the farmer or purchased at the market. This was registered as part of the agricultural production of the VLSS. The CIMPS indicator is defined as the sum of chemical and organic fertilizer purchased over the total value of fertilizer used for production.
Table 6 shows the CIMPS indicator across regions and over time. On average, 47.7% of the total fertilizer used was purchased at the market in 1992/93, this share increased to 51.6% in 1997/98. This is an increase of more than 8% in 5 years. Note that this increase does not indicate whether fertilizer use has increased or not. Furthermore, Table 6 shows large differences in the values of the CIMPS, although the differences are stable over time. In the Mekong Delta, farmers purchased most of the fertilizer used at the markets. Also, in the Central Highlands and the Southeast region, the CIMPS values were equal to or over 80%. In the other four regions, the CIMPS value was in the range of 25-50%. All regions showed an increase of the CIMPS over time. In the north mountains and midlands, the increase of the CIMPS was 28% across the 2 periods examined, see Table 7.
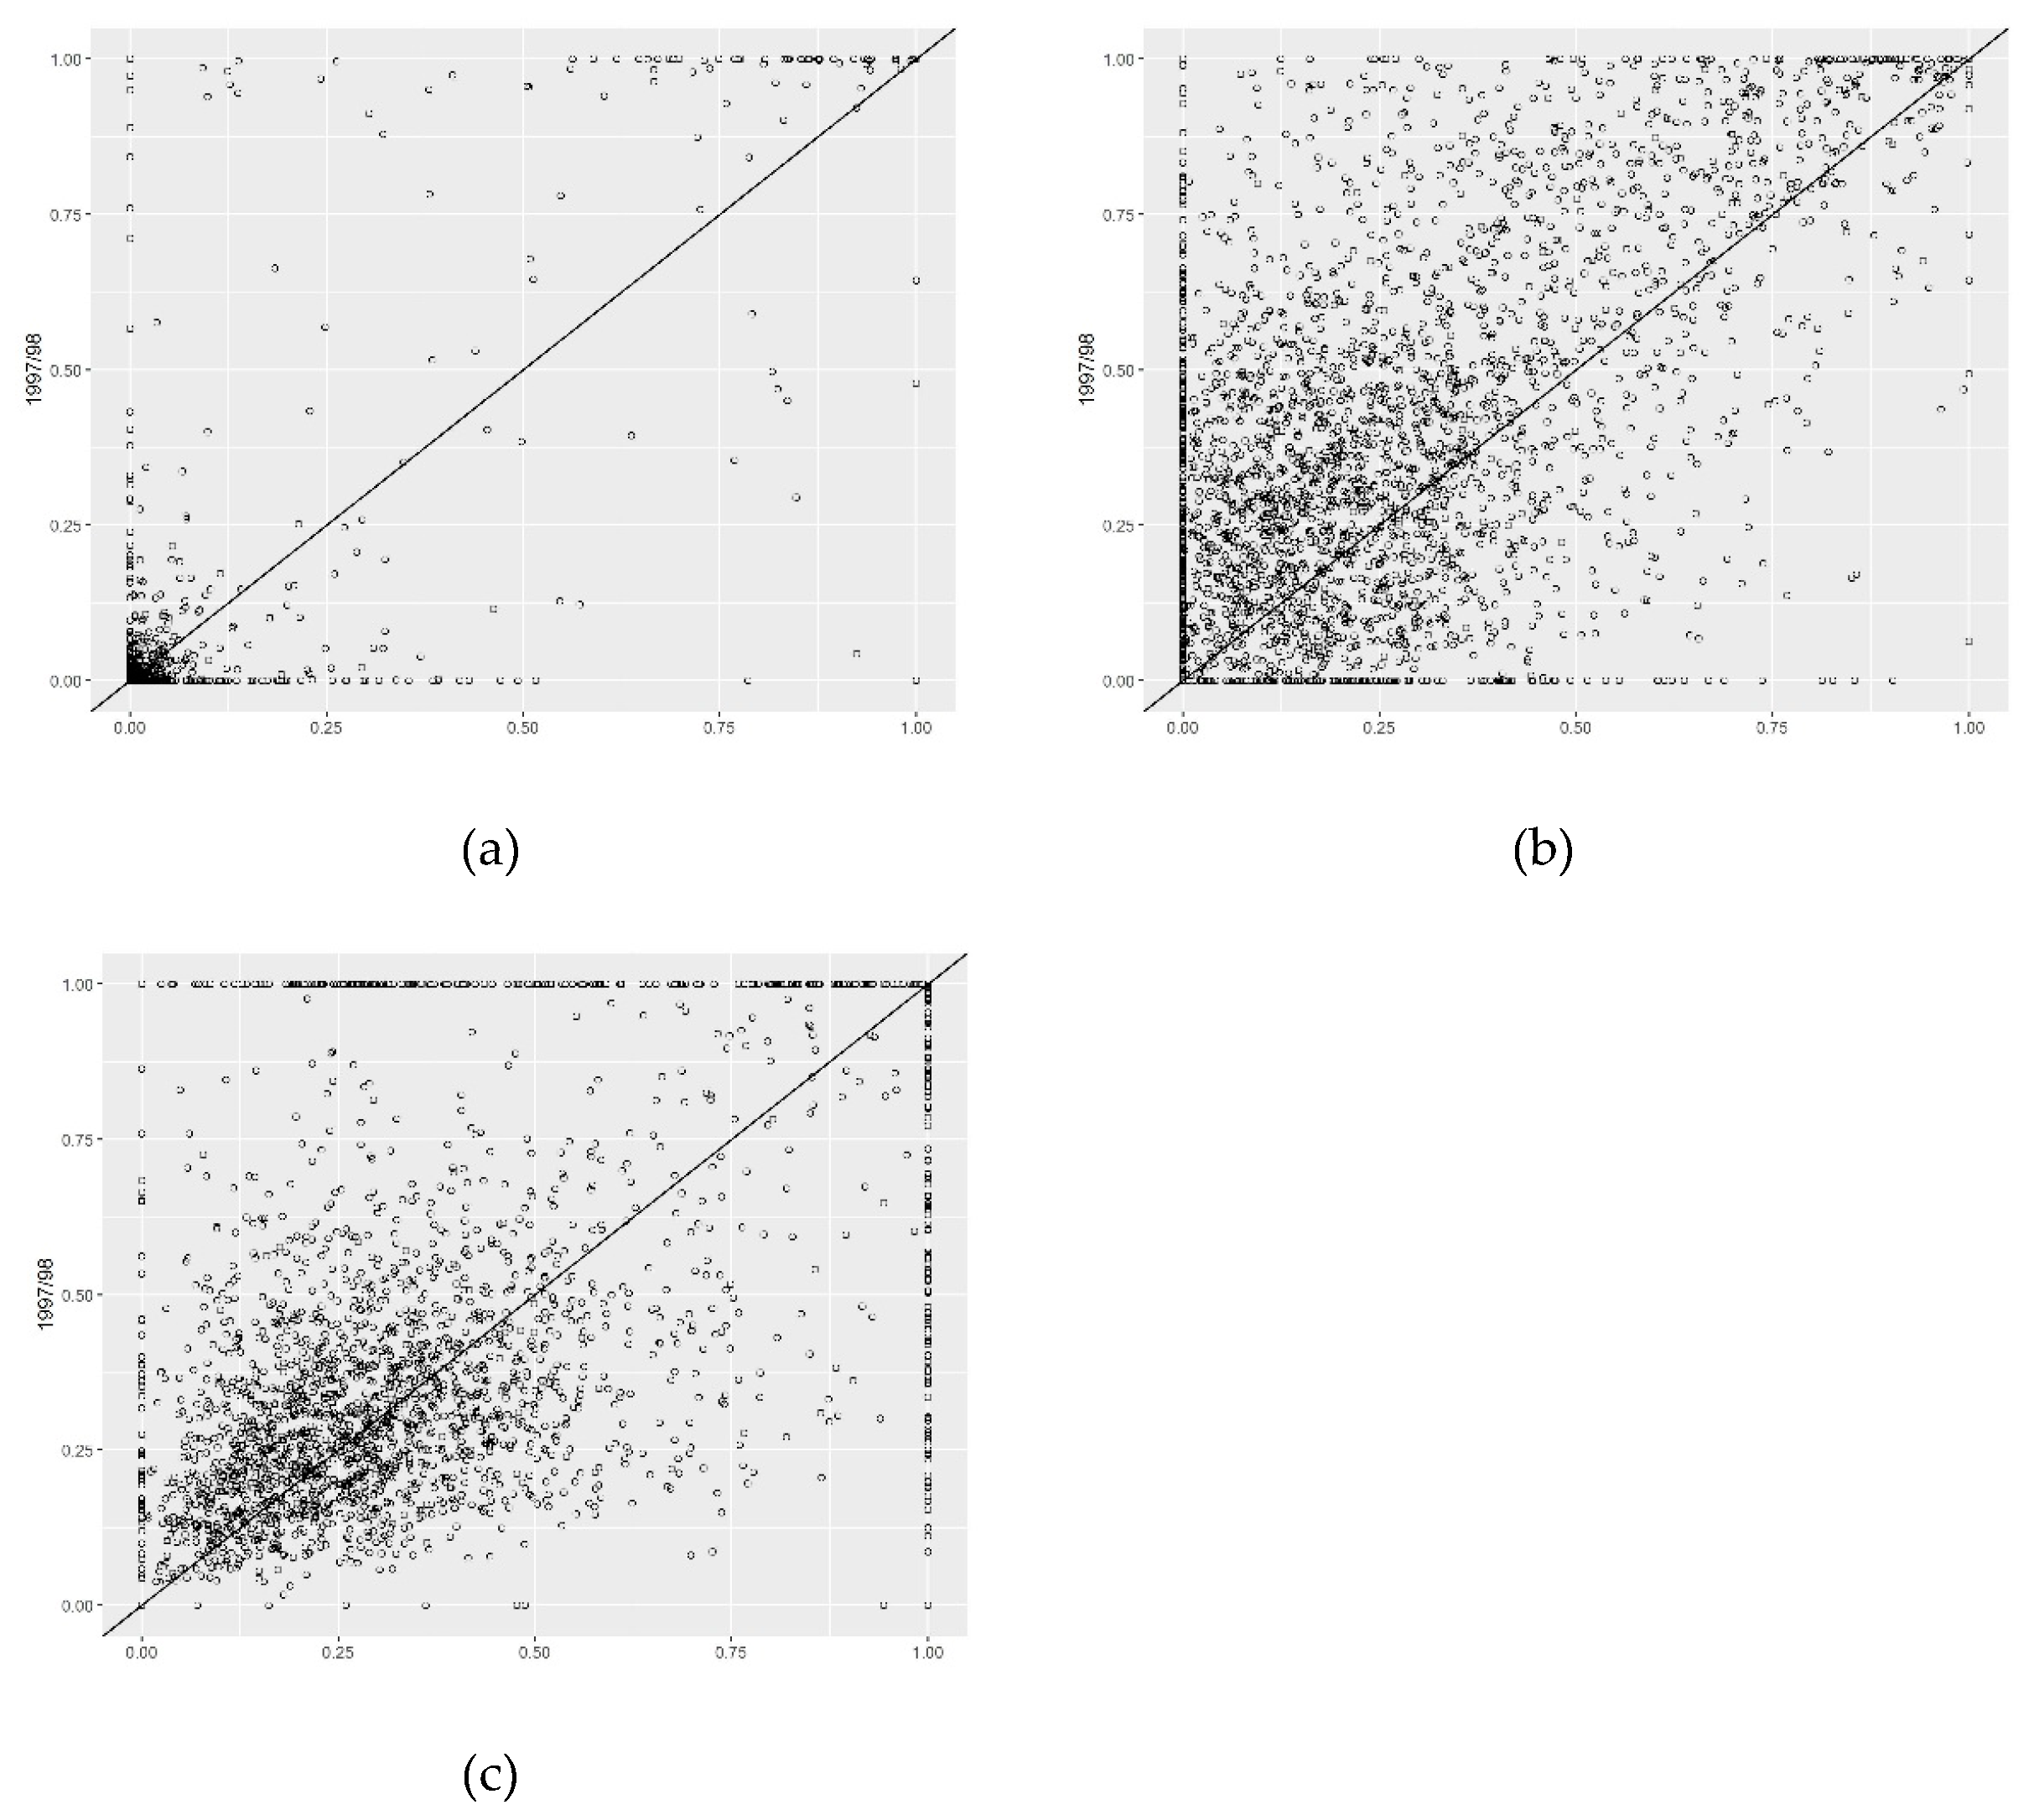
At the individual farm level, the picture is similar, see Figure 3.

4. Results

The results of the descriptive statistics analysis in the previous section indicate the heterogeneity of the regions with respect to food security, commercialization, and the development of both over time. In this section, we will explore whether or not there is a relationship between commercialization and food security. In particular, we are interested in whether or not commercialization after a political and economic change can contribute to an improved food security status of crop-farming households. We applied the regressions on three commercialization indicators (CCPS, COMPS, and CIMPS) to two food security indicators (caloric intake and dietary diversity measured by the FVS). The regressions were run separately for the seven regions of Vietnam.
For all combinations of commercialization indicators, food security indicators, and regions, we applied four specifications. For the first two specifications, we applied a linear model for each year separately, so that we can identify whether or not the coefficients of commercialization differ over time, per region. Then, we used a specification for a pooled regression assuming that coefficients for determinants are the same for both years. Finally, we applied a fixed effects (FE) difference estimator, because the within group variation in our sample was limited and yielded biased results.
Below, we first present the impact of commercialization on caloric intake, followed by the impact of commercialization on the dietary diversity of the households. For convenience, we only present the results of the coefficients of the commercialization indicators in the tables. Detailed estimation results are presented in supplementary tables.

4.1. Caloric Intake

The impact of the CCPS was only tested for the Central Highlands and the Southeast regions because the participation in cash-crop production was negligible in the other regions. For Central Highlands, there is no significant effect for CCPS on the caloric intake in any of the four specifications, see Table 8. In the case of the Southeast region, the impact of CCPS on FVS was positive and significant for all specifications.
In the regressions for the impact of the COMPS on caloric intake, there were hardly any significant coefficients except for a negative coefficient in 1997/98 for the Red River Delta, see Table 8. Market participation has increased for most regions, as shown in Table 8, but it did not affect the development of caloric intake. As the CCPS indicator for the Southeast region was positive, the COMPS indicator for the Southeast region did not show any significant positive impact, although the CCPS measures the value of cash-crop output and COMPS measures the total value of output sold at markets, i.e., CCPS is thus a part of the COMPS. Therefore, the crop-farming households that are involved in cash crops were more market-oriented and show increased caloric intake, while those not involved in cash-crop farming did not show any significant change in caloric intake.
For the regressions on caloric intake, there are only two significant coefficients for the CIMPS, see Table 8. In the North Central Coast region, participation in the input market has had a positive impact on the caloric intake of crop-farming households. In the Red River Delta region, this impact was negative. Both regions showed a similar increase in both the CIMPS and caloric intake, see Table 2, but the impact of the CIMPS on caloric intake was negative. Apparently, the dynamics of the impacts within both regions are different. In the north mountains and midlands regions, the impact varied across the two time periods, positive in 1992/93 and negative in 1997/98. In the other regions, the CIMPS had no significant impact.
The different commercialization indicators appeared to hardly affect the caloric intake indicator. The results in Table 8 show that in most cases, no significant impact of commercialization indicators on caloric intake was found. In the Red River Delta, there were negative impacts from both COMPS and CIMPS. In the North Central Coast, there was a positive impact from the CIMPS, but not from the COMPS, and in the Southeast region, CCPS had a positive impact on caloric intake. In the North mountains and midlands region, the impact of the CIMPS was significant but the direction varied over time. The results indicate that the impact of improved commercialization does not automatically imply increased caloric intake.

4.2. Dietary Diversity (FVS)

The cash-crop indicators showed mixed results across the regions of the Central Highlands and the Southeast (Table 9). In the Central Highlands, the impact of CCPS on dietary diversity was negative but insignificant, while the CCPS had a positive and significant impact on the dietary diversity in the Southeast region. These impacts are similar to the impacts of CCPS on caloric intake, although the impact of CCPS on FVS for the Southeast region was more significant than the impacts on caloric intake.
The COMPS coefficient in the FVS specification for 1992/93 was significantly positive in the Mekong Delta, while the coefficient was positive but insignificant for 1997/98. In the north mountains and midlands, the COMPS coefficient in 1997/98 was significant and positive; although, there was no significant coefficient in the difference estimator specification. In the Red River Delta, the COMPS coefficient for FVS was insignificant in 1992/93 but significant and negative in 1997/98. In the other regions, no significant coefficients were observed. Therefore, in the Southeast region, the CCPS had a significant impact on FVS while the COMPS did not.
The CIMPS coefficient in the FVS regression for the Red River Delta was negative for 1992/93 and insignificant for 1997/98, while the opposite was true for the Mekong Delta. In the Central Highland, the impact was positive for 1992/93 but negative for 1997/98 and insignificant for the difference estimator specification. In the Southeast region, the CIMPS indicator had a negative impact; although, this was only observed in the difference estimator specification. In the North Central Coast region, the CIMPS coefficient in the FVS regression was negative and insignificant in 1992/93, but positive and significant in 1997/98.
There was a greater number of significant coefficients for the COMPS indicator on dietary diversity than there was on caloric intake, while the signs of the coefficients were mixed. For the CCPS indicator, the impacts on dietary diversity were similar to the impacts on caloric intake. This was also true for the CIMPS indicator for the Red River Delta and the North Central Coast region. In the case of dietary diversity, the CIMPS indicator had a greater number of coefficients that were significant (than any other indicators).
To summarize, there is no consistent evidence for an overall impact of commercialization of crop-growing farmers on food security, either in terms of caloric intake or food diversity in the different regions in Vietnam. The impacts differ in sign, magnitude, and significance. However, in general, the impacts appear to be more positive for the southern regions (Central Highlands, the Southeast, and the Mekong Delta) compared to the northern regions.

5. Discussion and Conclusions

Agricultural commercialization is traditionally measured by the involvement of farmers in cash-crop production because cash crops are produced to be sold or exported. However, agricultural commercialization from a food-system perspective needs to also include market participation at other sectors of the food system, such as input markets. Therefore, we explored three commercialization indicators, namely the cash crop production share (CCPS), the crop output market participation share (COMPS), and the input market participation share (CIMPS).
The results showed that the commercialization of crop-farming households has increased over time after the political and economic regime changes in Vietnam. All three commercialization indicators increased unanimously but the magnitude of the increase differed widely. Therefore, it can be concluded that market participation was not limited to the agricultural output market or the involvement in cash-crop production but also higher participation in input markets. We only considered fertilizer inputs, as no reliable data on other inputs was available from the survey. Furthermore, dietary diversity also increased while caloric intake remained rather constant. Although this is the general trend for Vietnam, there are differences across regions, as observed in earlier studies [10]. Hence, we focused our attention on the impact of commercialization on food security at the regional level.
In general, there was limited variation in the caloric intake indicator, and it remains constant between 1992/93 and 1997/98, while the commercialization indicators exhibited a positive trend. The combination of these observed trends made it less likely to find a positive relationship between commercialization indicators and caloric intake. For dietary diversity, however, we observed an increasing trend.
If we had only looked at the cash crop participation share (CCPS), we would not have been able to analyze commercialization in five of the seven regions in Vietnam because cash-crop production hardly existed in these regions. Only the Central Highlands and the Southeast regions had a significant share of the farmers involved in cash-crop farming in the 1990s. The results for the Southeast region indicate that commercialization had a significant positive effect on dietary diversity. For the Central Highlands, caloric intake dropped in the considered period while commercialization remained relatively constant, noting that the share of cash-crop participation was already high in this region.
However, when considering the output side of commercialization, where households have different shares of crop marketing (different values for COMPS), COMPS had a significant positive effect on the FVS and a negative effect on caloric intake. It is important to note that the significant positive effect of COMPS on the FVS only seems to be the case in the south of Vietnam. In the northern regions, there seems to be no significant effect. In earlier studies, there were no significant coefficients found for the impact of the COMPS indicator on food security [9].
The difference in results between the north and the south is as expected. The benefits of the reforms differed across the northern and southern regions. Before the reforms, rice and cash-crop production were mainly concentrated in the south, and the south also suffered most from the export quota that was in place at that time. Therefore, when this export quota was removed, the southern regions benefited more than the northern regions [7]. Moreover, farming households in the south already had crop specialization, rice, and cash crops. Therefore, as a result of the liberalizations, households in the south were able to more easily adjust their production and the amount sold according to changes in market conditions, taking advantage of a price increase in rice for instance [7,8].
When looking at the commercialization of the input side of the food system, CIMPS showed no significant relationships with the food security indicators. This means that there is no clear significant effect of the CIMPS on food security across regions. However, similar to the impact of the COMPS indicator, we observed some differences between the north and south. The north experienced larger increases in their CIMPS compared to the south. From the regression results, the number of significant negative effects of increased CIMPS on both food security indicators in northern regions was larger than in southern regions. During the liberalizations, fertilizer supply constraints were largely removed [8], and the prices of fertilizer dropped [7]. As a result, the amount of fertilizer use increased. Given the fact that the share of fertilizer purchased at the market was high in the southern regions, the total costs of fertilizer increased over time, which has had a negative impact on income. [8]. This might explain the negative impact of commercialization on food security in the southern regions [8].
The results of our analysis show that the relationship between agricultural commercialization and food security is very complex. The impact depends on both the indicators and the region. Moreover, obvious trends in certain regions do not directly translate into obvious increases or decreases in the impact of commercialization on food security. The promotion of agricultural commercialization in one region, or of one specific type of commercialization, may thus lead to negative impacts, while for another region, or another type of commercialization, it may lead to positive impacts.
One of the shortcomings of our approach is that we did not take into account other aspects or developments, such as hired labor for instance. The general trend that can be concluded for developing countries is that people move away from the agricultural sector. The data showed that there was an 8.4% decrease in crop-producing households between 1992/93 and 1997/98 [10]. For agricultural households, however, we found that the total average income increased mainly due to increases in on-farm income (i.e., higher quantities and returns from agricultural production). This indicates that commercialization of the agricultural activities of households might have been more important than, for instance, the commercialization of labor [10].
Our analysis was limited to the impact of economic and political changes within a five-year period. It is likely that full adjustments to these economic changes would occur over a longer period than that which data were available for. Additionally, if the analysis examined the impact over a longer period, the results could be less ambiguous and more robust. However, with longer periods, more dynamics at the farm household level could be introduced, such as changes in households’ composition, changing households’ head, and entering or exiting of agricultural activities, which would have affected the regression results.
To analyze the impact of commercialization on food security, it is important to look at the change in expenditures. Earlier studies indicated that households spend a larger share of their increased incomes on non-food items than on food items [10,20]. Our results showed that the FVS, on average, increased with commercialization while caloric intake did not, and this points to an increase in demand for more diverse diets, which was observed in earlier studies [18].
Our research could be extended in multiple ways. The CIMPS indicator measures another element of the food system that can be commercialized. The main drawback of using the CIMPS indicator is that it is only based on one of the input factors of production, namely fertilizer, although there are many other inputs to consider such as hired labor and pesticide use, amongst others. Pesticides, for instance, can only be purchased at the market. The inclusion of pesticides in the CIMPS indicator would have boiled down to pesticide use or not.
Furthermore, we have explored the impacts of the commercialization indicators on food security in separate specifications in our analyses so that we would avoid any possible multi-collinearity issues. From a food-system perspective, it would be interesting to create indicators that combine market participation in input and output markets for instance.
Finally, the impact of the commercialization of agriculture can also be observed outside agriculture, such as farmers exiting the industry, labor moving to other sectors outside the food system, or the entrance of new actors in agriculture such as foreign companies or investors. Additional analyses are needed to explore the impacts of economic and political changes on these factors.
To conclude, one of the reasons to analyze the impact of commercialization in agriculture on food security in the regions in Vietnam was to explore the possibilities to transfer these relationships to other cases like Myanmar. However, it will be hard to find the right circumstances to transfer the relationships given the large variations in results across regions in our study.

Supplementary Materials

The following are available online at https://www.mdpi.com/2071-1050/11/5/1263/s1. The document with the regression results underlying the results of Table 8 and Table 9 are available.

Author Contributions

V.L, V.J., and T.A. worked on the concepts and methodologies for this paper. V.L. wrote the paper with contributions of V.J., V.J. analyzed the data with contributions from V.L., T.A. reviewed the paper.

Funding

This research received was funded by the Dutch Ministry of Agriculture, Nature and Food Quality, grant number KB-22.

Acknowledgments

The authors thank Maggie Skirtun and anonymous reviewers for their comments that contributed to improve the quality of this paper. Any remaining errors are ours.

Conflicts of Interest

The authors declare no conflicts of interest. The funders had no role in the design of the study; in the collection, analyses, or interpretation of data; in the writing of the manuscript, and in the decision to publish the results.

Appendix A

Table A1. Calorie conversion rate (calories per kg) for food items [32].
Food ItemsCalories per kgFood ItemsCalories per kg
Ordinary rice3530Beans3142
Glutinous rice3550Water morning glory210
Corn/maize3640Kohlrabi300
Cassava1560Cabbage370
Potatoes1088Tomatoes370
Barley, Malt, Millet, Kaoling *3320Other vegetables-
Bread wheat, flour3015Oranges430
(pho) Noodle and instant rice soup3580Bananas830
Rice noodle3400Mangoes290
Vermicelli1285Other fruits *170
Pork3956Fish sauce and dipping sauce332
Beef and buffalo meat1233Salt-
Chicken1759Sugar, molasses *3870
Duck and other poultry meat1260Cakes, jams, sweets4026
Other meat *2630Fresh milk868
Processed meat3259Alcohol & beer470
Fat and oil9270Coffee *560
Fresh fish, shrimp900Tea-
Dried/processed fish and shrimp2409Beverages (industrial methods)470
Other seafood (crab, snails etc.) *660Food and drink away from home *410
Chicken or duck eggs (per one) **1482Others *1700
Tofu980
Peanuts, sesame seeds5445
Source: Nguyen & Winters [32], adjusted from Vietnam’s National Institute of Nutrition (NIN) and General Statistics Office (GSO) of Vietnam. Note: * The conversion rate was not available, so we used the Food and Agriculture Organization (FAO) conversion rates [36]. ** Multiplied with the average weight of a chicken egg in Vietnam [37].
Table A2. FAO adjustment factors for calculating the Adult Male Equivalents (AME) [38].
Age CategoriesMalesFemales
<10.270.27
1–30.450.45
4–60.610.61
7–90.730.73
10–120.860.78
13–150.960.83
16–191.020.77
≥2010.73
Table A3. Adult male equivalents per household and household size in the sample for 1992/93 and 1997/98.
1992/931997/98Change (%)
RegionsAMESizeAMESizeAMESize
North mountains and midlands4.145.344.195.181.14−3.09
Red River Delta3.434.943.354.10−2.27−17.00
North Central Coast3.844.943.814.77−0.88−3.51
South Central Coast4.225.334.025.00−4.77−6.25
Central Highlands4.746.144.766.050.36−1.32
Southeast4.515.614.415.36−2.15−4.43
Mekong Delta4.715.914.365.34−7.38−9.70
Total4.055.163.954.88−2.53−5.43

References

  1. Von Braun, J. Agricultural commercialization: Impacts on income and nutrition and implications for policy. Food Policy 1995, 20, 187–202. [Google Scholar] [CrossRef]
  2. Ingram, J. A food systems approach to researching food security and its interactions with global environmental change. Food Secur. 2011, 3, 417–431. [Google Scholar] [CrossRef]
  3. Glewwe, P.; Dang, H.-A.H. Was Vietnam’s economic growth in the 1990s pro-poor? An analysis of panel data from Vietnam. Econ. Dev. Cult. Chang. 2011, 59, 583–608. [Google Scholar] [CrossRef]
  4. Rozelle, S.; Swinnen, J.F. Success and failure of reform: Insights from the transition of agriculture. J. Econ. Lit. 2004, 42, 404–456. [Google Scholar] [CrossRef]
  5. Nguyen, H.H. Regional Welfare Disparities and Regional Economic Growth in Vietnam; Wageningen Universiteit: Wageningen, The Netherlands, 2009. [Google Scholar]
  6. World Bank. Vietnam: Attacking Poverty; World Bank: Washington, DC, USA, 1999. [Google Scholar]
  7. Benjamin, D.; Brandt, L. Agriculture and income distribution in rural Vietnam under economic reforms: A tale of two regions. In Economic Growth, Poverty and Household Welfare in Vietnam; World Bank: Washington, DC, USA, 2004; pp. 133–185. [Google Scholar]
  8. Coello, B. Agriculture and Trade Liberalization in Vietnam; Paris School of Economics; Paris School of Economics: Paris, France, 2007; p. 25. [Google Scholar]
  9. Carletto, C.; Corral, P.; Guelfi, A. Agricultural commercialization and nutrition revisited: Empirical evidence from three African countries. Food Policy 2016, 67, 106–118. [Google Scholar] [CrossRef] [PubMed]
  10. Janssen, V. The Effect of Agricultural Commercialization on Food Security the Case of Crop Producing Households in Post-Reform Vietnam; Wageningen UR: Wageningen, The Netherlands, 2018; p. 66. [Google Scholar]
  11. World Bank. World Development Report 2008: Agriculture for Development; World Bank: Washington, DC, USA; London, UK, 2007; ISBN 978-0-8213-6809-1. [Google Scholar]
  12. Gebremedhin, B.; Jaleta, M. Commercialization of smallholders: Is market participation enough. In Proceedings of the Contributed Paper Presented at the Joint 3rd African Association of Agricultural Economists (AAAE) and 48th Agricultural Economists Association of South Africa (AEASA) Conference, Cape Town, South Africa, 19–23 September 2010. [Google Scholar]
  13. Fleuret, P.; Fleuret, A. Nutrition, consumption, and agricultural change. Hum. Organ. 1980, 39, 250–260. [Google Scholar] [CrossRef]
  14. Immink, M.D.; Alarcon, J.A. Household income, food availability, and commercial crop production by smallholder farmers in the western highlands of Guatemala. Econ. Dev. Cult. Chang. 1993, 41, 319–342. [Google Scholar]
  15. Jaleta, M.; Gebremedhin, B.; Hoekstra, D. Smallholder Commercialization: Processes, Determinants and Impact; International Livestock Research Institute: Addis Ababa, Ethiopia, 2009. [Google Scholar]
  16. Kanter, R.; Walls, H.L.; Tak, M.; Roberts, F.; Waage, J. A conceptual framework for understanding the impacts of agriculture and food system policies on nutrition and health. Food Secur. 2015, 7, 767–777. [Google Scholar] [CrossRef]
  17. DeWalt, K.M. Nutrition and the Commercialization of Agriculture: Ten Years Later. Soc. Sci. Med. 1993, 36, 1407–1416. [Google Scholar] [CrossRef]
  18. Abdulai, A.; Aubert, D. A cross-section analysis of household demand for food and nutrients in Tanzania. Agric. Econ. 2004, 31, 67–79. [Google Scholar] [CrossRef]
  19. Gibson, R.S.; Hotz, C. Dietary diversification/modification strategies to enhance micronutrient content and bioavailability of diets in developing countries. Br. J. Nutr. 2001, 85, S159. [Google Scholar] [CrossRef] [PubMed]
  20. Banerjee, A.; Duflo, E. Poor Economics: A Radical Rethinking of the Way to Fight Global Poverty; Penguin Books: London, UK, 2012; ISBN 978-0-7181-9366-9. [Google Scholar]
  21. Bouis, H.E.; Haddad, L.J. Effects of Agricultural Commercialization on Land Tenure, Household Resource Allocation, and Nutrition in the Philippines; Research Report; International Food Policy Research Institute; International Food Policy Research Institute in collaboration with the Research Institute for Mindanao Culture: Washington, DC, USA, 1990; ISBN 978-0-89629-081-5. [Google Scholar]
  22. Kennedy, E.; Cogill, B. The commercialization of agriculture and household-level food security: The case of Southwestern Kenya. World Dev. 1988, 16, 1075–1081. [Google Scholar] [CrossRef]
  23. Achterbosch, T.; van Berkum, S.; Meijerink, G.; Asbreuk, H.; Oudendag, D. Cash Crops and Food Security: Contributions to Income, Livelihood Risk and Agricultural Innovation; LEI Wageningen UR: The Hague, The Netherlands, 2014; ISBN 978-90-8615-673-3. [Google Scholar]
  24. Babatunde, R.O.; Qaim, M. Impact of off-farm income on food security and nutrition in Nigeria. Food Policy 2010, 35, 303–311. [Google Scholar] [CrossRef] [Green Version]
  25. Timmer, C.P. Farmers and Markets: The Political Economy of New Paradigms. Am. J. Agric. Econ. 1997, 79, 621. [Google Scholar] [CrossRef]
  26. Wood, B.; Nelson, C.; Kilic, T.; Murray, S. Up in Smoke? Agricultural Commercialization, Rising Food Prices and Stunting in Malawi. World Bank Policy Research Working Paper (No. 6650). Available online: https://www.researchgate.net/profile/Talip_Kilic/publication/254387650_Up_in_Smoke_Agricultural_CommercializationRising_Food_Prices_and_Stunting_in_Malawi/links/00b495384e2d34e7b6000000/Up-in-Smoke-Agricultural-Commercialization-Rising-Food-Prices-and-Stunting-in-Malawi.pdf?origin=publication_detail (accessed on 26 February 2019).
  27. Niemeijer, R.; Hoorweg, J. 17 Commercialization of Rice and Nutrition: A Case from West Kenya. Available online: http://microdata.worldbank.org/index.php/ddibrowser/1910/export/?format=pdf&generate=yes (accessed on 26 February 2019).
  28. Von Braun, J.; de Haen, H.; Blanken, J. Commercialization of Agriculture under Population Pressure: Effects on Production, Consumption, and Nutrition in Rwanda; IFPRI: Washington, DC, USA, 1991; ISBN 978-0-89629-087-7. [Google Scholar]
  29. Carletto, C.; Zezza, A.; Banerjee, R. Towards better measurement of household food security: Harmonizing indicators and the role of household surveys. Glob. Food Secur. 2013, 2, 30–40. [Google Scholar] [CrossRef]
  30. Barrett, C.B. Smallholder market participation: Concepts and evidence from eastern and southern Africa. Food Policy 2008, 33, 299–317. [Google Scholar] [CrossRef]
  31. General Statistical Office (GSO). State Planning Committee (SPC) Vietnam—Living Standards Survey 1992–1993. Available online: http://microdata.worldbank.org/index.php/ddibrowser/1910/export/?format=pdf&generate=yes (accessed on 26 February 2019).
  32. Nguyen, M.C.; Winters, P. The impact of migration on food consumption patterns: The case of Vietnam. Food Policy 2011, 36, 71–87. [Google Scholar] [CrossRef]
  33. Molini, V. Food Security in Vietnam During the 1990s: The Empirical Evidence; UNU WIDER: Helsinki, Finland, 2006; ISBN 978-92-9190-841-7. [Google Scholar]
  34. Coello, B. Exports liberalization and specialization in cash crop: Gains for Vietnamese households? Econ. Int. 2009, 73–99. [Google Scholar]
  35. Markussen, T.; Tarp, F.; Van Den Broeck, K. The Forgotten Property Rights: Evidence on Land Use Rights in Vietnam. World Dev. 2011, 39, 839–850. [Google Scholar] [CrossRef] [Green Version]
  36. Mishra, V.; Ray, R. Dietary Diversity, Food Security and Undernourishment: The Vietnamese Evidence. Asian Econ. J. 2009, 23, 225–247. [Google Scholar] [CrossRef]
  37. Duc, N.V.; Long, T. Poultry Production Systems in Vietnam; FAO: Rome, Italy, 2008; p. 22. [Google Scholar]
  38. Fiedler, J.L.; Smitz, M.-F.; Dupriez, O.; Friedman, J. Household Income and Expenditure Surveys: A Tool for Accelerating the Development of Evidence-Based Fortification Programs. Food Nutr. Bull. 2008, 29, 306–319. [Google Scholar] [CrossRef] [PubMed] [Green Version]
Figure 1. Conceptual framework of the links between agriculture, the food system, nutrition, and public health. Source: Adopted from [16].
Sustainability 11 01263 g001
Figure 2. Change of food security indicators between 1992/93 and 1997/98 at the farm household level: this is (a) caloric intake per adult male equivalent (AME) per day (kcal) and (b) Food Variety Score (FVS).
Sustainability 11 01263 g002
Figure 3. Change of commercialization indicators between 1992/93 and 1997/98 at farm household level: (a) cash crop participation share (CCPS), (b) crop output market participation share (COMPS) and (c) crop input market participation share (CIMPS).
Sustainability 11 01263 g003
Table 1. Households types included in the Vietnam Living Standards Survey (VLSS) 1992/93 and 1997/98.
Household Type1992/931997/98
#Share (%)#Share (%)
Total number of households4800100.06002100.0
No agricultural production84617.6164727.4
Only livestock production1964.11612.7
Involved in crop production375878.3419469.9
Involved in cropping3758100.04194100.0
Involved in cropping in both years323186.0323177.0
Only one of the years52714.096323.0
Sample3231100.03231100.0
Included observations294391.1294391.1
Excluded observations2888.92888.9
Table 2. Mean, standard deviation, and relative change of the caloric intake per adult male equivalents (AME) per day (in kcal) per region and per period.
1992/931997/98Change
RegionMeanSt.devMeanSt.dev%
North mountains and midlands258758025945230.28
Red River Delta254053126205753.11
North Central Coast230752324635136.76
South Central Coast25067452434531−2.90
Central Highlands28547852479446−13.16
Southeast256178325635620.06
Mekong Delta25427232455614−3.42
Total251463425315570.69
Table 3. Mean, standard deviation, and relative change of the Food Variety Score (FVS) per region and per period.
1992/931997/98Change
RegionMeanStandard DeviationMeanStandard Deviation%
North mountains and midlands8.183.739.694.1518.45
Red River Delta8.374.1610.074.9620.25
North Central Coast9.323.7210.844.5716.38
South Central Coast10.314.4313.153.9827.56
Central Highlands11.585.8812.113.514.55
Southeast10.954.2014.494.6332.29
Mekong Delta10.964.7910.054.14−8.35
Total9.394.3510.774.6514.64
Table 4. Mean and standard deviation of the cash crop participation share (CCPS) per region and per survey.
1992/931997/98
RegionMeanStandard DeviationMeanStandard Deviation
North mountains and midlands1.956.500.873.83
Red River Delta0.242.120.242.18
North Central Coast1.336.531.957.92
South Central Coast1.688.361.004.74
Central Highlands47.1636.1474.9038.42
Southeast19.2833.0519.8635.85
Mekong Delta0.211.790.110.99
Total3.2813.923.8216.88
Table 5. Mean and standard deviation of the crop output market participation share (COMPS) per region and per survey.
1992/931997/98
RegionMeanStandard DeviationMeanStandard Deviation
North mountains and midlands21.1618.4130.4723.93
Red River Delta20.0016.2228.7821.10
North Central Coast20.1216.2430.0920.98
South Central Coast21.7121.5335.3423.47
Central Highlands69.5024.1784.8922.61
Southeast51.0933.8663.6031.80
Mekong Delta46.7326.4066.8526.10
Total28.2324.7840.2028.95
Table 6. Mean, standard deviation, and relative change of the crop input market share (CIMPS) per region and per survey.
1992/931997/98
Region MeanStandard DeviationMeanStandard Deviation
North mountains and midlands25.1622.0632.2120.75
Red River Delta35.6818.5538.2122.62
North Central Coast28.1521.1731.0020.11
South Central Coast44.6729.4150.8830.50
Central Highlands79.7729.5487.4323.90
Southeast81.1426.1782.2925.45
Mekong Delta97.2810.2999.552.64
Total47.6834.2051.5833.59
Table 7. Change in cash crop participation share (CCPS), crop output market participation share (COMPS), and crop input market participation share (CIMPS) over time per region.
CCPSCOMPSCIMPS
RegionChange (%)Change (%)Change (%)
North mountains and midlands 44.028.0
Red River Delta 43.97.1
North Central Coast 49.610.1
South Central Coast 62.813.9
Central Highlands58.8022.19.6
Southeast3.0224.51.4
Mekong Delta 43.02.3
Total16.3442.48.2
Table 8. Regression results of cash crop participation share (CCPS), crop output market participation share (COMPS), and crop input market participation share (CIMPS) on caloric intake per adult male equivalent (AME) per day.
Region (Number of observations)OLS 1992/93OLS 1997/98PooledDifference-in-Difference
CCPS
Central Highlands (74)−254.74184.1314.55113.70
Southeast (181)392.13 **231.42 *310.15 ***314.14 **
COMPS
North mountains and midlands (606)58.33−49.67−7.6676.01
Red River Delta (738)−33.55−193.98**−119.02−104.12
North Central Coast (530)−100.9366.0733.90161.78
South Central Coast (303)113.8778.6381.93213.70
Central Highlands (74)−293.37−75.83−43.90−257.52
Southeast (181)−12.87166.3489.71100.30
Mekong Delta (511)147.51−110.1737.73115.12
CIMPS
North mountains and midlands (606)238.67 **−157.26*36.15122.43
Red River Delta (738)−262.11 **−138.68 −174.64 ***−307.49 ***
North Central Coast (530)363.87 ***42.10198.75 ***296.98 ***
South Central Coast (303)−90.14103.16−6.968.70
Central Highlands (74)327.81199.16277.8973.65
Southeast (181)6.92−103.54−48.0114.72
Mekong Delta (511)328.96−1,494.9283.14553.77
Note: * p < 0.1; ** p < 0.05; and *** p < 0.01.
Table 9. Regression results of cash crop participation share (CCPS), crop output market participation share (COMPS), and crop input market participation share (CIMPS) on Food Variety Score (FVS).
Region (Number of observations)OLS 1992/93OLS 1997/98PooledDifference-in-Difference
CCPS
Central Highlands (74)−3.16−1.36−2.59 **−0.363
Southeast (181)0.565.43 ***3.09 ***3.05 ***
COMPS
North mountains and midlands (606)−0.611.53 **0.690.50
Red River Delta (738)−0.94−3.24 ***−2.39 ***−1.79 **
North Central Coast (530)−0.87−1.36−1.16 *−2.29 **
South Central Coast (303)1.66−0.400.04−0.65
Central Highlands (74)0.46−0.270.151.25
Southeast (181)1.491.151.28 *0.20
Mekong Delta (511)3.20 ***0.331.78 ***2.68 ***
CIMPS
North mountains and midlands (606)−0.62−1.11−0.80−1.58 **
Red River Delta (738)−4.19 ***0.11−1.74 ***−1.49 *
North Central Coast (530)−0.232.95 ***1.25 *2.66 ***
South Central Coast (303)−0.780.0003−0.320.37
Central Highlands (74)5.01 *−11.08 ***0.12−1.42
Southeast (181)−2.05−1.44−1.88 *−2.57 *
Mekong Delta (511)−1.14−12.70 *−1.77−2.32
Note: * p < 0.1; ** p < 0.05; and *** p < 0.01.

