The Good, the Bad and the Uncertain: Bioenergy Use in the European Union
by
George Philippidis
1,2,*, 
Heleen Bartelings
3,
John Helming
3,
Robert M’barek
1,
Edward Smeets
3 and
Hans Van Meijl
3 1
Joint Research Centre, European Commission, 41092 Seville, Spain
2
Aragonese Agency for Research and Development (ARAID), Centre for Agro-Food Research and Technology (CITA), Government of Aragón, 50059 Zaragoza, Spain
3
Wageningen Economic Research, Wageningen University and Research, Alexanderveld 5, 2585 The Hague, The Netherlands
*
Author to whom correspondence should be addressed.
Energies 2018, 11(10), 2703; https://doi.org/10.3390/en11102703
Submission received: 23 July 2018
/
Revised: 24 September 2018
/
Accepted: 7 October 2018
/
Published: 11 October 2018
(This article belongs to the Special Issue Energy Markets and Economics)
Abstract
:As the EU is moving towards a low carbon economy and seeks to further develop its renewable energy policy, this paper quantitatively investigates the impact of plausible energy market reforms from the perspective of bio-renewables. Employing a state-of-the-art biobased variant of a computable general equilibrium model, this study assesses the perceived medium-term benefits, risks and trade-offs which arise from an advanced biofuels plan, two exploratory scenarios of a more ‘sustainable’ conventional biofuels plan and a ‘no-mandate’ scenario. Consistent with more recent studies, none of the scenarios considered present significant challenges to EU food-security or agricultural land usage. An illustrative advanced biofuels plan simulation requires non-trivial public support to implement whilst a degree of competition for biomass with (high-value) advanced biomass material industries is observed. On the other hand, it significantly alleviates land use pressures, whilst lignocellulose biomass prices are not expected to increase to unsustainable levels. Clearly, these observations are subject to assumptions on technological change, sustainable biomass limits, expected trends in fossil fuel prices and EU access to third-country trade. With these same caveats in mind, the switch to increased bioethanol production does not result in significant market tensions in biomass markets.
1. Introduction
Over the last twenty years, the European Union (EU) has sought to gradually reduce its dependence on fossil based fuels as part of its overall vision for a low carbon future. In 1997, the EU set the tone in a key White Paper [1] for the encouragement of renewable energy sources (RES). This initiative was followed closely by the Renewable Electricity Directive [2], the Biofuels Directive [3] and the Strategic Energy Technology (SET) Plan [4]. More recently, under the auspices of the Renewable Energy Directive (RED) [5], the EU set out an ambitious agenda to increase the RES share of gross energy and transport fuel consumption by 2020 to 20% and 10%, respectively. Subsequently, Renewable Energy Action Plans [6] for each of the Member States (MS) were introduced, with detailed roadmaps on how to achieve said objectives.
From the perspective of EU energy security, these targeted support policies have undeniably ushered in a more renewables intensive energy sector. Between 1990 and 2015, official data [7] reveals an upsurge in the RES share of gross electricity generation from 12.6% to 29.9%, largely due to major investments in wind and solar. Importantly, the share of biomass in electricity generation (i.e., solid biomass and biogas) has also risen dramatically from 0.4% to 4.7% over the same period. Similarly, in the EU transport fuels sector, conventional- and advanced biofuels accounted for 4.0% and 1.2%, respectively, of the 7.1% RES share achieved in 2016 [8].
The discussion on the viability of bioenergy, however, extends beyond energy security concerns to encompass sustainability criteria (i.e., responsible biomass allocation, indirect land use change (iLUC) and environmental ‘leakage’, reliable trade sources, feed and food security). Whilst measures such as the Fuel Quality Directive (FQD) [9] seek to roadmap credible criteria for the adoption of sustainable biofuel usage, it is still claimed that EU imports of Asian (principally Indonesia and Malaysia) palm oil for conventional biodiesel result in significant deforestation [10]. In addition, the promotion of biomass to meet internal EU energy requirements appears inconsistent with the central tenet of the bioeconomy strategy [11] which prioritizes high value added material uses before eventual recycling and conversion to (lower value added) energy applications—the so-called ‘cascading’ principle [12,13]. In contrast, proponents of conventional biofuels talk up the benefits of co-product protein-based animal feeds to livestock producers, which not only reduce EU dependence on essential sources of imported soybean meal [14] but also alleviate iLUC impacts [15].
Looking ahead, the renewable energy agreement to 2030, foresees a greater role for advanced biofuel technologies. More precisely, targets for RES shares in gross energy consumption and transport are increased to 32% and 14%, respectively [16]. The expectation is that advanced biofuels, which rely on residues and non-food lignocellulosic biomass inputs, will play a key role in responding to sustainability concerns. Indeed, under auspices of the EU’s ‘European Advanced Biofuels Flightpath’ initiative, the promotion of advanced biofuel technologies even extends to the aviation sector. Conventional biofuels, in contrast, will face stricter sustainability requirements, which will favor bioethanol (vis-à-vis biodiesel) production.
The enumeration of these perceived benefits, risks and trade-offs requires a multisector analysis which characterizes the sources of, and constraints on, available biomass, the pervasiveness of rival biomass uses and the resource competition that arises from the links with the broader economy. Moreover, the model should also consider access to third country markets to meet internal biomass requirements. For these reasons, a multi-region computable general equilibrium (CGE) framework is an attractive option.
There are a number of insightful studies assessing EU biofuel policy [17,18,19,20,21] although the resulting impacts on agricultural prices, production and land use, vary considerably, largely due to differences in (inter alia) the time frames of each study and the scenario designs. Typically, modelling applications which recognize extensive margin cropland conversion (i.e., from pastures or forests) and/or enhanced modelling assumptions on land transfer and availability [22,23,24] report greatly reduced land market pressures resulting from biofuels policies. Moreover, modelling improvements in the representation of land yields, explicit accounting for second generation biofuels [25,26] and agricultural residue potentials [25] have also been found to reduce the reported impacts on land pressures and associated food prices and production effects arising from biofuels policies. In other studies [19,21], conventional biofuel co-products are also explicitly modelled, the absence of which has been found to overstate cropland conversion estimates arising from biofuel policies [23].
To the best of our knowledge, only one EU bioenergy foresight modelling exercise for The Netherlands [27] expands the scope of bioenergy, encompassing not only bioelectricity and advanced biofuel technologies, but also recognizing the competition for sources of non-food lignocellulose biomass with latent biochemical and thermochemical material technologies. A further refinement of this research is the explicit incorporation of expected technological advancements in nascent bio-based sectors of the CGE model, which are taken from specialized bottoms-up partial equilibrium models of the biobased energy (IMAGE-TIMER [28,29,30]) and chemicals sectors (MARKAL-UU-NL [28]).
In taking an EU-wide bioenergy focus, this research builds on [27]. Our study further deepens the sector coverage to include biokerosene for aviation, whilst the electricity generation sectors in the model now also includes non-biologically renewable, nuclear and fossil alternatives. To improve the rigor of the study, official EU energy projections are incorporated into our contemporary baseline to 2030. In the context of the policy debate alluded to in the discussion above, the aim of the research is to examine key aspects on the current policy debate surrounding bioenergy, through the careful design and implementation of medium-term scenarios. Thus, the objective is to enumerate the trade-offs and market tensions between food, feed, material, energy, land and other biomass markets that arise from an advanced biofuels plan and two exploratory scenarios consisting of more sustainable conventional biofuels within the current RED. A final stylized simulation examines the elimination of all EU bioenergy support, with a particular focus on the implications for EU energy self-sufficiency. A key underlying hypothesis is whether the current study concurs with more recent literature, which suggests that the impact of bioenergy policies on relevant agricultural, land, feed and biomass markets is potentially overstated.
2. Materials and Methods
2.1. Model and Database
This study employs an advanced recursive dynamic variant of the well-known Global Trade Analysis Project (GTAP) CGE market simulation model [31] and database [32], known as the Modular Applied GeNeral Equilibrium Modelling Tool (MAGNET) [33,34]. With its unrivalled global coverage of countries (140 regions) and markets (57 sectors), the Global Trade Analysis Project (GTAP) database has become a key source of data for conducting economic impact assessments. In its latest incarnation (version 10), the database includes detailed information on production, gross bilateral trade flows, transport costs and trade protection data for a 2011 benchmark year. As a principal secondary data source for the technology and demand structures within each country or region, input-output (IO) national accounts data are used. Importantly, efforts by the GTAP center to disaggregate certain bio-based activities (i.e., primary agriculture and food processing) from the highly aggregated industry/commodity classifications in the IO data are undertaken, although inevitably, more contemporary uses of biomass for feed, fuel and even material applications remain subsumed within their parent industry classifications.
In terms of the model, the CGE approach typically employs constrained mathematical optimization to represent decision making by agents (i.e., intermediate-, final- and investment demands). Producers are assumed to operate under conditions of perfect competition and constant returns to scale, whilst further market clearing and accounting equations ensure that supply equals demand in all markets and national-income, -expenditure and -output flows are equal within each country. A series of price linkage equations with exogenous tax (or tariff) variables capture the market distortions on domestic and imported markets. It is assumed that savings rates in each economy are a fixed share of regional income, whilst total investment in each region is allocated as a function of relative changes in regional rates of return. A neoclassical ‘closure’ rule is assumed which implies that imbalances on the capital account (i.e., regional savings less investment) are compensated by the current account (exports minus imports), such that the balance of payments nets to zero.
The MAGNET model is an advanced derivative of the publically available GTAP model in that it includes a number of non-standard state-of-the-art modelling features (e.g., agricultural policy modelling, land usage, factor market rigidities, biofuels policy, nutrition, greenhouse gases etc.). These ‘modules’ can be easily switched on/off, depending on the focus of the study. With this degree of modelling flexibility, peer reviewed MAGNET impact assessments have appeared in a number of policy arenas including: land-use change [35]; EU domestic support [36]; conventional biofuel policy [17,19]; Food Security [37] and Climate change [38].
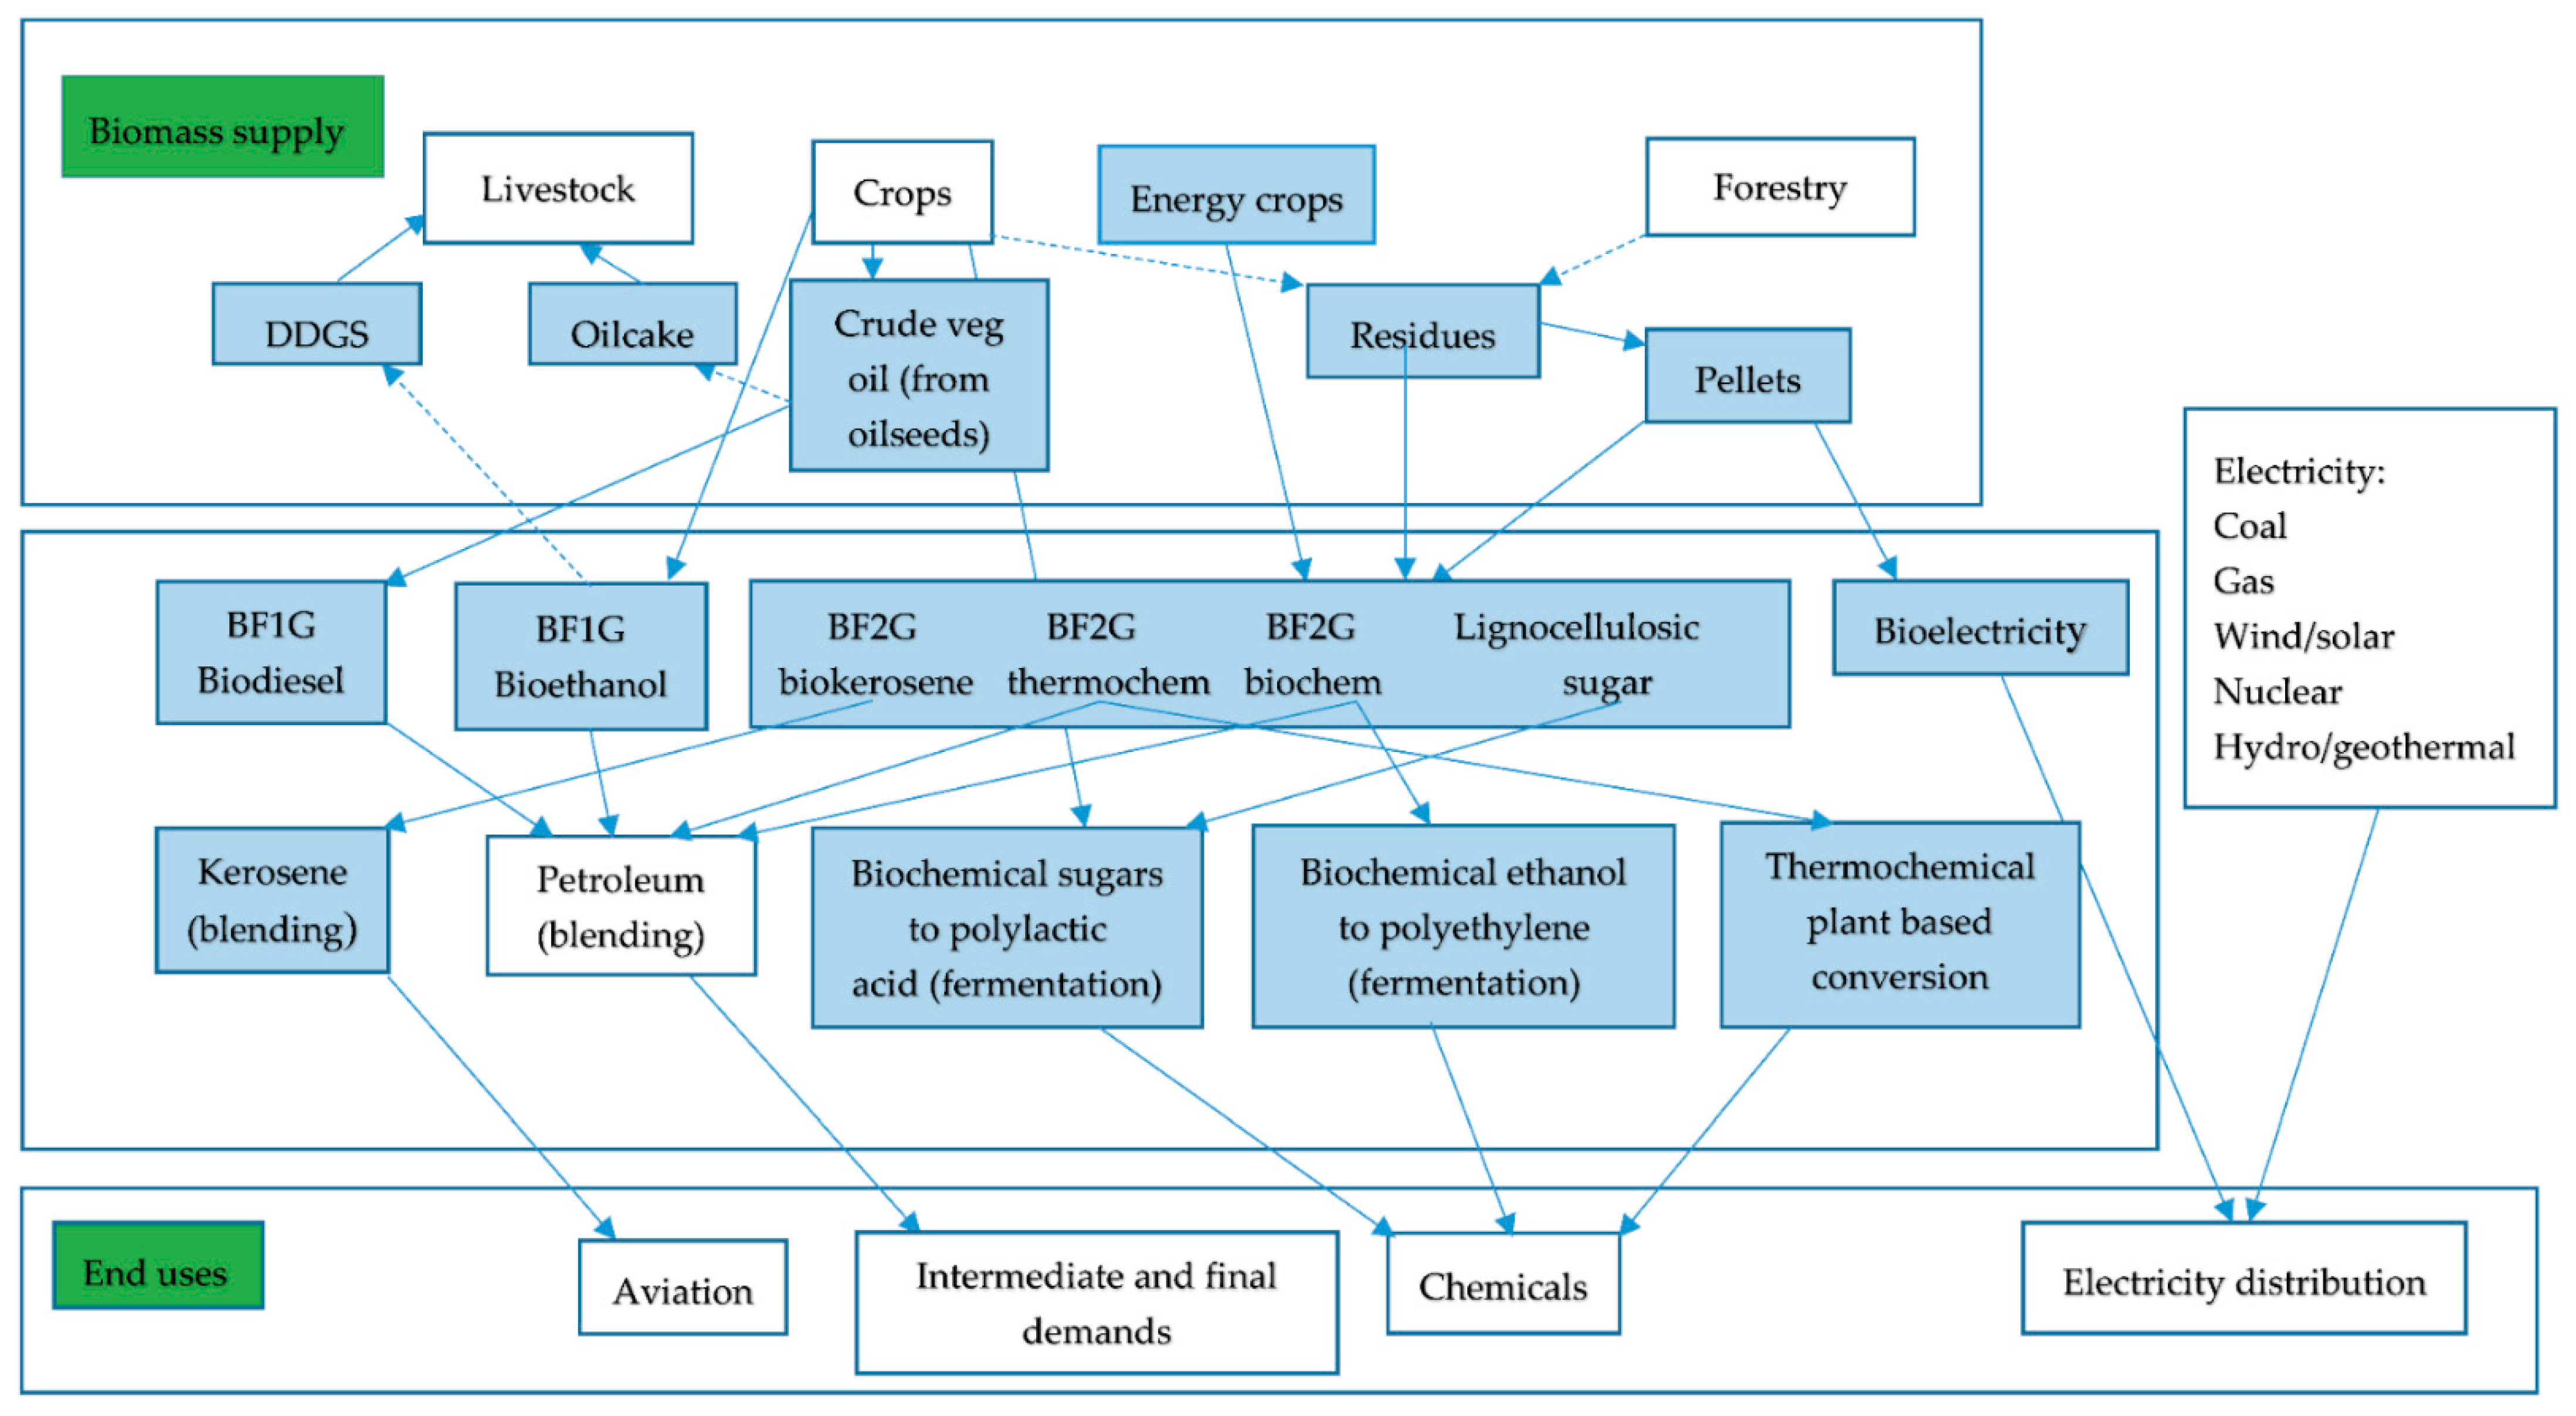
With the current focus, a MAGNET biobased variant of the GTAP database encompasses numerous sector splits from the GTAP parent sectors, combined with policy modelling. Figure 1 shows the ‘new’ MAGNET biobased sectors in blue, with the standard GTAP sectors in white. The arrows indicate the direction of biomass, bio-based energy and chemicals flows, whilst conventional biofuel animal feed co-products are represented by dashed lines. A more detailed description of the data construction is in [34].
The chosen model data disaggregation (Table 1) encompasses lignocellulose biomass sources (i.e., residues, energy crops, pellets), agriculture, food, animal feed, conventional biofuel technologies, advanced biofuels (including biokerosene) and biochemical biomass conversion technologies, and bioelectricity. Non bio-based energy markets are represented by crude and processed fossil fuels and several electricity technologies (fossil, nuclear and non-biological renewables). The regional disaggregation has a mainly EU focus, whilst non-EU regions cover ‘large’ third-country distributors of raw and processed biomass products on world markets and a European residual region of EU neighbors.
2.2. Baseline
The baseline and scenarios implemented here do not represent all of the exact elements of the recent EU energy package finalized in June 2018, but rather resort to reasonable assumptions based on the existing 2020 RED and the proposals prior to the final agreement. Notwithstanding, the agreed targets are close to those modelled here such that the underlying message of the paper is not expected to change.
In this study a medium-term status quo baseline is implemented from 2011 to 2030 over three time periods (2011–2015; 2015–2020; 2020–2030) which follows expected macroeconomic- (real GDP, population), biophysical- (land productivities) and energy- (fossil fuel prices, energy consumption and production trends) trends. Furthermore, attention is given to environmental- (region-wide GHG reductions) and biomass-policies (Common Agricultural Policy, bioenergy support, trade liberalization) based on respected secondary data sources. A detailed discussion of these assumptions and modelling approach is available online in [34], although pertinent assumptions with respect to energy market trends are briefly discussed here.
Following [17], fiscal-neutral first- and second-generation biofuel mandates consistent with the EU’s RED are assumed. In the baseline, the EU-wide average first generation biofuel mandate reaches 7% by 2020 and is maintained to 2030. Taking a time-linear approach, advanced biofuel blending mandates of close to zero in the benchmark year (2011) to 1.5% in 2030, are assumed. To capture the spirit of the ‘European Advanced Biofuels Flightpath’ initiative, biokerosene sold to the kerosene (blending) sector increases up to 0.5% by 2030 (our 0.5% assumption should be considered as an upper limit. Indeed, given the cost disadvantage of bio kerosene next to fossil based kerosene [39], it is noted in that, “…only after 2035 (will) biofuels (bio-kerosene) slowly start penetrating the aviation fuel mix” [36], p. 64). As part of the baseline design [40], electricity generation (including bioelectricity) consistent with the RED and projected residential demand for energy to the year 2030 are presented in Table 2.
2.3. Scenarios
Each policy scenario deviates from the baseline over the decade of 2020–2030. A first illustrative simulation assesses an advanced biofuels (AB) action plan inspired by the EU reform proposals to the RED. Specifically, conventional biofuel blending rates are assumed to fall from an EU28-wide average of 7% in 2030 to 3.8% in 2030, whilst advanced biofuel blending rates rise from an EU28-wide average of 1.5% in 2030 to 3.6% by 2030. This advanced biofuel mandate is an actual measure (vis-à-vis double-counted virtual measure). In the legislature, advanced biofuel sources of biomass include lignocellulose biomass, algae and even municipal solid waste, although only the first of these biomass types is currently contemplated within the MAGNET model global database (see Figure 1). The proposals also include further provisions for increasing usage of biomass in heating, although this is also not currently included in the MAGNET dataset.
In seeking to reinforce the sustainability criterion underlying the EU’s first-generation biofuels policy, there was ongoing debate within the European Parliament to phase out palm-oil based biodiesels [10], which was eventually formalized within the June 2018 agreement with a complete withdrawal of palm-oil usage in conventional biofuels by 2030. Against this background, assuming the same conventional biofuel mandates as in the baseline, two exploratory scenarios are run. In the ‘moderate’ sustainability scenario, all EU imports of palm oil originating from Asia are now eliminated (POE). This is modelled by fixing the bilateral import quantity and endogenising the corresponding tariff. It is estimated that approximately half is used in biodiesel [8]. Since the data does not source imports by specific user, the scenario design eliminates all imports, which results in an overestimation of the resulting output, price and trade impacts. Furthermore, by exogenously controlling extra-EU palm imports from Asia, one cannot examine the possible substitution effects of increased palm oil use in other bio-industrial sectors. In the more ‘extreme’ sustainability scenario, the EU’s first-generation biofuels mandate is now solely covered by bioethanol (ETH).
Finally, a no bioenergy support (NoS) scenario on all EU bioenergy types (i.e., biofuels, biokerosene, bioelectricity), examines the impacts on the EU’s energy self-sufficiency and the resulting impacts on biomass related markets. A full summary of the differences between these scenarios and the baseline assumptions is provided in Table 4.
3. Results
A full discussion of the baseline results is given in [34]. In this section, results are presented for the scenarios in comparison with the baseline for the period 2020–2030. The value estimates are in 2011 constant prices. From a macroeconomic perspective, the AB proposal, plus the exploratory POE and ETH scenarios lead to small relative real EU GDP falls (approximately −0.01%). There is an estimated baseline EU biofuels budgetary cost of €9971 million in 2030 associated with the current RED (Table 5). The encouragement of advanced generation biofuels under the AB plan, requires a significant additional EU investment of €8232 million of public support compared with the baseline (Table 5), although this figure is very much dependent on the assumptions of the costs for the different bioenergy pathways and fossil fuel prices adopted in this study. Similarly, POE and ETH scenarios result in marginal total biofuel budgetary cost increases of €112 million and €986 million, respectively. In contrast the efficiency gains arising from the removal of all biofuels support (NoS, i.e., €10 billion budget saving) increases EU real growth, although in proportional terms, this effect is small (i.e., less than 0.05%).
3.1. Output and Market Prices
The production volume impacts in each of the scenarios compared with the baseline are presented in Table 6.
Under the advanced biofuel proposals, conventional biofuel production falls 46.2%, with a concomitant advanced biofuel output expansion of 136.7%. This reorientation is reflected clearly in the feedstock markets. EU output volume falls in oilseeds (−3.9%) and sugar beet (−1.9%) and animal feed co-products (−8.7%). This is accompanied by strong output volume rises (from smaller bases) in non-food lignocellulosic biomass such as pellets, residues and energy crops (63.5%, 23.3% and 6.1%, respectively), although alternative material uses of said biomass are crowded out. For example, relative output reductions are observed for polylactic polymers (−0.3% or −€0.35 million) and polyethylene polymers (−1.0% or −€0.09 million) and thermochemical biomass conversion technologies (−3.9% or −€0.42 million), as well as biokerosene (−0.5% or −€4.7 million) and bioelectricity (−7.1% or −€1.2 billion). The output gap in electricity generation is met by non-biological renewables and fossil fuels in equal measure (approximately 1%). Advanced thermal and biochemical fuel technologies volumes rise by over 130% (equivalent to a relative rise of 2684 million liters—Table 5).
Examining market prices, the effects are moderate, largely due to access to third-country biomass trade (see next section). Thus, price rises are observed for EU advanced biofuels (2.5%) and price falls for conventional biofuels (−2.1%). Similarly, the price variations in upstream feedstocks for both advanced and conventional biofuels are muted (i.e., no greater than 5%). Resulting cost push effects are witnessed in the bio-kerosene and bioelectricity markets (3.6% and 2.0%, respectively), whilst electricity price impacts are insignificant.
In both the POE and ETH scenarios, food price and macroeconomic impacts are negligible, whilst the market impacts in the POE scenario are largely restricted to the first-generation biofuel production chain. In the POE scenario, EU biodiesel output volume falls 3.4% compared with the baseline (−146 million liters (Table 5)), with a concomitant rise in bioethanol output volume of 5.5% (35 million liters (Table 5)). In the baseline, it is estimated that bioethanol and biodiesel production reaches 635 million liters and 4.3 billion liters, respectively, by 2030. Similarly, baseline advanced generation biofuels production under an assumed 1.5% mandate is approximately 2 billion liters in 2030. This compares with 2017 estimates of conventional biofuel production of approximately 2.6 billion liters [8]. This same report also states that by 2021, advanced biofuels could reach 200 million liters, although for the reforms to the RED, “the consumption of advanced biofuels must increase significantly from 2020” [8], (p. 3). Despite the fall in biodiesel output, the loss of imported crude vegetable oil from Asia is substituted with EU produced oilseeds and crude vegetable oil feedstocks, which increase 1.6% and 4.6%, respectively. The expansion in bioethanol production has only moderate effects on upstream sugar beet production (0.3%), suggesting greater import dependence (see next section). With the rise in EU crude vegetable oil and bioethanol production, EU oilcake and distillers dried grains and soluble (DDGS) co-products output rises 4.4% and 5.4%, respectively. With increased internal demand for first generation feedstocks of oilseeds, crude vegetable oil and sugar beet, market prices rises are moderate (0.7%, 1.1% and 0.2%, respectively), which slightly pushes up costs in biodiesel (0.6%) and bioethanol (2.0%).
In the ETH scenario, there is four-fold increase in EU bioethanol production (420%, or 2666 million liters (Table 5)) with a concurrent collapse in (the larger) biodiesel sector (−4319 million liters (Table 5)), leading to a 29.4% contraction in EU conventional biofuel production. EU oilseed and crude vegetable oil production declines 7.4% and 17.7%, respectively. Similarly, increased bioethanol demand for biomass feedstock has a marked effect on EU sugar beet production (24%) and even cereals production (1.5%). An associated resource-conflict that arises is that less bioethanol is reserved for biochemical applications (e.g., polyethylene polymer output volume declines −6.6%), whilst increased processed sugar uptake in bioethanol is consequently diverted away from polylactic polymer production (−1.5%), part of which is met by increased supply of lignocellulosic sugar (8.0%—from a small base). In all the experiments, there are strong impacts on animal feed co-products. As a bioethanol by-product, rising DDGS production (402%) does not compensate crude vegetable oil co-product oilcake falls (−16.7%), generating an aggregate animal-feed by product production fall of −6.3%.
As expected, EU bioethanol prices rise 15.1%, reflecting the cost increases in sugar beet (8.1%) and cereals (0.6%) feedstocks, whilst the ethanol using polyethylene sector exhibits a price rise of 5.6%. Biodiesel, crude vegetable oil and oilseeds market prices fall −4.1%, −5.0% and −3.1%, respectively. DDGS market prices fall 53%, although with 9% rises in oilcake prices, composite co-product animal feed prices rise 6.9%.
In the NoS scenario, there is an output value loss of €11.4 billion in combined conventional and advanced biofuels and close to €945 million in the bio-kerosene sector (Table 6). As a result, output contractions are observed in conventional biofuels feedstocks (oilseeds, sugar), advanced biofuel feedstocks (e.g., energy crops, residues, pellets), and biofuel by-product animal feeds. Elsewhere, there is evidence of a redistribution of biomass into nascent EU bio-chemical (polyethylene, polylactic acid) and thermochemical lignocellulose biomass conversion technologies, although in value terms, the relative increase is limited (€7 million and less than €1 million, respectively).
Bioenergy feedstock market prices fall for EU oilseeds (−3.2%) and sugar beet (−2.1%), although cereals price changes are negligible. Elsewhere, non-food lignocellulosic biomass prices fall between −2.5% (pellets) to −9.0% (energy crops). Falling feedstock prices result in market price falls in contracting biofuels sectors, whilst the increased availability of rechanneled biomass reduces per unit costs in advanced biochemical sectors, most notable in the case of the polyethylene sector (−8.8%). In contrast, reduced availability of animal feed co-products increases market prices for oilcake (9.3%) and DDGS (83.7%). The removal of all biofuel mandates registers non-trivial impacts in the energy market. With the fall in EU bioelectricity output volume (−26.8%), electricity generation from wind/solar renewables (in the EC baseline [38], it is expected that hydroelectricity will not expand beyond current physical capacity limits (see also [38], p. 974)), whilst for political reasons, nuclear power capacity does not expand (see Supplementary Materials), coal-fired and gas-fired power stations rises 4.3%, 3.6% and 2.7%, respectively, without any significant market price rises (i.e., below 1%).
3.2. Trade Effects
Table 7 shows the value changes in trade in millions of euros (2011 constant prices) compared with the baseline. The extra EU trade balance is calculated as exports minus imports. A positive change in this trade balance indicates increases in exports and/or decreases in imports. Under AB, conventional biofuel extra-EU imports fall between 40–50%, with an associated trade balance improvement of €484 million and a total trade balance improvement in conventional biofuel feedstocks of cereals, oilseeds, sugar beet and crude vegetable oil totaling €1325 million. As an essential element in meeting to EU’s increased advanced biofuels mandate, extra-EU imports of pellets and processed advanced biofuels results in trade balance deteriorations of −€250 million and −€1233 million, respectively, whilst the crowding out of EU produced biokerosene production leads to a −€554 million to maintain the kerosene mandate. Fossil fuel trade balances are largely unaffected. The loss of EU produced oilcake feed is compensated by a 6% increase in extra-EU imports leading to a €220 million trade balance deterioration.
In the POE scenario, the elimination of extra-EU palm oil imports from Asia results in a 22.0% fall in total extra-EU imports of crude vegetable oil and an associated trade balance improvement of €732 million. To bridge the shortfall, there are relative rises in extra-EU imports of oilseeds (4.7%), sugar beet (0.9%), bioethanol (5.4%) and biodiesel (1.1%). Interestingly, the total associated trade balance deterioration from these import rises (−€459 million) is less than the EU trade balance saving noted above. Intra-EU trade trends for bioethanol and biodiesel follow the output trends noted in Section 3.1 above, whilst reduced EU biodiesel capacity and greater EU import dependence on bioethanol stifle extra-EU exports of both. The output volume rise in EU produced animal feed co-products leads to a trade balance improvement of €113 million.
In the ETH scenario, intra-EU trade and extra-EU imports of biodiesel disappear, with an associated EU trade balance improvement of €762 million (Table 7), although this is accompanied by a rise in extra-EU imports of bioethanol of 810.4% and an EU trade balance deterioration of €1656 million. Extra-EU imports fall (EU trade balances improve) for crude vegetable oil 29.9% (€1000 million) and oilseeds 16.4% (€1422 million) respectively; whilst internal EU surpluses are diverted onto world markets. In contrast, notable rises in extra-EU imports of bioethanol feedstocks of raw sugar (50.8%) and cereals (4.4%) lead to trade balance deteriorations of €505 million and €196 million, respectively. With the production drop in EU oilcake animal feed (from biodiesel), extra-EU import dependence on this protein based animal feed rises 11.3%, with an associated €416 million trade balance deterioration.
In the NoS scenario, intra-EU trade and extra-EU imports of conventional biofuels, advanced biofuels and biokerosene collapses, with associated external balance improvements of €1033 million, €1290 million and €1102 million, respectively. In conventional biofuel feedstock of oilseeds, crude vegetable oil and sugar beet, as well as pellets, the same aforementioned trends arise, with resulting trade balance improvements of €1388 million, €1006 million, €283 million and €353 million, respectively. Unlike the AB scenario, EU cereals trade remains unaffected due to the real income driven rises in internal EU cereals demand. In the case of protein-based oilcake, there is an additional reliance on extra-EU imports (13.7%) to meet internal EU shortages resulting in a trade balance deterioration of −€503 million.
Reduced bioenergy and associated biomass usage is accompanied by extra-EU import rises of 2.8%, 1.5%, 0.7% and 0.4% in coal, crude oil, gas and refined petroleum extra-EU imports, respectively. In value terms, this equates to trade balance deteriorations of −€419 million, −€5133 million, −€564 million and −€459 million, respectively. Netting out these energy related trade balance shifts, the EU requires an additional €253 million in extra-EU imports from the abolition of bioenergy support instruments.
3.3. Land Use
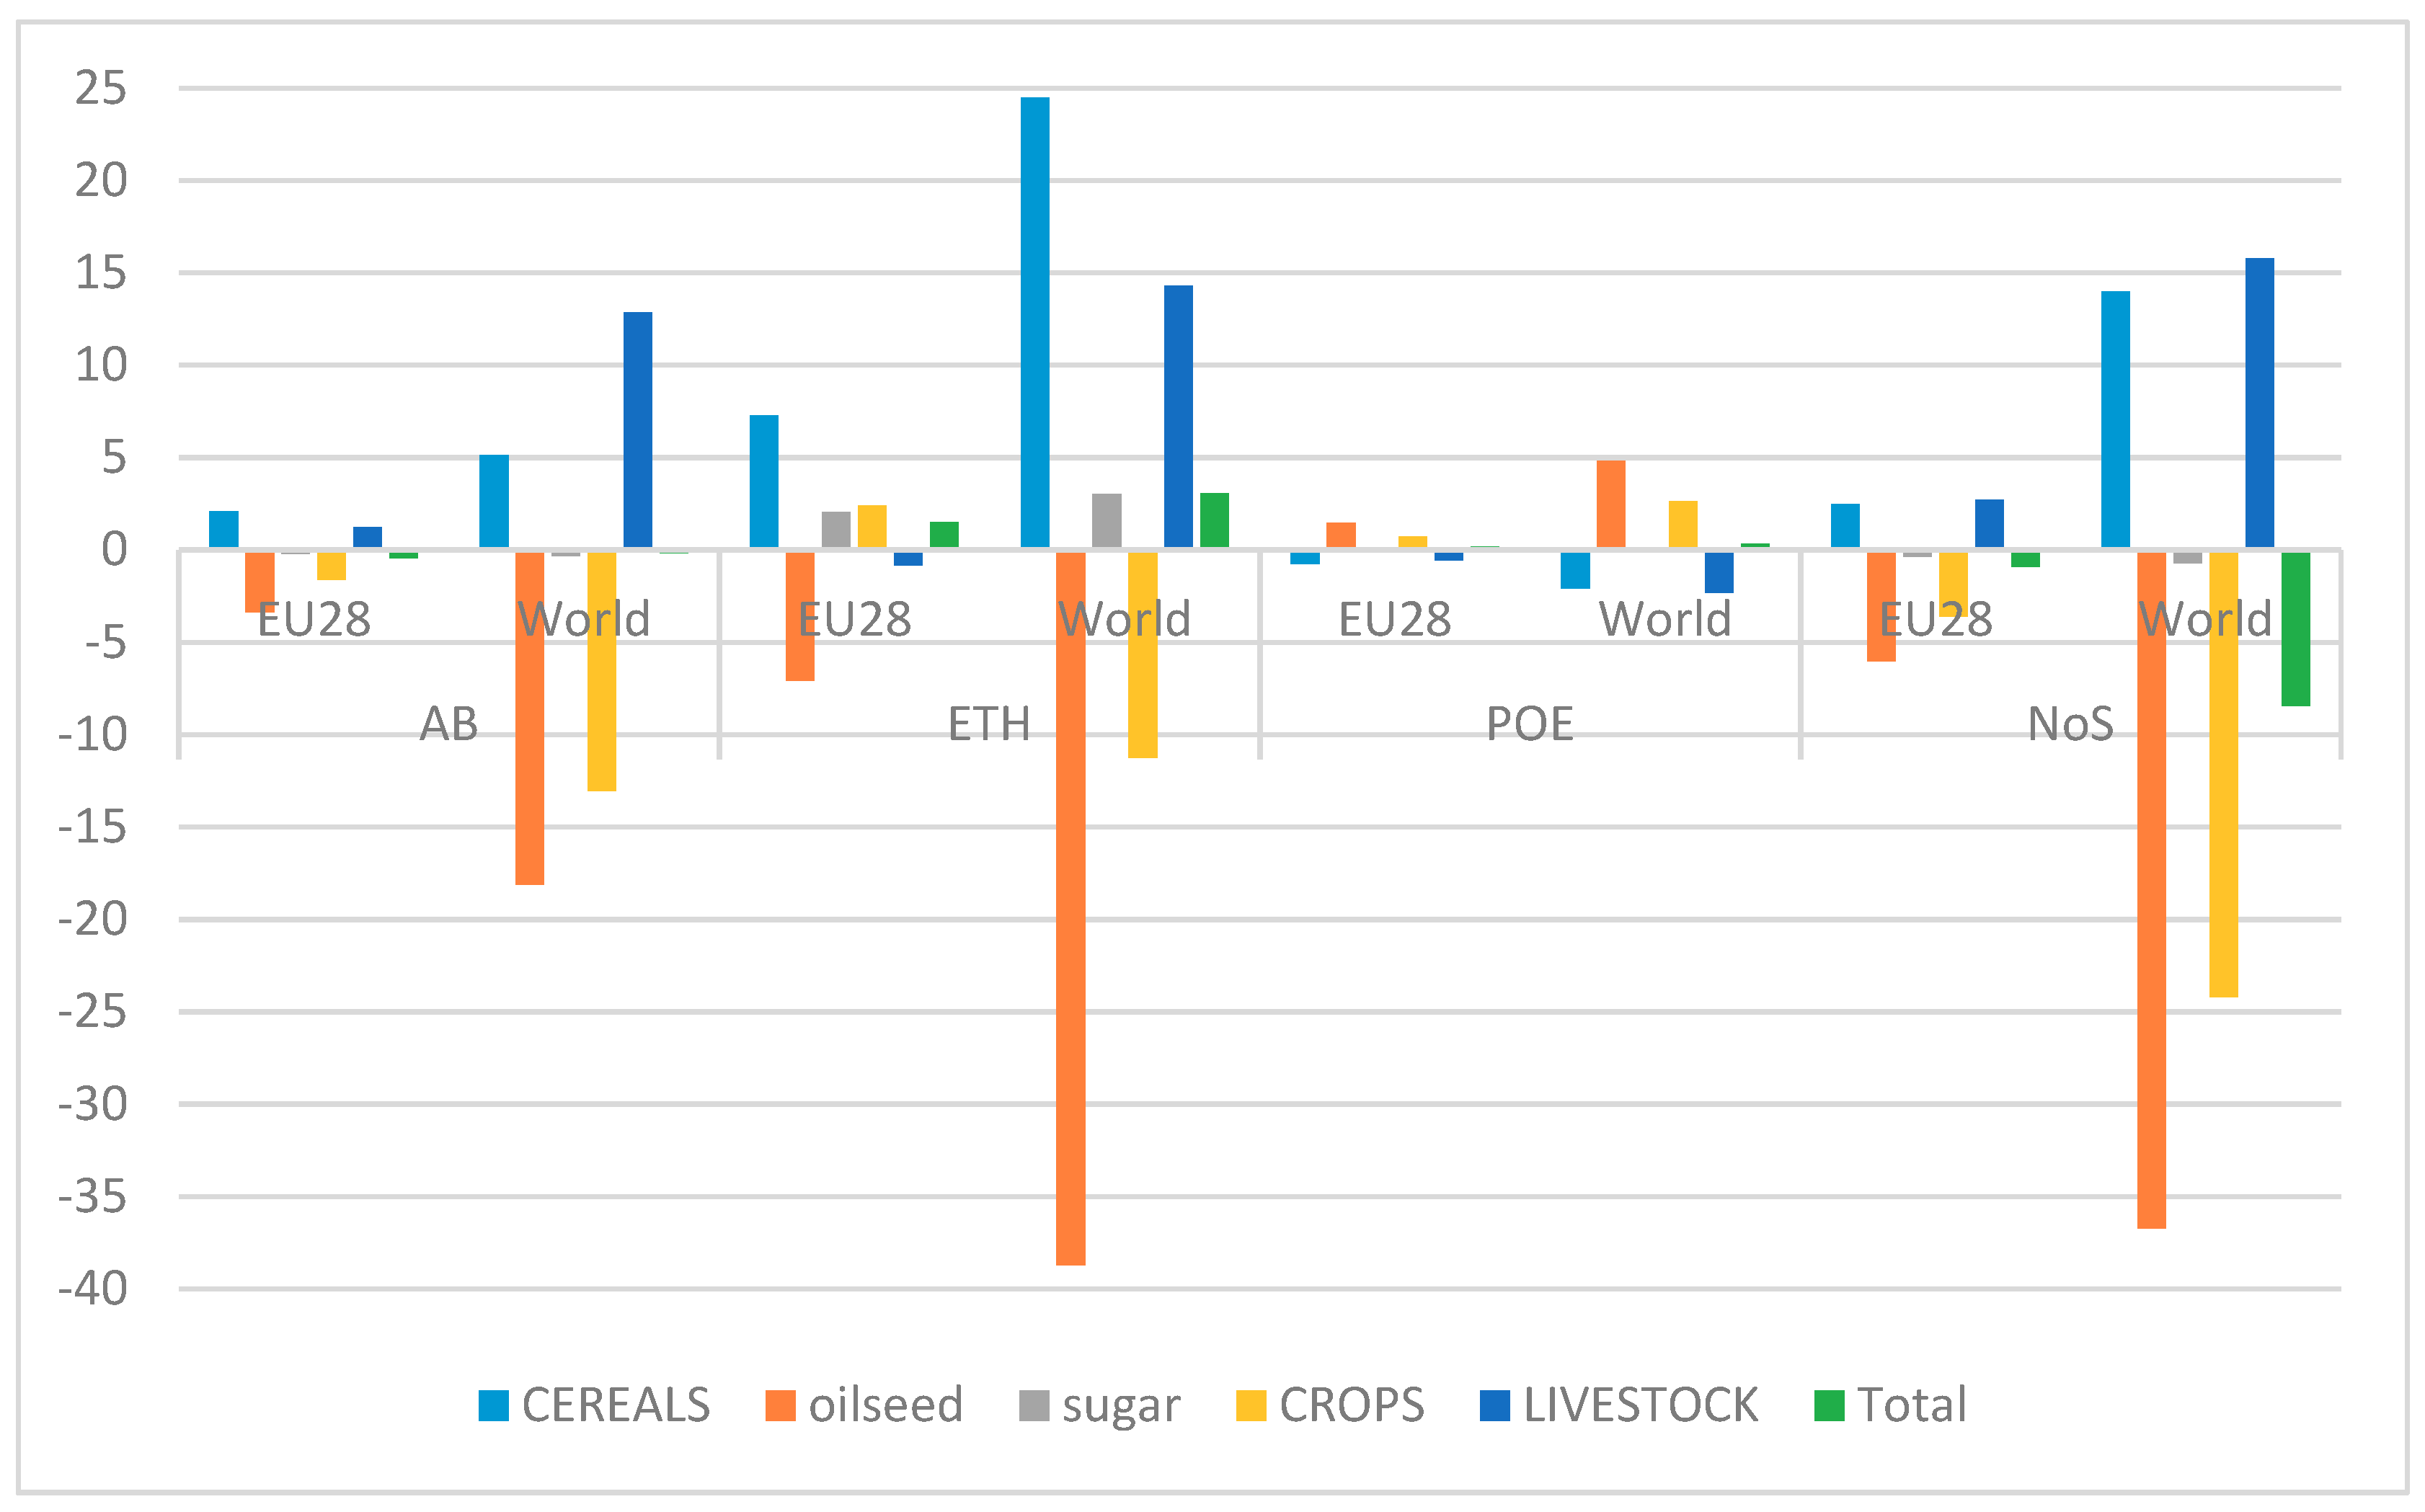
The impacts on land usage (in km2) are shown in Figure 2. As a general observation, neither the AB proposal, nor the three exploratory scenarios have a major impact on aggregate land usage in the EU. On the other hand, there is evidence that, at the margin, biofuel policies have a clear impact on EU and global land usage for oilseeds (for biodiesel) and raw sugar (for bioethanol) cropping areas.
The AB results reveal the land use savings resulting from these proposals. Increased advanced fuel volumes require an estimated 4.2% increase in EU land area devoted to non-food lignocellulose energy crops. In absolute terms, however, the change in land area of energy crops is small (40 km2) (not shown in Figure 2), as most of the extra biomass for advanced fuels is coming from residues (see Table 6 for the relative sizes of different biomass sources). Concomitantly, land pressures are alleviated as EU land usage in oilseeds and sugar beet activities falls −3371 km2 (−2.7%) and −206 km2 (−1.4%), respectively. Once again, land is principally reassigned to cereals usage (2085 km2 or 0.3%), or even extensive livestock (1220 km2 or 0.1%), although the total EU land area witnesses a negligible fall of −459 km2. Reduced EU dependency on third-country sources results in a global reduction in oilseeds and sugar land areas sown of −18,128 km2 (−0.7%) and −357 km2 (−0.1%), respectively.
On eliminating extra-EU Asian imports of palm oil (POE), the need for domestic substitutes (and imports) has clear implications for land usage in the EU. Thus, oilseeds land usage rises 1442 km2 (1.1%) to fill the gap from lost Asian palm oil imports. The relatively minor impact of increased bioethanol production on EU sugar beet land area (31 km2 or 0.2%) is indicative of the EU’s preferred dependence on third-country sources of raw feedstocks and processed bioethanol. With a strong rise in oilseeds area, there is a switch away from cereals land (despite increased uptake from bioethanol) and from livestock land to cropland. As a result of the import ban, in the non-EU regions, the reduction in oilseeds land area in the ROW region (includes Asia) is −1522 km2 or −0.2% (not shown). On the other hand, higher extra-EU imports of oilseeds from substitute third-countries increases the global area sown by 4816 km2 (0.2%).
In the ETH scenario, the EU land area devoted to oilseeds falls −7074 km2 (−5.6%). On the other hand, in cereals and sugar beet cropping areas there is an additional estimated EU land uptake of 7268 km2 (1.1%) and 2034 km2 (13.5%), respectively. As indicated in the POE scenario, there is an output gap in EU bioethanol production, which is bridged by third-country imports. Consequently, an additional 874 km2 (0.5%) of sugarcane land is sown in South and Central America (not shown), with a corresponding global increase of 3000 km2 (0.8%). Similarly, there is a relative reduction in third country oilseed land area sown, such that global oilseeds land area contracts by −38,714 km2 (−1.4%).
In the NoS scenario, the EU land areas sown for oilseeds and sugar beet decline by −6050 km2 (−4.8%) and −383 km2 (−2.5%) respectively (in the EU, these land use falls are slightly less than the ETH scenario because of demand driven rises for agrifood products due to the slight rise in EU macroeconomic growth in the NoS scenario). Despite the collapse of bioethanol, a portion of this land reduction is re-diverted into cereals (2479 km2 or 0.4%), whilst the livestock sector also witnesses greater uptake of land (2699 km2 or 0.3%) at the expense of cropping activities. Lignocellulose energy cropland area contracts by −104 km2 (−10.9%), although overall, total EU land usage is reduced by a (moderate) 908 km2 (−0.1%). As expected, oilseed land areas in non-EU regions falls by a similar magnitude to the ETH scenario, whilst sugarcane land area in South and Central America falls by 318 km2 (−0.2%). Globally, oilseed, sugar and lignocellulose energy cropland contract −1.3%, −0.2% and −3.7%, respectively; whilst land reallocation effects lead to a very slight rise (0.2%) in the cereals land area.
4. Discussion
In June 2018, the European Union (EU) finalized an agreement to further decarbonize its energy sector. Under the auspices of the advanced biofuels (AB) plan, biomass will continue to contribute as a part solution, although it must balance energy security concerns with sustainability criteria. From the broad perspective of EU food security, all bioenergy scenarios are consistent with previous studies in that they exert only limited impacts on EU agricultural land usage [42,43,44,45] and EU agrifood production [43,46]. Indeed, this finding supports the observation made in the introduction regarding the impacts of explicitly accounting for second generation biofuels, biofuel by-products, extensive land transfer, land yields and (non-food) residue potentials in economic modelling studies.
Examining the AB proposal, the study supports the sustainability claim that increased usage of non-food cellulosic feedstocks in advanced biofuels necessitates only moderate increases in land uptake, alleviates land use pressures both in the EU and non-EU regions through reductions in cultivated oilseeds and sugar beet areas and improves the EU’s biomass and conventional biofuels trade balance. The AB scenario does require significant capacity increases in high-energy crops, pellets and residues, although the evidence here corroborates the analysis of [42]. More precisely, if EU supply chains for biomass develop satisfactorily (i.e., respect biodiversity, conservation and erosion), coupled with available EU access to third-country imports of non-food cellulosic feedstocks, the resulting price rise for advanced biofuels is not expected to generate prohibitive bottlenecks in reaching EU mandates. This result therefore challenges fears of overoptimistic expectations of technological enhancements in advanced biofuels [47], although further research into ‘bottoms-up’ engineering estimates of technological change would help ensure a more solid basis for setting out plausible ‘real’, rather than (double-counted) ‘virtual’, mandates.
The AB does, however, face potential challenges. Firstly, subject to the technology change assumptions of this study, the implementation of a more sustainable energy plan is found to carry a significant taxpayer cost, although this is potentially overstated since the fossil fuel price assumptions by 2030 are toward the lower end. Moreover, there are stakeholder concerns that a strategy of premature substitution of conventional biofuels with advanced biofuel alternatives could irrevocably harm investor confidence in the entire biofuels sector [15]. Another issue relating to AB is the broader notion of public policy incoherence. Contrary to the EU’s current strategy toward innovative high-value biomass conversion technologies [11], a resource trade-off is observed as nascent biochemical and thermochemical material conversion technologies contract, although this effect is not unduly strong. Furthermore, a bio-energy trade-off is observed, as increases in advanced biofuels volumes compromise bioelectricity production through the rechanneling of pellets, although this finding does not account for the compensating role of organic and municipal waste in (bio-) electricity production.
In the two exploratory conventional biofuels scenarios of conventional ethanol only (ETH) and palm oil elimination (POE), as with AB, there is little evidence to support biomass bottlenecks (i.e., significant price rises) in the EU. Again, this result is dependent upon the agricultural productivity assumptions and continued smooth EU access to third country sources of raw and processed biomass. In first-generation feedstock crop activities (i.e., oilseeds, crude vegetable oil and sugar beet sectors), whilst market impacts are more visible, particularly in the ETH scenario, the promotion of more sustainable bioethanol production is not found to incur any stress on cereals markets. Indeed, in the ETH scenario, there is even evidence of a redistribution of oilseeds land into cereals activities. Curiously, the hypothesized sustainability improvement of the POE scenario is in doubt since the net oilseed land impact at the global level is positive, which suggests that biodiesel feedstock sourced from Asia has, on average, a lower land requirement than the rest of the world.
In the animal feed market, the loss of EU sourced protein-rich oilcake from the contraction of the biodiesel sector is clearly observable in the AB proposal and the ETH and NoS scenarios, although this does not carry significant marginal cost-driven implications for EU livestock producers in any of these scenarios. Indeed, whilst there are increases in EU imports for oilcake feed of between 6% (AB) to 14% (NoS), the trade data reveals that it does not impact significantly on the EU’s already high dependence on protein feed imports, a sentiment echoed by [48]. Furthermore, the contraction in non-EU region oilseed land area in the three scenarios (i.e., reduced ‘leakage’), shows that reduced extra-EU import demand for conventional biofuel feedstocks outweighs shortfalls on the EU’s internal market for protein-based animal feeds. This result is of interest in the currently ongoing debate on a European strategy for the promotion of protein crops to reduce the dependency from protein imports.
Finally, under the extreme scenario of eliminating EU bioenergy support (NoS), both nascent and conventional bioenergy sectors remain heavily dependent on EU policy support, a result supported by other studies [27,49]. Thus, this market mechanism is an important ingredient for sustaining incomes, employment and development in rural areas, as bioenergy (feedstock) production is especially located in these areas. On the other hand, a macroeconomic efficiency gain is reported under NoS, although this may provide little solace for rural livelihoods, particularly the associated frictional unemployment impacts arising from structural changes between ‘market equilibria’.
EU energy security is also compromised under the NoS scenario, although the energy price impact is very limited contingent upon assumptions of unfettered third-country trade access and available compensating capacity in the EU’s wind and solar sectors. A caveat of this conclusion, however, is that the study does not contemplate the contribution of organic and municipal biomass waste streams in (inter alia) biogas, bio-heating and electricity, which are component parts of the NREAPs. In terms of sustainability, NoS undoubtedly bestows beneficial environmental effects, as agricultural land pressures, particularly in oilseeds, are relieved in all regions, although in proportional terms, the reductions are relatively small (<5%).
As with any modelling endeavor, there are caveats, chief among them being the deterministic (i.e., non-stochastic) behavior of agents, the assumption of equilibrium market clearing and optimal allocation of resources in initial situation and given available technologies, the stylized representation of investment, and the conditionality imposed on model results by the choice of model closure. A further important omission is the lack of treatment of forestry land and associated carbon stocks, which has pertinence when examining issues of iLUC. Finally, an improved characterization of available natural fossil based resources, which endogenously reflect expected rates of extraction and depletion conditions under changing market conditions (i.e., price changes), would also improve the veracity of the model results. Despite these caveats, it is found that the features of the MAGNET model and extensions to the new and old bio-economy sectors, makes it extremely useful to reduce uncertainties and to get insights into pull directions of production, trade and land use changes resulting from EU bioenergy policies.
5. Conclusions
Employing a state-of-the-art bio-based variant of the MAGNET computable general equilibrium model, and comparing with a carefully designed medium-term status quo baseline, this study examines four exploratory EU bioenergy policy scenarios which reflect aspects of the currently policy debate. The aim is to re-assess the energy market implications, as well as identify and enumerate potential resource bottlenecks, with a particular focus on economic efficiency, land use, competing biomass availability and food security. A general conclusion is that none of the scenarios considered presents significant challenges to EU food-security or agricultural land usage—a result which is consistent with recent literature.
Subject to the assumptions of the study, the advanced biofuels (AB) scenario is arguably an attractive (part-) solution from a sustainability criterion, although this policy initiative carries a notable taxpayer cost, whilst it also diverts biomass away from higher-value bio-chemical and thermochemical material conversion technologies.
Restricting EU conventional biofuels to bioethanol only (ETH), there are notable impacts in associated EU bioethanol and biodiesel feedstock markets, particularly in the EU sugar markets. On the other hand, the ETH scenario does not introduce market stresses in cereal (feedstock) markets, in part due to the reallocation of land dedicated to oilseeds, to cereals activities. With the loss of access to EU palm oil imports from Asia (POE), the market impacts on EU sources of crude vegetable oil and oilseeds are mild, whilst (perhaps surprisingly) global usage of land dedicated to oilseeds rises.
Finally, the removal of all forms of bioenergy support (NoS), whilst bestowing a considerable budgetary saving to the EU taxpayer with resulting market efficiency gains, inevitably causes some disruption to the EU’s energy security, mainly in the electricity generation market. This market impact, however, is compensated by capacity increases in non-biological renewable sectors and small increases of EU imports of fossil alternatives.
Supplementary Materials
A technical report cited in the main text is available online at: https://ec.europa.eu/jrc/en/publication/magnet-model-framework-assessing-policy-coherence-and-sdgs-application-bioeconomy.
Author Contributions
In collaboration with DG RTD, all authors (led by R.M.) were involved in the conceptualisation and design of the scenario experiments. J.H. was responsible for coordinating the different team members at all stages of the research. G.P. took the lead with the modelling, running the simulations, the analysis of the results and the writing of the paper. H.B. and E.S. were responsible for validating the database. H.B., J.H., H.v.M., R.M., G.P. and E.S. all played a part in validating the results. R.M. and H.v.M. provided additional policy insights and orientation.
Funding
This research was funded by an administrative arrangement between the Directorate-General for Research and Innovation (DG RTD) and the Joint Research Centre of the European Commission.
Acknowledgments
The authors are grateful to three anonymous reviewers for their comments on an earlier version of this paper. We would also like to thank Antonio Soria (JRC, Seville) for comments on an earlier version of the paper. Finally, thanks go to Maaike Post Uiterweer for helping to format the paper.
Conflicts of Interest
The authors declare that there are no conflicts of interest. The views expressed here should not be taken as representing those of the European Commission.
References
- European Commission (EC). Energy for the Future: Renewable Sources of Energy. In White Paper for a Community Strategy and Action Plan; COM (97) 599 Final; European Commission: Brussels, Belgium, 1997. [Google Scholar]
- European Commission (EC). Directive 2001/77/EC of the European Parliament and of the Council on the Promotion of Electricity from Renewable Energy Sources in the Internal Electricity Market; European Commission: Brussels, Belgium, 2001. [Google Scholar]
- European Commission (EC). Directive 2003/30/EC of the European Parliament and of the Council of 8 May 2003 on the Promotion of the Use of Biofuels or Other Renewable Fuels for Transport; European Commission: Brussels, Belgium, 2003. [Google Scholar]
- European Commission (EC). A European Strategic Energy Technology Plan (SET-PLAN). In Towards a Low Carbon Future; COM (2007) 723 Final; European Commission: Brussels, Belgium, 2007. [Google Scholar]
- European Commission (EC). Directive 2009/28/EC on the Promotion of the Use of Energy from Renewable Sources and Amending and Subsequently Repealing Directives 2001/77/EC and 2003/30/EC; European Commission: Brussels, Belgium, 2009. [Google Scholar]
- Energy Centre of the Netherlands (ECN). Renewable Energy Projections as Published in the National Renewable Energy Action Plans of the European Member States; Energy Centre of The Netherlands: Petten, The Netherlands, 2011. [Google Scholar]
- Eurostat. Gross Electricity Production by Fuels. 2018. Available online: http://ec.europa.eu/eurostat/statisticsexplained/images/0/03/Gross_electricity_production_by_fuel%2C_GWh%2C_EU-28%2C_1990-2015-T1.png (accessed on 10 May 2017).
- United States Department of Agriculture (USDA). EU28 Biofuels Annual 2017; GAIN Report Number NL7015; USDA: Washington, DC, USA, 2017.
- European Commission (EC). Directive 2009/30/EC Amending Directive 98/70/EC and Directive 1999/32; European Commission: Brussels, Belgium, 2009. [Google Scholar]
- EurActiv. EU Parliament Ends Palm Oil and Caps Crop-Based Biofuels at 2017 Levels. 2018. Available online: https://www.euractiv.com/section/agriculture-food/news/eu-parliament-ends-palm-oil-and-caps-crop-based-biofuels-at-2017-levels/ (accessed on 16 March 2018).
- European Commission (EC). Innovating for Sustainable Growth: A Bioeconomy for Europe, Communication from the Commission to the European Parliament, the Council, the European Economic and Social Committee and the Committee of the Regions; European Commission, DG Research and Innovation: Brussels, Belgium, 2012. [Google Scholar]
- OECD. Bio-Based Chemicals and Bioplastics: Finding the Right Policy Balance; OECD Science, Technology and Industry Policy Papers, No. 17; OECD Publishing: Paris, France, 2014; Available online: http://dx.doi.org/10.1787/5jxwwfjx0djf-en (accessed on 5 March 2018).
- Vis, M.; Mantau, U.; Allen, B. (Eds.) Study on the Optimised Cascading Use of Wood; No 394/PP/ENT/RCH/14/7689 Final Report; European Commission: Brussels, Belgium, 2016; 337p. [Google Scholar]
- Farm Europe. Proteins and Renewable Energy: One and the Same Challenge. 2018. Available online: http://www.farm-europe.eu/wp-content/uploads/2018/03/Prot.-R.E.-One-challenge-FINAL-1.pdf (accessed on 16 March 2018).
- EurActiv. Commission’s Biofuels Proposal May Kill Future Investment, Industry Warns. 2017. Available online: https://www.euractiv.com/section/agriculture-food/news/biofuels-phase-out-will-increase-demand-for-feed-imports-industry-warns/ (accessed on 16 March 2018).
- EurActiv. EU Strikes Deal on 32% Renewable Energy Target and Palm Oil Ban After All-Night Sesion. Available online: https://www.euractiv.com/section/energy/news/eu-strikes-deal-on-32-renewable-energy-target-and-palm-oil-ban-after-all-night-session/ (accessed on 5 September 2018).
- Banse, M.; van Meijl, H.; Tabeau, A.; Woltjer, G. Will EU biofuel policies affect global agricultural markets? Eur. Rev. Agric. Econ. 2008, 35, 117–141. [Google Scholar] [CrossRef] [Green Version]
- Kretschmer, B.; Narita, D.; Peterson, S. The Economic Effects of the EU Biofuel Target. Energy Econ. 2009, 31, 285–294. [Google Scholar] [CrossRef] [Green Version]
- Banse, M.; Van Meijl, H.; Tabeau, A.; Woltjer, G.; Hellmann, F.; Verburg, P.H. Impact of EU biofuel policies on world agricultural production and land use. Biomass Bioenergy 2011, 35, 2385–2390. [Google Scholar] [CrossRef]
- Britz, W.; Hertel, T.W. Impacts of EU Biofuels directives on global markets and EU environmental quality: An integrated PE, global CGE Analysis. Agric. Ecosyst. Environ. 2011, 142, 102–109. [Google Scholar] [CrossRef]
- Laborde, D.; Valin, H. Modelling Land Use Changes in a Global CGE: Assessing the EU Biofuels Mandates with the Mirage BioF model. Clim. Chang. Econ. 2012, 3, 1250017. [Google Scholar] [CrossRef]
- Golub, A.; Hertel, T.W. Modelling land-use change impacts of biofuels in the GTAP-BIO framework. Clim. Chang. Econ. 2012, 3, 1–30. [Google Scholar] [CrossRef]
- Taheripour, F.; Hertel, T.W.; Tyner, W.E.; Beckman, J.F.; Birur, D.K. Biofuels and their by-products: Global economic and environmental implications. Biomass Bioenergy 2010, 34, 278–289. [Google Scholar] [CrossRef] [Green Version]
- Dixon, P.; van Meijl, H.; Rimmer, M.; Shutes, L.; Tabeau, A. RED vs. REDD: Biofuel Policy vs Forest Conservation. Econ. Model. 2016, 52, 366–374. [Google Scholar] [CrossRef]
- Van Meijl, H.; Smeets, E.; van Dijk, M.; Powell, J. Macro-Economic Impact Study for Bio-Based Malaysia; LEI Wageningen UR: Den Haag/Leiden, The Netherlands, 2012. [Google Scholar]
- Taheripour, F.; Tyner, W.E. Biofuels and Land Use Change: Applying Recent Evidence to Model Estimates. Appl. Sci. 2013, 3, 14–38. [Google Scholar] [CrossRef] [Green Version]
- Van Meijl, H.; Tsiropoulos, I.; Bartelings, H.; Hoefnagels, R.; Smeets, E.; Tabeau, A.; Faaij, A. On the macro-economic impact of bioenergy and biochemicals—Introducing advanced bioeconomy sectors into an economic modelling framework with a case study for The Netherlands. Biomass Bioenergy 2018, 108, 381–397. [Google Scholar] [CrossRef]
- Stehfest, E.; van Vuuren, D.; Kram, T.; Bouwman, L.; Alkemade, R.; Bakkenes, M.; Biemans, H.; Bouwman, A.; Den Elzen, M.; Janse, J.; et al. Integrated Assessment of Global Environmental Change with IMAGE 3.0. Model Description and Policy Applications; PBL Netherlands Environmental Assessment Agency: The Hague, The Netherlands, 2014. [Google Scholar]
- Van Vliet, O.; van den Broek, M.; Turkenburg, W.; Faaij, A. Combining hybrid cars and synthetic fuels with electricity generation and carbon capture and storage. Energy Policy 2011, 39, 248–268. [Google Scholar] [CrossRef]
- Brouwer, A.S.; van den Broek, M.; Seebregts, A.; Faaij, A. Operational flexibility and economics of power plants in future low-carbon power systems. Appl. Energy 2015, 156, 107–128. [Google Scholar] [CrossRef] [Green Version]
- Corong, E.L.; Hertel, T.W.; McDougall, R.A.; Tsigas, M.; van der Mensbrugghe, D. The Standard GTAP Model, version 7. J. Glob. Econ. Anal. 2017, 2, 1–119. [Google Scholar] [Green Version]
- Aguiar, A.; Narayanan, B.; McDougall, R. An Overview of the GTAP 9 Data Base. J. Glob. Econ. Anal. 2016, 1, 181–208. [Google Scholar] [CrossRef] [Green Version]
- Woltjer, G.; Kuiper, M. (Eds.) The MAGNET Model—Module Description; Report 14-057; LEI Wageningen UR: The Hague, The Netherlands, 2014. [Google Scholar]
- Philippidis, G.; Bartelings, H.; Helming, J.; M’Barek, R.; Ronzon, T.; Smeets, E.; van Meijl, H.; Shutes, L. The MAGNET Model Framework for Assessing Policy Coherence and SDGs: Application to the Bioeconomy; JRC Technical Reports, European Commission; EUR 29188 EN; Publications Office of the European Union: Luxembourg, 2018; ISBN 978-92-79-81792-2. [Google Scholar]
- Schmitz, C.; van Meijl, H.; Kyle, P.; Nelson, G.C.; Fujimori, S.; Gurgel, A.; Havlik, P.; Heyhoe, E.; Mason d’Croz, D.; Popp, A.; et al. Land-use change trajectories up to 2050: Insights from a global agro-economic model comparison. Agric. Econ. 2014, 45, 69–84. [Google Scholar] [CrossRef]
- Boulanger, P.; Philippidis, G. The EU Budget Battle: Assessing the Trade and Welfare Impacts of CAP Budgetary Reform. Food Policy 2015, 51, 119–130. [Google Scholar] [CrossRef]
- Rutten, M.; Shutes, L.; Meijerink, G. Sit down at the ball game: How trade barriers make the world less food secure. Food Policy 2013, 38, 1–10. [Google Scholar] [CrossRef] [Green Version]
- Nelson, G.C.; van der Mensbrugghe, D.; Ahammad, H.; Blanc, E.; Calvin, K.; Hasegawa, T.; Havlik, P.; Heyhoe, E.; Kyle, P.; Lotze-Campen, H.; et al. Agriculture and climate change in global scenarios: Why don’t the models agree? Agric. Econ. 2014, 45, 85–101. [Google Scholar] [CrossRef]
- International Air Transport Association (IATA). IATA Sustainable Aviation Fuel Roadmap. 2015. Available online: https://www.iata.org/whatwedo/environment/Documents/safr-1-2015.pdf (accessed on 14 November 2017).
- EC. EU Reference Scenario 2016. Energy, Transport and GHG Emissions Trends to 2050. Luxembourg Publications Office of the European Union. 2016. Available online: https://ec.europa.eu/energy/sites/ener/ files/documents/20160713%20draft_publication_REF2016_v13.pdf (accessed on 5 April 2017).
- World Bank. World Bank Commodities Prices Pink Sheets. 2017. Available online: http://www.worldbank.org/en/research/commodity-markets#3 (accessed on 5 April 2017).
- Scarlat, N.; Dallemand, J.F.; Monforti-Ferrario, F.; Banja, M.; Motola, V. Renewable energy policy framework and bioenergy contribution in the European Union—An overview from National Renewable Energy Action Plans and Progress Reports. Renew. Sustain. Energy Rev. 2015, 51, 969–985. [Google Scholar] [CrossRef]
- Hellman, F.; Verburg, P.H. Impact assessment of the European biofuel directive on land use and biodiversity. J. Environ. Manag. 2010, 91, 1389–1396. [Google Scholar] [CrossRef] [PubMed]
- Timilsina, G.R.; Beghin, J.; van der Mensbrugghe, D.; Mevel, S. The impacts of biofuels targets on land-use change and food supply: A Global CGE Assessment. Agric. Econ. 2012, 43, 315–332. [Google Scholar] [CrossRef]
- Khanna, M.; Crago, C.L. Measuring indirect land-use change with Biofuels: Implications for Policy. Annu. Rev. Resour. Econ. 2012, 4, 161–184. [Google Scholar] [CrossRef]
- Babcock, B.A. Extensive and Intensive Agricultural Supply Response. Ann. Rev. Resour. Econ. 2015, 7, 333–348. [Google Scholar] [CrossRef]
- EurActiv. Debate on Costs of Advanced Biofuels Heats Up. 2018. Available online: https://www.euractiv.com/section/agriculture-food/news/sr-wed-discussion-about-cost-and-technology-of-advanced-biofuels-heats-up/ (accessed on 16 March 2018).
- Malins, C. Thought for Food—A Review of the Interaction between Biofuel Consumption and Food Markets; Cerulogy: London, UK, 2017. [Google Scholar]
- Araujo-Enciso, S.R.; Fellmann, T.; Pérez-Dominguez, I.; Santini, F. Abolishing biofuel policies: Possible impacts on agricultural price levels, price variability and global food security. Food Policy 2016, 61, 9–26. [Google Scholar] [CrossRef]
Figure 1.
Overview of bi o-based sectors and linkages in MAGNET.

Figure 2.
Impacts on land usage (1000 km2) vs. baseline. (Block capitals denote aggregate activities).
Figure 2.
Impacts on land usage (1000 km2) vs. baseline. (Block capitals denote aggregate activities).


Table 1.
Study disaggregation of commodities and regions.
| Commodity Disaggregation (66 Commodities): |
| Arable and horticulture (9): paddy rice, wheat; other grains; oilseeds; raw sugar; vegetables, fruits and nuts; other crops; plant fibers; crude vegetable oil |
| Livestock and meat (7): cattle and sheep; wool; pigs and poultry; raw milk; cattle meat; other meat; dairy |
| Fertilizer (1): fertilizer |
| Other food and beverages (4): sugar processing; rice processing; vegetable oils and fats; other food and beverages |
| Other ‘traditional’ bio-based (5): fishing; forestry; textiles, wearing apparel and leather products; wood products; paper products and publishing |
| Bio-mass supply (10): energy crops; residue processing; pellets; by-product residues from rice; by-product residues from wheat; by-product residues from other grains; by-product residues from oilseeds; by-product residues from horticulture; by-product residues from other crops; by-product residues from forestry |
| Bio-based liquid energy (5): 1st generation biodiesel; 1st generation bioethanol; 2nd generation thermal technology biofuel; 2nd generation biochemical technology biofuel; bio-kerosene |
| Bio-based industry (4): lignocelluose sugar; biochemical (fermentation) conversion of sugar biomass to polylactic acid chemicals; biochemical (fermentation) conversion of bioethanol to polyethylene chemicals; thermochemical conversion of biomass to chemicals |
| Bio-based and non-bio-based animal feeds (3): 1st generation bioethanol by-product distillers dried grains and solubles (ddgs); crude vegetable oil by-product oilcake; animal feed. |
| Renewable electricity generation (3): bioelectricity; hydroelectric; solar and wind |
| Fossil fuels and other energy markets (10): crude oil; petroleum; gas; gas distribution; coal; coal-fired electricity; gas-fired electricity; nuclear electricity; electricity distribution; kerosene |
| Other sectors (5): chemicals, rubbers and plastics; other manufacturing; aviation; other transport; other services |
| Regional Disaggregation (17 Regions): |
| EU members (12): France (FRA); Germany (GER); Italy (ITA); United Kingdom (UK); Ireland (IRE); Austria (AUT), Spain, Greece, Portugal (Rest of the Mediterranean); Sweden, Finland, Denmark (Scandinavia), Belgium, Netherlands, Luxembourg (BeNeLux), Latvia, Lithuania, Estonia (Baltics); Poland, Czech Republic, Slovakia, Hungary (EU East); Bulgaria, Romania, Croatia, Slovenia, Cyprus, Malta (Rest of EU South) |
| Non EU regions (5): Rest of Europe (RestEurope); North America (NoAmerica); Central and South America (SouandCentAme); African continent (Africa); Asia and Oceania (ROW). |
Table 2.
EU private energy consumption and gross electricity generation output by technology (%).
| EU Residential Energy Intensity | 2011–2015 | 2015–2020 | 2020–2030 |
|---|---|---|---|
| Energy composite | −7.0 | −9.3 | −17.2 |
| Electricity source: | - | - | - |
| Coal | 1.6 | −9.4 | −26.7 |
| Gas | −25.0 | −0.4 | 11.9 |
| Nuclear | −4.3 | −10.9 | 0.6 |
| Hydroelectric | −2.8 | 3.6 | 0.9 |
| Wind and solar | 88.0 | 63.3 | 36.1 |
| Bioelectricity | 33.1 | 4.2 | 44.9 |
Source: [40].
Table 3.
Fossil fuel prices between 2011 and 2030.
| Fuel Type | Units | 2011 | 2015 | 2020 | 2030 |
|---|---|---|---|---|---|
| Coal Australia | $/mt | 94.6 | 69.6 | 55.4 | 60.0 |
| Crude oil, avg, spot | $/bbl | 90.8 | 69.8 | 62.9 | 80.0 |
| Gas ave. | $/mmbtu | 9.1 | 7.4 | 5.7 | 7.7 |
Source: [41] and own assumptions.
Table 4.
Scenario overview, changes compared to baseline (period 2020–2030).
| SCENARIOS | |||||
|---|---|---|---|---|---|
| BASELINE | AB | ETH | POE | NoS | |
| Biofuel blending: | |||||
| Conventional | 7% | 3.8% | As baseline | As baseline | 0% |
| Advanced | 1.5% | 3.6% | As baseline | As baseline | 0% |
| Palm oil imports | no restriction | As baseline | As baseline | EU imports from Asia Eliminated | As baseline |
| EU conventional biofuel sources | Bio-ethanol and bio-diesel | As baseline | Only Bioethanol | As baseline | As baseline |
Table 5.
Fiscal and quantity impacts of biofuels support policy.
| BASELINE | AB | ETH | POE | |
|---|---|---|---|---|
| Subsidy rates (€/L) in 2030 | ||||
| Bioethanol | 0.61 | 0.51 | 1.17 | 0.64 |
| Biodiesel | 0.59 | 0.45 | 0.00 | 0.63 |
| Biochem2G | 3.01 | 3.33 | 3.06 | 3.01 |
| Thermal2G | 3.01 | 3.48 | 3.07 | 3.01 |
| Biokerosene | 4.14 | 4.41 | 4.13 | 4.14 |
| Budgetary costs (€ millions 2011 prices) in 2030 | ||||
| Bioethanol | 388 | 179 | 3852 | 426 |
| Biodiesel | 2560 | 1007 | 0 | 2634 |
| Biochem2G | 3003 | 7943 | 3046 | 3003 |
| Thermal2G | 2938 | 7928 | 2981 | 2939 |
| Biokerosene | 1081 | 1146 | 1078 | 1081 |
| Total | 9970 | 18,203 | 10,957 | 10,083 |
| Liters (millions) in 2030 | ||||
| Bioethanol | 636 | 351 | 3292 | 666 |
| Biodiesel | 4339 | 2238 | 0 | 4181 |
| Biochem2G | 998 | 2385 | 995 | 998 |
| Thermal2G | 976 | 2278 | 971 | 976 |
| Biokerosene | 261 | 260 | 261 | 261 |
| Total | 7210 | 7512 | 5520 | 7082 |
Table 6.
EU28 market impacts in bio-based and energy sectors vs baseline (2020–2030).
| Title | Baseline 2030 1 | Output (%) | Market Prices (%) | ||||||
|---|---|---|---|---|---|---|---|---|---|
| AB | ETH | POE | NoS | AB | ETH | POE | NoS | ||
| Agriculture: | |||||||||
| CEREALS 2 | 61,480 | 0.3 | 1.5 | −0.1 | 0.1 | −0.3 | 0.6 | 0.0 | 0.1 |
| oilseed | 14,754 | −3.8 | −7.3 | 1.6 | −6.7 | −1.4 | −3.1 | 0.7 | −3.2 |
| sugar | 3930 | −1.9 | 23.8 | 0.3 | −4.0 | −0.5 | 8.1 | 0.2 | −2.1 |
| CROPS | 200,888 | −0.4 | 0.5 | 0.1 | −0.3 | −0.1 | 0.1 | 0.1 | −0.5 |
| LIVESTOCK | 169,774 | −0.3 | −0.4 | 0.0 | 0.2 | 0.3 | 0.7 | 0.0 | −0.6 |
| AGRIC | 370,600 | −0.3 | 0.1 | 0.0 | 0.1 | 0.1 | 0.4 | 0.0 | −0.5 |
| Food: | |||||||||
| MEAT | 204,450 | −0.3 | −0.5 | 0.0 | 0.1 | 0.1 | 0.3 | 0.0 | −0.2 |
| DAIRY | 207,914 | −0.2 | −0.3 | 0.0 | 0.2 | 0.1 | 0.4 | 0.0 | −0.4 |
| FOOD | 1,067,203 | −0.2 | −0.3 | 0.0 | 0.1 | 0.0 | 0.0 | 0.0 | −0.3 |
| Other biomass sources: | |||||||||
| energy crop | 288 | 6.1 | −0.4 | −0.0 | −15.6 | 5.1 | 0.0 | 0.0 | −9.0 |
| residue | 13,588 | 23.3 | 0.2 | −0.0 | −46.8 | 3.5 | −0.1 | 0.0 | −4.5 |
| pellet | 419 | 63.5 | 0.3 | 0.0 | −54.5 | 1.7 | −0.1 | 0.0 | −2.5 |
| BIOMASS | 14,182 | 24.5 | 0.2 | −0.0 | −46.2 | 3.5 | −0.1 | 0.0 | −4.6 |
| crude veg oil | 15,511 | −8.9 | −17.7 | 4.6 | −16.9 | −2.3 | −5.0 | 1.1 | −5.3 |
| Bio-industry: | |||||||||
| ligno Sugar | 10 | −14.6 | 8.0 | 0.3 | 26.1 | 2.0 | −0.1 | 0.0 | −2.6 |
| polyethylene | 9 | −1.0 | −6.6 | −0.1 | 8.5 | −2.0 | 5.6 | 0.3 | −8.8 |
| polylactic acid | 125 | −0.3 | −1.5 | 0.0 | 4.7 | 0.1 | 0.2 | 0.0 | −0.2 |
| thermochem2G | 11 | −3.9 | −5.1 | 0.0 | 0.5 | 0.0 | 0.0 | 0.0 | 0.0 |
| Biofuels and co-products: | |||||||||
| bioethanol 1G | 766 | −44.8 | 420.1 | 5.5 | −93.6 | −4.6 | 15.1 | 0.6 | −18.2 |
| biodiesel 1G | 4657 | −48.7 | −99.6 | −3.4 | −96.7 | −1.9 | −4.1 | 2.0 | −4.2 |
| BF1G | 5426 | −46.2 | −29.4 | −2.3 | −95.0 | −2.2 | −1.5 | 1.9 | −6.1 |
| thermal2G | 3121 | 138.7 | −0.3 | −0.0 | −99.7 | 2.3 | −0.1 | 0.0 | −2.9 |
| biochem2G | 3199 | 133.1 | −0.6 | −0.0 | −99.7 | 2.6 | −0.1 | 0.0 | −3.2 |
| BF2G | 6298 | 136.7 | −0.1 | −0.0 | −99.7 | 2.5 | −0.1 | 0.0 | −3.0 |
| bkerosene | 960 | −0.5 | −0.1 | −0.0 | −98.5 | 3.6 | −0.1 | 0.0 | −4.6 |
| ddgs | 184 | −30.4 | 401.8 | 5.4 | −69.8 | 20.7 | −52.8 | −2.8 | 83.7 |
| oilcake | 6067 | −8.3 | −16.7 | 4.4 | −15.9 | 4.3 | 9.0 | −1.9 | 9.3 |
| FEED | 6251 | −8.7 | −6.3 | 4.4 | −16.8 | 4.8 | 6.9 | −2.0 | 11.8 |
| Fossil fuels: | |||||||||
| coal | 24,224 | 0.3 | 0.0 | 0.0 | 2.3 | 0.1 | 0.0 | 0.0 | 0.9 |
| oil | 108,058 | 0.0 | 0.1 | 0.0 | 0.3 | −0.1 | 0.1 | 0.0 | 0.4 |
| gas | 33,799 | 0.0 | 0.0 | 0.0 | 0.1 | 0.1 | 0.0 | 0.0 | 0.4 |
| petroleum | 602,394 | 0.0 | −0.0 | −0.0 | 0.0 | 0.0 | 0.1 | 0.0 | 0.3 |
| Electricity generation: | |||||||||
| coal-fired | 48,473 | 0.7 | 0.0 | 0.0 | 3.6 | 0.0 | 0.0 | 0.0 | 0.2 |
| gas-fired | 59,126 | 0.9 | −0.1 | 0.0 | 2.7 | 0.0 | 0.0 | 0.0 | 0.1 |
| nuclear | 61,970 | 0.0 | 0.0 | 0.0 | 0.0 | 0.2 | 0.0 | 0.0 | 0.9 |
| hydroelectric | 25,168 | 0.0 | 0.0 | 0.0 | 0.0 | 0.1 | 0.0 | 0.0 | 1.0 |
| wind/solar | 107,345 | 0.7 | 0.2 | 0.0 | 4.3 | 0.0 | 0.0 | 0.0 | −0.1 |
| bioelectric | 17,138 | −7.1 | 0.3 | −0.0 | −26.8 | 2.0 | −0.1 | 0.0 | −2.8 |
1 Base 2030 values in € millions, 2011 constant prices. 2 Block capitals denote aggregate activities.
Table 7.
EU Trade volumes in constant prices (2011, €millions).
| Intra-EU Trade (€ millions 2011 Constant Prices) | Extra-EU Trade (€ Millions 2011 Constant Prices) | ||||||||||
|---|---|---|---|---|---|---|---|---|---|---|---|
| Baseline | Intra-EU Trade vs. Baseline | Baseline | Baseline | Extra-EU Trade Balance vs. Baseline | |||||||
| Trade 2030 | AB | ETH | POE | NoS | Exports 2030 | Imports 2030 | AB | ETH | POE | NoS | |
| Traditional crop feedstocks, lignocellulose biomass, processed intermediates and biomass by-products: | |||||||||||
| CEREALS | 12,263 | 14 | 285 | −6 | −16 | 9410 | 4437 | 43 | −196 | −1 | −23 |
| oilseed | 4825 | −242 | −466 | 97 | −435 | 731 | 8646 | 701 | 1422 | −409 | 1388 |
| Sugar beet | 72 | −1 | 7 | 0 | −2 | 4 | 12 | 72 | −505 | −22 | 283 |
| pellet | 392 | 262 | 1 | 0 | −209 | 12 | 141 | −250 | 9 | 0 | 353 |
| crude veg oil | 5593 | −480 | −967 | 560 | −931 | 1156 | 3337 | 509 | 1000 | 732 | 1006 |
| feed by-prod | 1791 | −219 | −426 | 109 | −417 | 519 | 3652 | −220 | −416 | 113 | −503 |
| Bioenergy: | |||||||||||
| bioethanol 1G | 11 | −4 | 33 | 0 | −10 | 61 | 193 | 114 | −1656 | −13 | 278 |
| biodiesel 1G | 250 | −115 | −250 | −9 | −249 | 74 | 729 | 370 | 762 | −15 | 755 |
| BF1G | 261 | −119 | −217 | −9 | −259 | 135 | 921 | 484 | −893 | −28 | 1033 |
| thermal2G | 19 | 26 | 0 | 0 | −19 | 3 | 213 | −612 | −17 | −1 | 635 |
| biochem2G | 20 | 26 | 0 | 0 | −20 | 3 | 227 | −621 | −16 | 0 | 655 |
| BF2G | 39 | 52 | 0 | 0 | −39 | 6 | 440 | −1233 | −33 | −1 | 1290 |
| bkerosene | 10 | 0 | 0 | 0 | −10 | 2 | 53 | −554 | 28 | −1 | 1102 |
| Other energies: | |||||||||||
| Coal | 1066 | 2 | 5 | 0 | 3 | 123 | 14,791 | −96 | −59 | 0 | −419 |
| Crude oil | 15,649 | 89 | 88 | 0 | 61 | 2643 | 353,882 | 148 | −1677 | 3 | −5133 |
| Gas | 10,842 | 25 | 0 | 0 | 20 | 1904 | 80,737 | −113 | −266 | 1 | −564 |
| Petroleum | 98,163 | 84 | 91 | −11 | 116 | 76,851 | 120,587 | 2 | −30 | 8 | −459 |
| electricity | 27,474 | −26 | 13 | 0 | −107 | 19,750 | 5807 | −16 | 3 | 0 | −109 |
Notes: Block capitals denote aggregate activities.
© 2018 by the authors. Licensee MDPI, Basel, Switzerland. This article is an open access article distributed under the terms and conditions of the Creative Commons Attribution (CC BY) license (http://creativecommons.org/licenses/by/4.0/).
Share and Cite
MDPI and ACS Style
Philippidis, G.; Bartelings, H.; Helming, J.; M’barek, R.; Smeets, E.; Van Meijl, H. The Good, the Bad and the Uncertain: Bioenergy Use in the European Union. Energies 2018, 11, 2703. https://doi.org/10.3390/en11102703
AMA Style
Philippidis G, Bartelings H, Helming J, M’barek R, Smeets E, Van Meijl H. The Good, the Bad and the Uncertain: Bioenergy Use in the European Union. Energies. 2018; 11(10):2703. https://doi.org/10.3390/en11102703
Chicago/Turabian StylePhilippidis, George, Heleen Bartelings, John Helming, Robert M’barek, Edward Smeets, and Hans Van Meijl. 2018. "The Good, the Bad and the Uncertain: Bioenergy Use in the European Union" Energies 11, no. 10: 2703. https://doi.org/10.3390/en11102703
Note that from the first issue of 2016, this journal uses article numbers instead of page numbers. See further details here.