Modeling the Effect of Nutritional Strategies for Dairy Cows on the Composition of Excreta Nitrogen
 Jan Dijkstra
 André Bannink
 Pieter M. Bosma1†
  Egbert A. Lantinga
 Joan W. Reijs
- 1Animal Nutrition Group, Wageningen University & Research, Wageningen, Netherlands
- 2Wageningen Livestock Research, Wageningen University & Research, Wageningen, Netherlands
- 3Farming Systems Ecology, Wageningen University & Research, Wageningen, Netherlands
- 4Department of Animal Sciences, Wageningen University & Research, Wageningen, Netherlands
For an integrated evaluation of the effect of nutritional strategies on the utilization and losses of N at dairy farms, reliable estimates of excreta production and composition are indispensable. An extant, dynamic, mechanistic model of rumen functioning was extended with static equations that describe intestinal digestion to simulate the composition of dairy cow feces and urine as a function of diet composition. The extended model predicts organic matter (OM), carbon (C), and nitrogen (N) output of both feces and urine, classified in different components. Total N excretion was partitioned in three fractions based on the C:N ratio of individual components representing their availability of N following manure application to crops, viz. NM (immediately available), NE (easily decomposable), and NR (resistant). Forty nutritional strategies for stall-fed dairy cows, covering diets with a wide range in protein content and OM digestibility, were evaluated. The simulated ranges in fecal and urinary composition were largely in line with values reported in literature. Diet intake and composition had a substantial effect on simulated total N excretion and excreta composition, mainly because of differences in the level of NM excretion and the C:N ratio of the NR fraction. Furthermore, it was shown that the type of OM excreted varies considerably between different diets. A simplified simulation of degradation processes during the first 4 months of excreta storage produced average values and ranges of slurry characteristics that were in line with values reported in literature. The simulated variation in slurry characteristics suggested a strong variability in ammonia N losses from the slurry pit and a moderate variability in plant availability of slurry N. Further efforts are required to integrate effects of manure storage conditions on the storage processes. In conclusion, the model can be a tool to predict fecal and urinary composition of cattle, and ultimately to improve the utilization of N from field applied manure as well as to evaluate the effects of different nutritional strategies on the whole-farm N balance.
Introduction
Dairy production contributes to environmental pollution from fecal and urinary N as ammonia and nitrous oxides in air and as nitrate, ammonium, and organic N in ground and surface water. Nutrition management is an important tool to reduce this environmental pollution in forage based cattle systems (Misselbrook et al., 2013). The total amount of N excreted in manure can be significantly reduced by lowering the dietary protein content (e.g., Kebreab et al., 2002; Powell and Rotz, 2015). As excessive feed N is mainly excreted with urine, a reduction of the dietary protein content will generally result in a more than proportional reduction of the urinary N excretion (Dijkstra et al., 2013; Powell and Rotz, 2015). Urinary N is more susceptible to losses than fecal N (Selbie et al., 2015). Reductions in dietary protein thus result in significant reductions of gaseous N emissions (e.g., Külling et al., 2001; Misselbrook et al., 2005; Bougouin et al., 2016). However, N utilization and excretion is not exclusively determined by the level of protein in the diet. For example, the output of N in milk of dairy cattle fed diets with similar protein levels depends on dietary carbohydrate composition, with decreased milk N output of high fiber compared with high starch diets (diets iso-energetic) (Cantalapiedra-Hijar et al., 2014). Thus, to minimize N excretion and maximize N utilization at the cow level, a proper balance of energy and N supply to the rumen (Dijkstra et al., 1998) and to splanchnic tissues and mammary gland (Lapierre et al., 2010) is required. Indeed, Kebreab et al. (2010) performed multi-variate analysis on fecal, urinary, and milk N excretion in dairy cattle, and reported that addition of diet metabolizability (the concentration of metabolizable energy relative to gross energy of the diet) as a covariate with N intake improved the predictions of N excretion.
Several nutritional-related strategies that may improve N utilization and reduce manure N excretion in dairy cattle have been proposed. These strategies include reduction of the N fertilization level (e.g., Peyraud and Astigarraga, 1998; Warner et al., 2016), later cut of grass (e.g., Brask et al., 2013), using low protein, high energy feeds like maize silage (e.g., Van Gastelen et al., 2015) and adjustment of concentrate composition (e.g., Børsting et al., 2003). However, nutrition not only affects the utilization of N by the cow, but also the composition of the excreta and therefore it interacts with the major part of the processes at the farm level where N is converted and lost. Changes in diet composition affect utilization of N from soil-applied dairy cow slurry (e.g., Sørensen et al., 2003; Reijs et al., 2007; Jost et al., 2013). For this reason, the evaluation of nutritional strategies should go beyond the cow level. For an integrated and profound evaluation of the effect of nutritional strategies on N utilization at farm level, qualification and quantification of excreta composition is a crucial step. Such an evaluation requires a realistic and detailed representation of the cow's complex digestive processes. Several empirical models have been developed to predict output and composition of feces and urine (e.g., Reed et al., 2014; Appuhamy et al., 2018), but such models do not allow for detailed manure characterization and do not reflect the availability of N from urinary and fecal components for subsequent losses or use by plants.
The main objective of this study is to present a model that is capable of evaluating the impact of nutritional strategies on N utilization at the farm level, based on understanding of the complex digestion processes occurring at the cow level. For this purpose, an existing dynamic, mechanistic model of rumen function and subsequent nutrient availability (Dijkstra et al., 1992, 1996) was extended with static equations that describe intestinal digestion. The extended model predicts organic matter (OM), carbon (C), and N output in different fecal and urinary components as a function of diet composition. To illustrate the applicability of the model, excreta composition was simulated for 40 nutritional strategies of stall-fed dairy cows in grass silage based systems, covering a wide range in OM digestibility and dietary protein content. In addition, degradation processes during the first 4 months of excreta storage were simulated in a simplified way to quantify the effect of the nutritional strategies on the composition of field-applied slurry. Based on the simulations, the applicability of the model, the potential variation in excreta composition and its consequences for the composition, utilization, and losses of slurry N during storage are evaluated.
Materials and Methods
General Structure of the Model
A schematic representation of the model is shown in Figure 1 and the principal symbols used are listed in Table 1. The dynamic and mechanistic model of rumen microbial fermentation processes of Dijkstra et al. (1992) was used to predict the outflow of undigested feed and microbial material from the rumen to the intestines (g day−1) as a function of the chemical composition and rumen degradation characteristics (based on in situ nylon bag incubations) of ingested feedstuffs and of the microbial activity. To obtain quantitative data on fecal composition, the rumen model was expanded with equations that describe the digestion of these rumen outflow components in the small and large intestine, described in detail in a subsequent section.
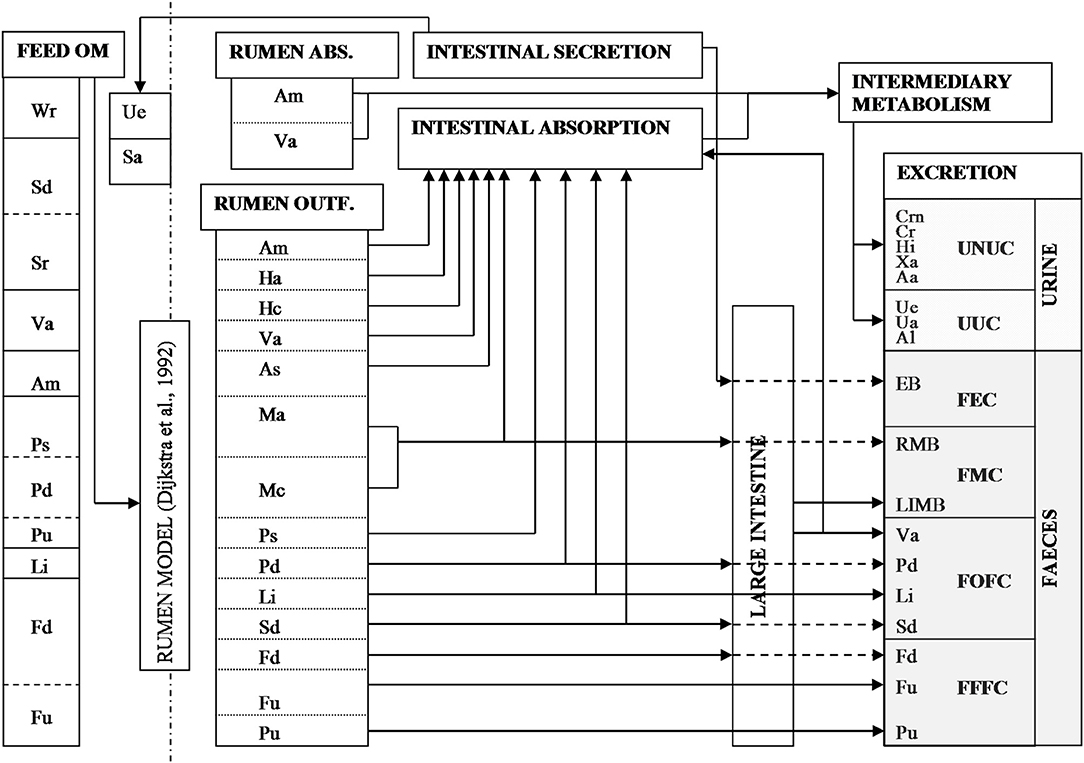
Figure 1. Schematic representation of the model. Abbreviations are explained in Table 1. Rumen outflow is predicted by the model of Dijkstra et al. (1992). The arrows represent static equations that describe the fluxes (g day−1) of different components through the digestive tract.
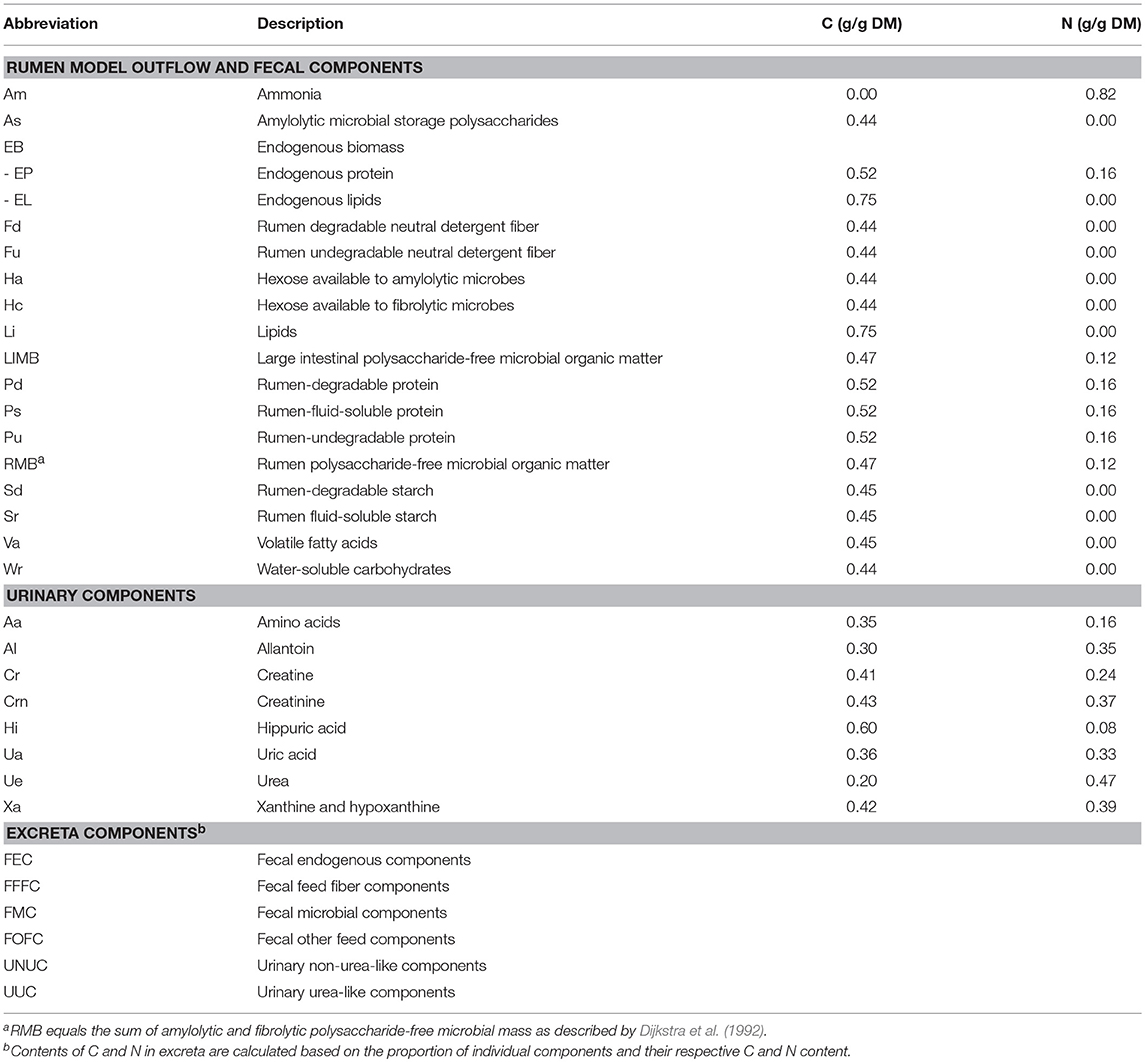
Table 1. Abbreviations used in the model and carbon (C) and nitrogen (N) contents (in dry matter, DM) of components.
In the model, fecal excretion consists of 10 different components that are aggregated into four different categories (Figure 1), viz. fecal endogenous components (FEC), fecal microbial components (FMC), fecal feed fiber components (FFFC) and fecal other feed components (FOFC). The C and N contents for the different components adopted are given in Table 1. A fixed milk composition of 40 g kg−1 fat, 33 g kg−1 protein, and 46 g kg−1 lactose was presumed. Potential milk productions based on total absorbed energy and on available nutrients (lipogenic, glucogenic, and aminogenic) were simulated as described in detail by Dijkstra et al. (1996). The lowest of these four values was taken as the actual simulated milk production. Excretion of urinary N (g day−1) was calculated by assuming zero N retention in the body according to:
If required, for growing cows or cows in late lactation, a positive N retention may be adopted. In line with Bussink and Oenema (1998), Nurine was divided into urea-like urinary components (UUC) and non-urea-like components (UNUC, Figure 1). Urea N was calculated as the difference of Nurine minus the sum of N in other urinary constituents described in another section.
Intestinal Digestion and Fecal Excretion
Rumen undegradable fiber (Fu) and rumen undegradable protein (Pu) were assumed to be also indigestible in the intestines and completely excreted with the feces (Tamminga et al., 1994). Rumen degradable fiber (Fd) not digested in the rumen was assumed to be indigestible in the small intestine (SI). In the large intestine (LI) the digestion coefficient of Fd was based on the retention time of the material according to:
where digFdLI is the fraction of Fd outflow from the SI digested in the LI, kdFdrumen is the fractional degradation rate of ingested Fd in the rumen (% h−1, Table 2) and kpLI (% h−1) is the fractional passage rate in the LI, estimated according to Mills et al. (2001):
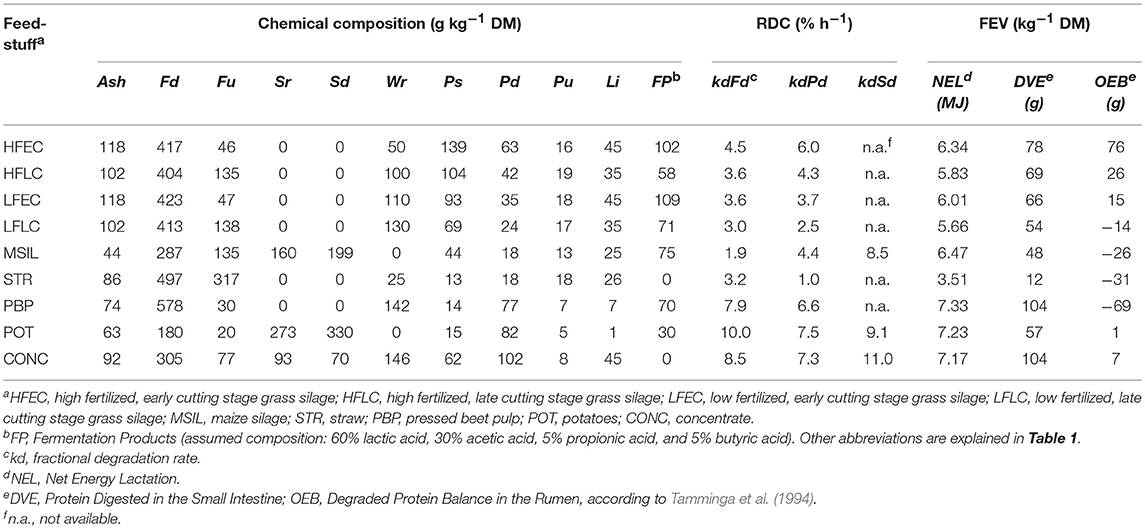
Table 2. Chemical composition, rumen degradation characteristics (RDC), and feed evaluation values (FEV) of the feedstuffs used.
where DMI is Dry Matter Intake in kg day−1. The fraction of rumen degradable starch (Sd) washed out from the rumen and digested in the SI (digSdSI) was related to the fraction of starch escaping rumen fermentation, according to Nocek and Tamminga (1991):
where RES is the total outflow of starch from the rumen, including microbial storage polysaccharides (As), as a fraction of total starch intake. The fraction of starch outflow from the SI and digested in the LI (digSdLI) was estimated according to:
where kdSdrumen is the fractional degradation rate of ingested Sd (% h−1) in the rumen.
Microbial starch is assumed to be completely digested in the SI. Polysaccharide-free microbial OM in the rumen (RMB) was assumed to consist of protein (61%), nucleic acids (18%), lipid (16%), and cell walls (5%), based on Dijkstra et al. (1992). No distinction was made in the digestibility of N in the different components of RMB (protein, nucleic acids and cell walls) and the digestion of all N contained in the RMB was set at a constant value of 0.81 (Storm et al., 1983). Storm et al. (1983) observed an OM digestibility in the SI of 0.74 for the total microbial matter, including microbial polysaccharides. As microbial polysaccharides are highly digestible, this digestion coefficient was adjusted to 0.67 for RMB as RMB is defined as polysaccharide-free microbial matter.
Excreted endogenous biomass (EB) was divided into protein (EP; digestive enzymes, desquamated epithelial cells, mucus) and lipids (EL; bile salts). Excretion of EP was based on a net loss of metabolic protein of 50 g kg−1 ingested indigestible DM (Tamminga et al., 1994). Endogenous lipid excretion was estimated to be 24 g day−1 (Børsting et al., 1992). The SI digestibility of rumen digestible feed protein (Pd) was set at 0.75 and that of feed, microbial and endogenous lipid at 0.90 (Palmquist et al., 1993). Net lipid digestion in the LI was assumed to be zero, following observations of Drochner and Meyer (1991). The digestibility of feed protein and microbial OM in the LI was assumed to be constant at 10% of the outflow from the SI. The digestibility of endogenous protein was set at a significantly higher value of 40%, assuming that the endogenous protein is more easily fermented as it has not been subject to the digestive processes for the full length of the SI (Van Soest, 1994). The amount of fermentable OM in the LI (FOMLI) in g day−1 was calculated based on the differences in components flows (Pd, digestible feed protein; EP, endogenous protein; RMB, rumen microbial biomass; Fd, rumen degradable fiber; Sd, rumen degradable starch) into the duodenum (duodoutfl) and in manure (manure) according to:
The assumption was made that protein provides 0.55 of pyruvate units per mol fermented substrate compared to hexose (Bannink et al., 2006). Production of volatile fatty acids (Va) in the LI was assumed to be 0.70 g per g of FOMLI (DeMeyer and De Graeve, 1991). Assuming that the Va absorption rate (μmol cm2 min−1) of the LI is similar to that of the rumen (Ding et al., 1998), it was estimated that 75% of the produced Va was absorbed. The production of microbial N in the LI was estimated at 24 g kg−1 FOM, i.e., equal to that in the rumen (Tamminga et al., 1994). Based on values in Table 1, this implies a production of 178 g of large intestinal polysaccharide-free microbial OM per kg FOMLI.
Urinary N Constituents Other Than Urea
In general, urine of dairy cows contains only traces of free amino acids. Based on data of Bristow et al. (1992) it was assumed that only 2% of the urinary N consists of free amino acids (Aa). Hippuric acid (Hi) in ruminant urine is mainly a derivative of rumen microbial fermentation of phenolic cinnamic acids (Martin, 1982) and it has been shown that its relative contribution to the total N excreted may vary (Dijkstra et al., 2013). However, quantitative data on the effect of diet composition on Hi excretion are scarce and therefore an average contribution of 5% to total urinary N excretion (Bristow et al., 1992) was assumed for Hi. Urinary creatinine (Crn) excretion is a relatively constant function of body weight (BW) and set at 29 mg kg−1 BW day−1 (Valadares et al., 1999). Assuming a BW of 625 kg, this corresponds with a Crn-N excretion of 6.5 g day−1. Creatine (Cr) N excretion was estimated at 4.8 g day−1 based on the ratio between Crn and Cr observed by Bristow et al. (1992). Xanthine plus hypoxanthine (Xa) excretion is relatively small and was taken as 0.5% of total urinary N excretion (Bristow et al., 1992). The excretion of purine derivatives (allantoin, xanthine, hypoxanthine and uric acid) has consistently been related to microbial synthesis in the rumen (Valadares et al., 1999). In our model, the relationship reported by Susmel et al. (1993) was used to predict the total excretion of urinary purine derivatives:
where UPD and RMP are the amounts of excreted urinary purine derivatives and rumen microbial protein outflow, respectively, in mg day−1 kg−1 BW0.75. After subtraction of Xa, the remaining UPD was divided into allantoin (Al) and uric acid (Ua), using a ratio of 85:15 (Bristow et al., 1992; Valadares et al., 1999).
From Excreta to Slurry Composition
The most common system in the Netherlands is to store feces and urine in a mixed slurry system for a period of ~4 months in the slurry pit. During this storage period the excreta and added bedding material with a relatively high C:N ratio are subject to both anaerobic and aerobic fermentation processes, affecting their composition. Manure OM is degraded (Whitehead and Raistick, 1993), manure C is lost (Sørensen, 1998), urea-N and part of the organic N in manure are transformed into NH-N (Whitehead and Raistick, 1993; Sørensen et al., 2003) and N losses occur through gaseous emissions (Misselbrook et al., 2005). To quantify the effect of these processes on the final slurry composition after storage, it was assumed that all N in UUC was converted into NH-N. Based on results of Sørensen et al. (2003), the transformation of the (other) organic N into NH-N was assumed to be negatively related to the fiber content of the diet according to:
where MINorganicN is the fraction (%) of organic N (total excreted N–UUC N) that is mineralized and transformed into NH-N during storage.
As no quantitative data were found to differentiate C loss for diet or slurry characteristics, the C loss during storage was set at 13% of total C as found by Sørensen (1998) after 20 weeks at a temperature of 15°C; a change in ambient temperature would change this fractional loss. The fraction of slurry OM loss was assumed to be equal to the C loss, as Kirchmann and Witter (1992) found no marked difference between OM and C loss. From the results of Külling et al. (2001), it was concluded that nitrous oxide emissions are negligible in slurry based systems compared to N losses as ammonia. Total ammonia N losses in the storage period include both emissions from the stable floor and the storage pit, and were estimated to be 22% of the urea-N (Van Duinkerken et al., 2003). The use of bedding material was set at 1 kg of sawdust (C:N ratio of 450) per cow per day.
Nutritional Strategies
Forty different nutritional strategies, all based on stall-fed situations, were explored with the model. The various strategies included several types of grass silage (high or low fertlization level of grass and early or late cutting of grass before ensiling), type of grass silage replacement (replacement with maize silage or various by-products), and the level of concentrate feeding (Table 3). High (HF) or low (LF) level of inorganic N fertilization, combined with an early (EC) or late (LC) cutting stage were considered to give four different spring cut silages, viz. HFEC, HFLC, LFEC, LFLC. The assumed chemical composition and rumen degradation characteristics of these silages are shown in Table 2. It was assumed that grass was fertilized before the first cut with dairy slurry (25 ton ha−1) in combination with a high (100 kg N ha−1) and a low level (50 kg N ha−1) of inorganic fertilizer. A reduction of the fertilization level was expected to result in a decrease of the crude protein level (Heeren et al., 2014) and an increase in the content of water soluble carbohydrates (Wr) (Peyraud and Astigarraga, 1998). Later cutting (from 3,000 to 4,500 kg DM ha−1) was expected to increase the neutral detergent fiber (NDF) content and to decrease the crude ash content (Bosch et al., 1992; Heeren et al., 2014). Rumen protein degradation characteristics were estimated by regression formulae from Tamminga et al. (1991). For the EC silages, the rumen undegradable NDF fraction (Fu) was estimated at 10% of total NDF (Bosch et al., 1992; Bruinenberg et al., 2004). Bosch et al. (1992) and Heeren et al. (2014) showed that with increasing NDF contents, Fu (both absolute and as a fraction of total NDF) increases and the fractional degradation rate of rumen-degradable fiber (kdFd) decreases. The Fu fraction of the LC silages was set at 25% of total NDF, being the average value of two silages with similar NDF contents used by Bosch et al. (1992) and Bruinenberg et al. (2004). The fractional degradation rate of the LC silages was set at 65% of that of the EC silages based on the observed differences in kdFd between grass silages with high and low NDF contents in both experiments (Bosch et al., 1992; Bruinenberg et al., 2004).
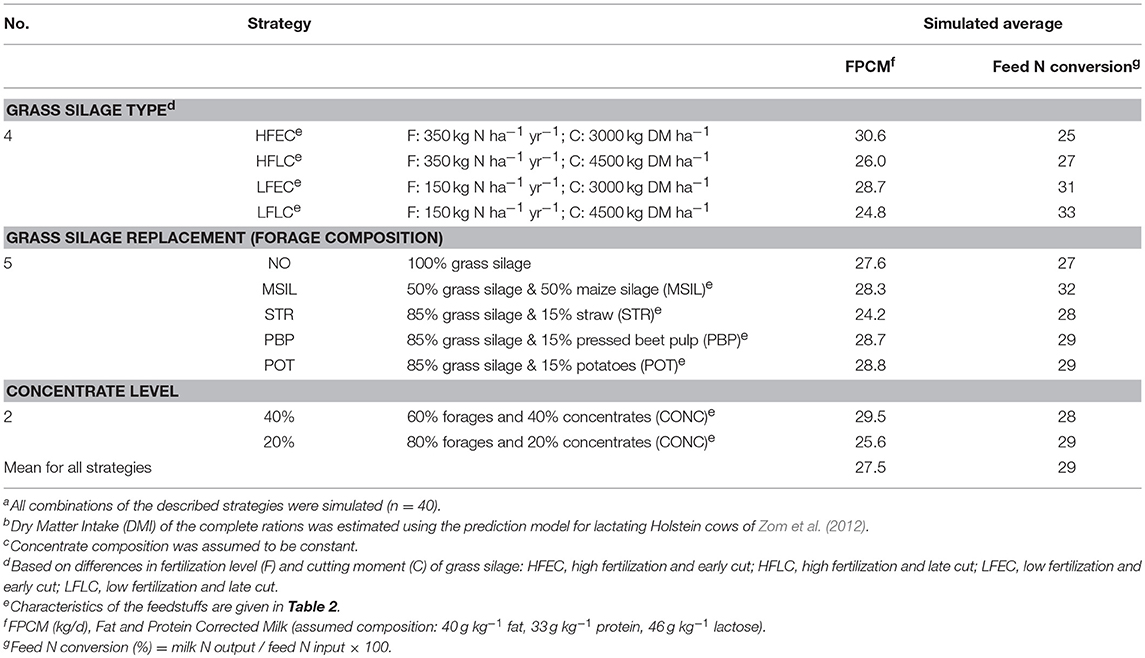
Table 3. Description of selected nutritional strategiesa, b, c and simulated average milk production and feed nitrogen (N) conversion.
The composition of concentrate feed was based on an arbitrarily chosen widely used concentrate feed produced by a Dutch company. Chemical composition of the concentrate ingredients, straw (STR) and industrial by-products (pressed beet pulp, PBP; potatoes, POT) were based on Dutch standards (Anonymous, 2011). Chemical composition of the maize silage (MSIL) was taken as the Dutch average for 2004-2009. Rumen degradation characteristics were estimated from reports on in-sacco experiments for concentrate ingredients (Tamminga et al., 1990; Van Straalen, 1995), MSIL (Klop and De Visser, 1994), STR (Oosting, 1993; Sinclair et al., 1993), PBP (Tamminga et al., 1990; De Visser et al., 1991; DePeters et al., 1997), and POT (Van Straalen, 1995; Offner et al., 2003) (Table 2).
The required input for the rumen fermentation model was completed as described below. Dry matter intake of the complete rations was estimated using the prediction model for lactating Holstein cows of Zom et al. (2012) for a reference cow of 625 kg BW, third parity, mid-lactation (180 d in milk), and 90 d pregnant. Rumen fractional passage rates for fluid (kpf) and solid particles (kps) in % h−1, were calculated according to Van Straalen (1995):
where DMI is dry matter intake in kg day−1 and pR is the fraction of roughage in the diet. Rumen digesta volume (RV; liter) was estimated as:
(adapted from Mills et al. 2001)
The average rumen pH (pH) was set at 6.1 for diets with 100% LC grass silages and a high concentrate level based on Abrahamse et al. (2008). For the other strategies the following adjustments for pH were made based on amount and potential degradability of carbohydrate components: low concentrate level: +0.3, EC silages: −0.1, MSIL: −0.05, STR: +0.1, PBP: −0.1, POT: −0.05. The minimum daily pH (PM) and the time below a critical pH for reduced fiber digestion (TF in h/24 h) were calculated as:
Results
Ranges in Simulated Excreta Composition
Simulated intake, dietary characteristics, and digestion coefficients showed large variation between nutritional strategies (Table 4). Obviously, this variation resulted in differences between nutritional strategies in energy and nutrient availability for milk production. Simulated FPCM production ranged from 19.1 to 33.8 kg day−1, whereas simulated total excretion of OM varied between 3.7 and 6.3 kg day−1 (Table 5), because of a range in apparent OM digestibility from 70 to 82% and range in DMI from16.0 to 22.4 kg/d (Table 4).
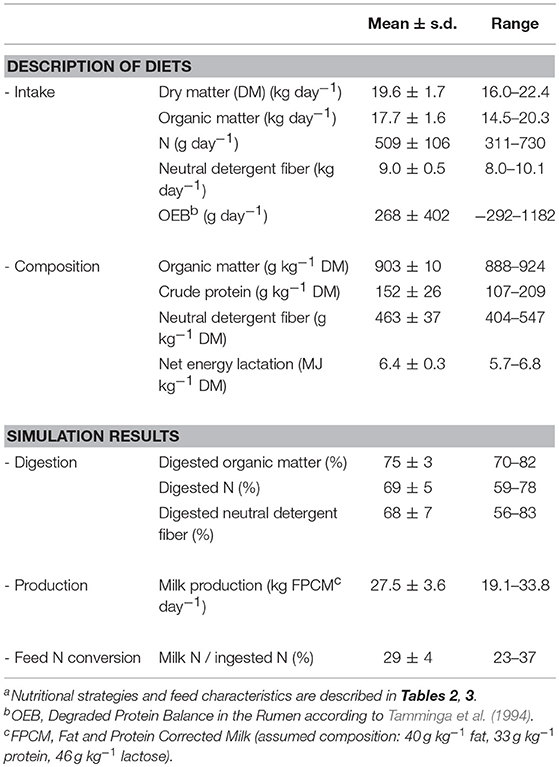
Table 4. Mean values and ranges of intake, diet composition, simulated digestion coefficients, simulated milk production and simulated feed nitrogen (N) conversion of 40 nutritional strategiesa for dairy cows.
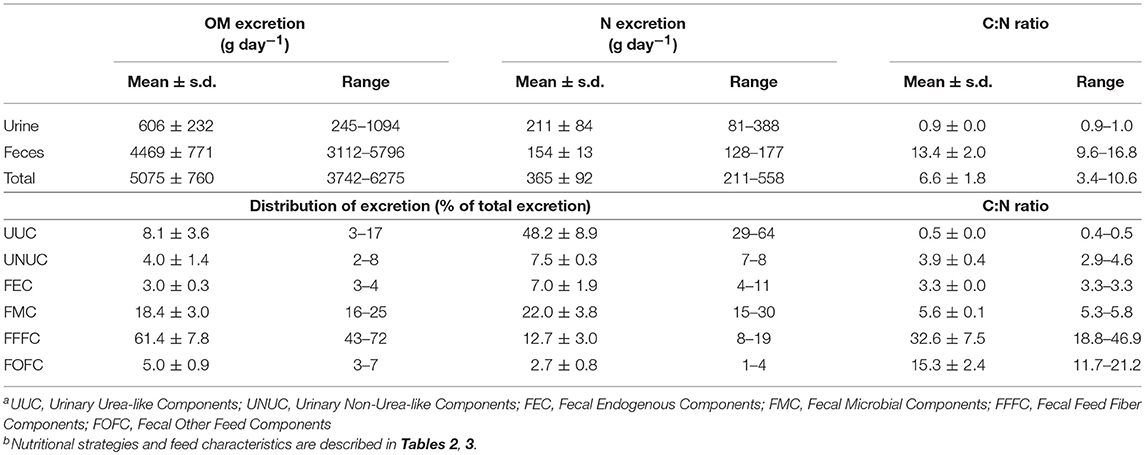
Table 5. Mean values and ranges of simulated fecal and urinary organic matter (OM) and nitrogen (N) excretion, distribution of excretion between different componentsa and carbon to nitrogen (C:N) ratio of components for 40 nutritional strategiesb for dairy cows.
Simulated fecal and urinary OM excretion showed considerable variation (Table 5). Total N excretion ranged from 211 to 558 g N day−1. The simulated C:N ratio of the total excreta was highly variable (3.4–10.6). Simulated fecal N excretion was relatively constant (128–177 g N day−1) and the fecal C:N ratio was quite variable (9.6–16.8), while urinary N excretion showed a large variation (81–388 g N day−1) and urinary C:N ratio was almost constant. The major part (on average 61.4%) of the OM in manure was excreted as FFFC, while the largest part (on average 48.2%) of the N excretion was covered by UUC. The undigested feed components (FFFC and FOFC) showed a considerable range in C:N ratio, whereas the C:N ratio of the other components (UUC, UNUC, FEC, and FMC) was much less variable. The distribution of fecal N excretion over the different components showed only a small variation: FFFC (28 ± 2%), FOFC (6 ± 2%), FMC (50 ± 2%), and FEC (16 ± 1%). The simulated fraction of urinary N excreted with UNUC ranged between 10 and 22%.
Based on their C:N ratio, the excreta components were divided into three different fractions representing their availability of N following manure application to crops (NM, NE, and NR; Sluijsmans and Kolenbrander, 1977) (Table 6). The immediately available fraction (NM) is represented by UUC with a C:N ratio < 1. On average, 48% of the excreted N was present in this fraction, ranging from 29 to 64%. The easily decomposable fraction (NE) consists of all manure components with a C:N ratio between 2 and 6, being UNUC, FEC and FMC, and covered on average 37% (range 27–49%) of the excreted N. The resistant N fraction (NR) comprises the undigested feed components FOFC and FFFC, with a high but variable C:N ratio (range 12–47). This fraction averaged 15% (range 10–22%) of the total excreted N.
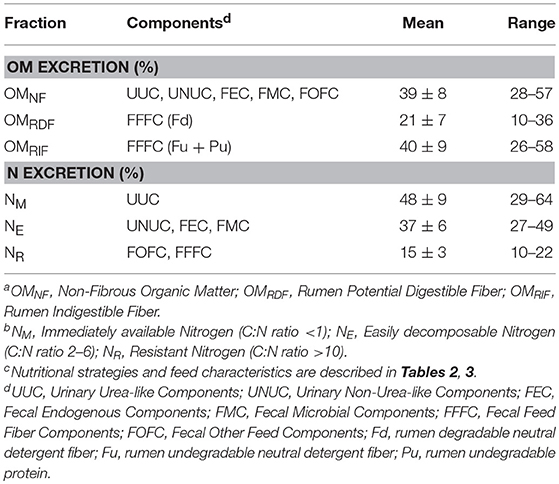
Table 6. Proportional composition (%) of organic matter (OM)a and nitrogen (N)b in dairy cow excreta after simulation of 40 nutritional strategiesc.
The OM excretion was divided into fiber (FFFC) and non-fiber (OMNF) components (Table 6). Within the fiber components, a distinction was made between rumen potentially digestible (OMRDF) and rumen indigestible fiber (OMRIF) as this distinction might reflect differences in the degradability of manure OM during storage and after application to soil. On average, 39% of the OM was excreted with the non-fiber fraction but with a considerable range (28 to 57%). The OMRDF fraction was on average 21% of total OM excretion (range: 10–36%), and the OMRIF fraction was on average 40% of total OM excretion (range: 26–58%).
Effects of Nutritional Strategies on Excreta Composition and Milk Output
The variation in total N excretion is mainly reflected in the NM fraction (Figure 2). The simulation results showed a strong decrease of NM excretion and an increase in feed N to milk N conversion efficiency when N fertilization is reduced from a high (HF) to a low (LF) level, whereas simulated milk output reduced slightly (Table 3). An extended growing period of the silage grass (EC vs. LC) decreased NM excretion and improved N conversion efficiency even further (Figure 2) but at the expense of a larger reduction in milk output. The inclusion of maize silage in the diet strongly reduced simulated NM excretion and had a positive effect on milk output, inducing a large increase in the conversion efficiency of feed N into milk N (Table 3). The inclusion of 15% straw in the diet markedly reduced DMI and N intake, resulting in a lower NM excretion and a strong reduction of milk output. The inclusion of low protein feeds (PBP, POT) in the diet increased milk output and the conversion efficiency of feed N into milk N, but NM excretion decreased only slightly.
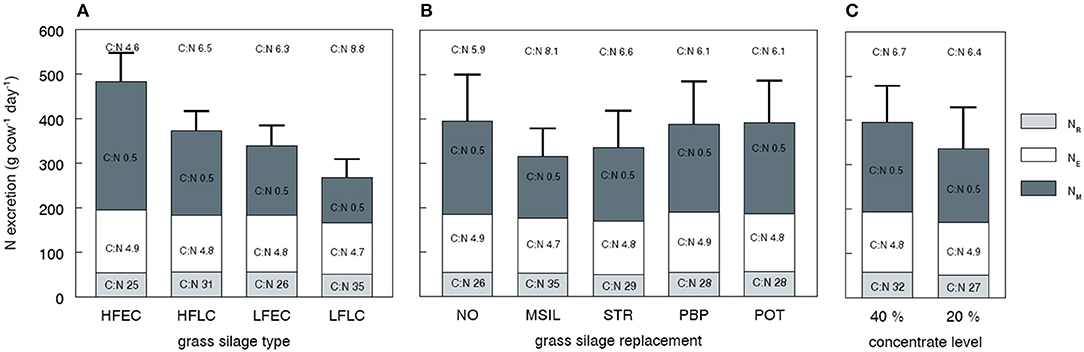
Figure 2. Simulated N excretion divided in three different fractions as affected by nutritional strategy, the carbon (C) to nitrogen (N) (C:N) ratio of these fractions and the C:N ratio of the total excreta. The excreta fractions represent NM (immediately available N), NE (easily decomposable N), and NR (resistant N) as described in Table 6. The bars represent average values for all strategies with a given grass silage type (A, n = 10), grass silage replacement (B, n = 8), and concentrate level (C, n = 20), as described in Table 3. HFEC, high fertilized, early cutting stage grass silage; HFLC, high fertilized, late cutting stage grass silage; LFEC, low fertilized, early cutting stage grass silage; LFLC, low fertilized, late cutting stage grass silage; NO, no replacement of grass silage; MSIL, maize silage; STR, straw; PBP, pressed beet pulp; POT, potatoes.
In contrast to the large variation in NM excretion, simulated variation in NE and NR excretion was small. The strategies that combine a high DMI with a relatively high rumen degradability of the carbohydrate fractions (EC silages, PBP, CONC 40%) showed a slightly higher NE excretion, as a result of an increased microbial synthesis in the rumen and the LI. The variation in Pu fraction between silages was minor, helping to explain that variation in NR was small. The NR excretion appeared to be rather constant, and thus the variation in C:N ratio of the NR fraction (Figure 2) can be attributed to differences in C (OM) excretion. In case of diets with LC or maize silage, the high C excretion was induced by a high Fu fraction of the diet. Diets with a high concentrate level (CONC 40%) result in a high C excretion because the ruminal NDF digestion was impaired as a result of high rumen fractional passage rates and low rumen pH.
A high total OM excretion was induced either by a high DMI (CONC 40%, PBP, POT), a low OM digestibility (LC silages), or a combination of both (MSIL, Figure 3). A low concentrate level (CONC 20%) or the use of straw (STR) decreased total OM excretion due the relatively low DMI with these strategies. Diets with the highest urinary excretion (HFEC, NO, PBP, POT, 40% CONC) showed the highest OMNF excretion. The excretion of fiber OM (sum of OMRIF and OMRDF) is mainly determined by the amount of undigested NDF and was highest for LC silages, MSIL and 40% CONC. The fraction of OMRDF clearly reflects the efficiency of rumen NDF digestion. The lower DMI with the STR and 20% CONC diets indicates a more efficient rumen digestion of potentially rumen degradable NDF because of a lower fractional rate of rumen passage and a higher pH.
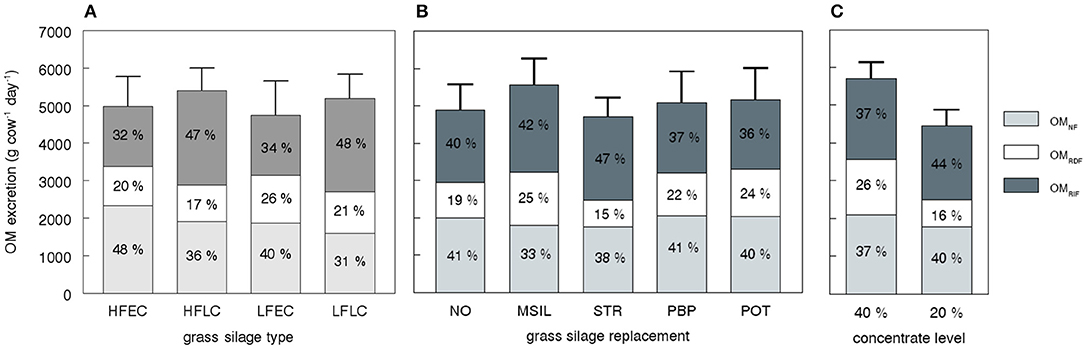
Figure 3. Simulated organic matter (OM) excretion divided in three different fractions as affected by nutritional strategy. The excreta fractions represent OMNF (non-fibrous OM), OMRDF (rumen potentially digestible fiber), and OMRIF (rumen indigestible fiber) as described in Table 6. The bars represent average values for all strategies with a given grass silage type (A, n = 10), grass silage replacement (B, n = 8) and concentrate level (C, n = 20) as described in Table 3. HFEC, high fertilized, early cutting stage grass silage; HFLC, high fertilized, late cutting stage grass silage; LFEC, low fertilized, early cutting stage grass silage; LFLC, low fertilized, late cutting stage grass silage; NO, no replacement of grass silage; MSIL, maize silage; STR, straw; PBP, pressed beet pulp; POT, potatoes.
Simulated Slurry Composition
The simulated fraction of slurry N present in ammonium (NM) after 4 months of storage was on average 52%, with a considerable variation between diets (range 34–65%, Table 7). Simulated total N content of the slurries was on average 61 g kg−1 OM (range 38–98) and the largest part of the variation was caused by variation in the simulated NH4-N content (14–64 g kg−1 OM). The variation in simulated organic N content was considerably smaller (23–35 g kg−1 OM, Table 7). Both C:Ntotal ratio (4.4–11.9) and C:Norganic ratio (12.4–19.3) showed a large variation. The simulated ammonia-N loss was on average 37 g day−1, but ranged from 11 to 73 g day−1. These losses accounted for 9.7% (range 5.1–13.3) of the total excreted N (Table 7). Lowest slurry organic N contents were simulated for diets based on LC silages (HFLC, LFLC), MSIL, and a high use of concentrates (40% CONC, Figure 4). The highest inorganic N contents were simulated for diets based on grass silage HFEC and the lowest values for diets based on grass silage LFLC or on MSIL.
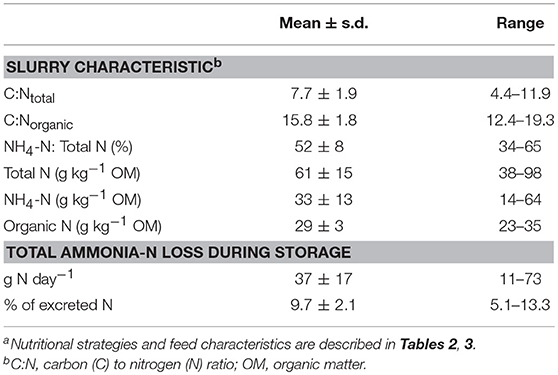
Table 7. Mean values and ranges of simulated slurry composition after 4 months of storage and simulated ammonia losses for 40 nutritional strategiesa for dairy cows.
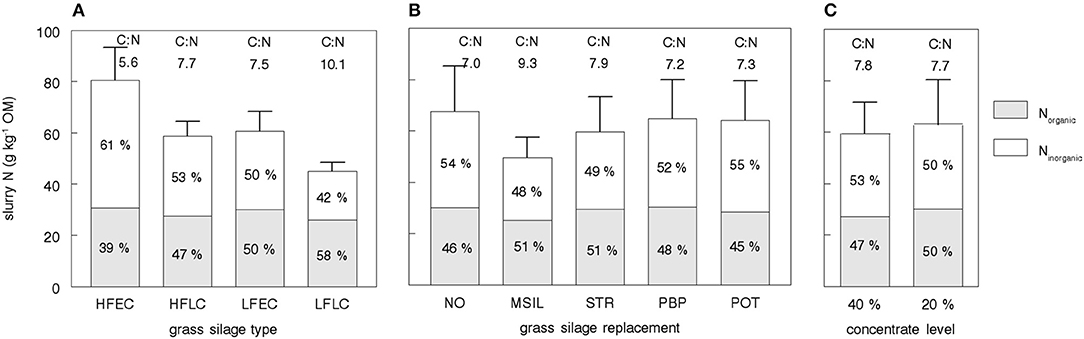
Figure 4. Simulated total, organic and inorganic slurry nitrogen (N) content after 4 months of storage and the simulated slurry carbon (C) to nitrogen (N) (C:Ntotal) ratio as affected by nutritional strategy. The bars represent average values for all strategies with a given grass silage type (A, n = 10), grass silage replacement (B, n = 8), and concentrate level (C, n = 20) as described in Table 3. HFEC, high fertilized, early cutting stage grass silage; HFLC, high fertilized, late cutting stage grass silage; LFEC, low fertilized, early cutting stage grass silage; LFLC, low fertilized, late cutting stage grass silage; NO, no replacement of grass silage; MSIL, maize silage; STR, straw; PBP, pressed beet pulp; POT, potatoes.
Discussion
Evaluation of the Selected Nutritional Strategies
Nutritional strategies to reduce excessive N excretion to the environment often focus on an improvement of the feed N conversion. In this study, the selected strategies were aimed at an increase of the feed N conversion compared to the basic situation where highly fertilized early cut grass silage (HFEC) is fed as the sole forage. Simulated feed N conversion was higher indeed for all strategies that included an adaptation of the silage type and/or a replacement of grass silage (Table 3). In line with experimental observations, reducing the fertilization level of grass silage (e.g., Peyraud and Astigarraga, 1998; Warner et al., 2016) and the inclusion of maize silage (e.g., Van Gastelen et al., 2015) showed a strong potential to increase feed N conversion. The other strategies showed only moderate effects as a result of a decreased milk production (LC silages, straw) or an increased feed intake (PBP and POT). The average simulated feed N conversion was similar to that reported in a meta-analysis for North European dairy cattle fed primarily silage based diets (29 vs. 28%, respectively; Huhtanen and Hristov, 2009) whereas the simulated range was somewhat smaller than that reported (23–37 vs. 16–40%, respectively).
To obtain a large range in the dietary protein level, the concentrate composition was not adjusted for the protein level of the forages. This occasionally resulted in low dietary crude protein contents and rumen degradable protein balances (Table 4). Still, aminogenic nutrients were never predicted to be in short supply; FPCM production was limited by the availability of energy in most of the situations (n = 38) or occasionally by glucogenic nutrients (n = 2). Furthermore, the range in dietary protein content (Table 4) is quite similar to the range Huhtanen and Hristov (2009) reported (101 to 252 g kg−1 DM), and therefore the simulated nutritional strategies might be interpreted as a realistic representation of diets for lactating dairy cows with respect to the dietary protein content. In practice, the selected forages will often be supplemented with byproducts or concentrates aimed to balance the diet offered to cattle, to avoid nutrient deficiencies.
Simulation of Excreta Composition
Fecal Excretion
Several authors have shown that an increase in N intake results in a moderate, linear increase of excretion of fecal N and milk N combined with a much more pronounced linear (Kebreab et al., 2010) or exponential (Castillo et al., 2000; Kebreab et al., 2001) increase in the excretion of urinary N. Our simulation data reproduce a similar pattern (Figure 5). The average level of fecal N excretion (154 g day−1) is well in line with experimental data of Castillo et al. (2000); Kebreab et al. (2001), and Spek et al. (2013; European data). However, the simulated range in fecal N excretion is smaller than observed in some of these trials. The small variation in fecal N excretion may partly be attributed to the limited range in Pu fraction of the grass silages. The Pu fraction (range, 16–19 g kg−1 DM; Table 2) was estimated according to regression equations by Tamminga et al. (1991). In their approach, Pu was the N residue × 6.25, remaining in nylon bags after prolonged rumen incubation (336 h) of 17 different grass silages; using stepwise regression they obtained a Pu prediction equation based on grass silage characteristics. The Pu fractions actually observed in the study of Tamminga et al. (1991) ranged from 7 to 29 g kg−1 DM, in line with Pu fractions reported by Heeren et al. (2014) (10–29 g kg−1 DM). Other experiments showed that variation in the Pu fraction of individual grass silages may even be larger (Von Keyserlingk et al., 1996; Bruinenberg et al., 2004). The Pu fraction is excreted with feces and it determines directly the amount of N excreted with FFFC. The simulated N excretion with the FFFC fraction for the selected strategies showed a limited variation of only 40–48 g N day−1 (data not shown). When more variation in Pu would have been assumed, this range would have been greater, directly implying a larger range in total fecal N and NR excretion.
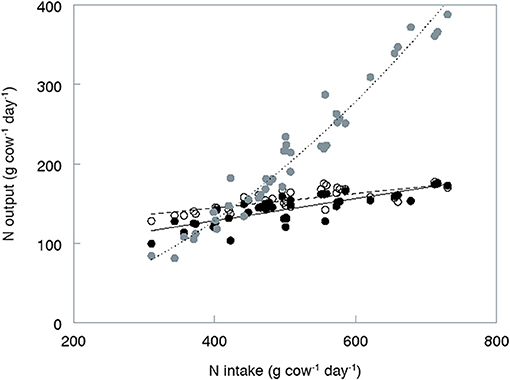
Figure 5. Simulated relation between total nitrogen (N) intake (g day−1) and the output of N (g day−1) with (•) milk (°) feces and (•) urine for 40 nutritional strategies.
The fraction of fecal N excreted with FFFC (24–32%, data not shown) is slightly higher than measured fractions of NDF-N in feces by Sørensen et al. (2003, 14–21%) and Powell et al. (2006, 18–29%) after feeding a large range of diets to dairy cows. The simulated proportion of fecal N being present in microbial material ranged from 47 to 55% and was somewhat lower than reported values of 70% by Robinson and Sniffen (1985), 53–73% by Robinson et al. (1987), and 61% by Larsen et al. (2001). Mason et al. (1981b) stated that the main components of the fecal water soluble N have their origins in intestinal excretion. In our study, the fecal N contained in endogenous material (FEMC) amounted up to 13–19%, being of similar magnitude as the fractions of water-soluble N reported for dairy cows (25%, Larsen et al., 2001) and sheep (15–24%; Mason et al., 1981a,b).
The assumptions for LI digestibility resulted in an average apparent N digestion in the LI of 6% of the outflow from the SI (ranging from −1 to 10%) which is considerably lower than that found for sheep (21%, Drochner and Meyer, 1991). This lower value may partly be attributed to the lower retention time for digesta in the LI of dairy cows compared to sheep. Apparent N digestion in the LI ranged from −1 to 15 g/d. This range is only slightly below that of 5–20 g N day−1 derived from Van der Walt (1993) and it is therefore not likely that the net N digestion in the LI has been underestimated significantly.
The fraction of fecal OM excreted with NDF ranged from 43 to 71% (data not shown) and corresponds reasonably with reported values of 57–61% of fecal OM by Robinson et al. (1987), 32–56% of fecal DM by Sørensen et al. (2003), and 50–60% of fecal DM by Powell et al. (2006). According to Van Soest (1994) the N content of the non-NDF fecal OM is 7%. Our simulated average N content of 8% (data not shown) is in agreement with this figure. In our simulations, microbial OM appeared to contribute most to fecal OM excretion. The simulated non-NDF fecal OM consisted for 9–15% of FEC, 66–75% of FMC and the remainder (14–24%) was FOFC.
Urinary Excretion
Simulated urinary N excretion was on average 58% of total manure N output, and showed a much larger variation (81–388 g N day−1) than simulated fecal N excretion (128–177 g N day−1). The simulated proportion of urinary N excreted with urea ranged from 62 to 86% with an average of 78%. These values are within the range reported in a review on urine composition (52 to 93%; Dijkstra et al., 2013). Bussink and Oenema (1998) stated that non-urea-like urinary components (UNUC) are generally excreted in fairly constant amounts and is on average 31 ± 4 g N day−1. As our assumptions are partly based on the same data sources, our simulations have a similar UNUC-N excretion of 27 ± 6 g N day−1. The variation in the simulated UNUC-N excretion is mainly determined by the variation in Hi (5% of total urinary N) and Aa (2% of total urinary N) as the other UNUC constituents were estimated either as a constant value (g day−1) or as very small fractions of total urinary N. In their review on urine composition of cattle, Dijkstra et al. (2013) reported N from Hi to vary between 3.4 and 8.0% of total urinary N. Elevated urinary Hi fractions would result in an increase of the urinary C:N ratio. Hippuric acid is mainly a derivative of rumen microbial fermentation of phenolic acids, which are constituents of plant lignin (Martin, 1982). With advancing plant maturity, both the solubility and degradability of various plant phenolic compounds decrease, which may result in reduced excretion of hippuric acid in urine (Dijkstra et al., 2013). However, experimental data to support this hypothesis are lacking.
Simulation of Slurry Composition
During storage of liquid manure, OM is subject to both anaerobic and aerobic bacterial degradation. To predict the composition of the slurry that is actually applied to the field, the digestion model presented in this study was extended with simple equations describing these processes. The formulated assumptions resulted in organic and inorganic N contents of stored slurry of on average 29 and 33 g kg−1 OM, respectively (Table 7). These values are in line with the average values derived from a large database (2011–2013) of Dutch dairy slurries (27 and 30 g kg−1 OM, respectively) (Velthof et al., 2015; CBGV (Committee Fertilisation Grassland Forage Crops), 2017).
In this study, the proportion of OM degraded during 4 months of storage was estimated at 13% based on Sørensen (1998). This value was obtained at a temperature of 15°C (Sørensen, 1998). Hindrichsen et al. (2006) reported a far higher OM degradation ranging from 32 to 47% within 14 weeks of anaerobic storage after feeding four different diets. This experiment was, however, conducted at an ambient temperature of 24°C. Whitehead and Raistick (1993) showed that slurry OM degradation after 3 weeks of storage, ranged from 14 to 34% and increased with slurry temperature (5–35°C). The lower temperature is close to the average Dutch winter temperature, explaining why the estimated 13% OM degradation provides a reasonable representation of the average Dutch winter situation; applying the model to other regions would likely require this factor to be changed.
Losses of N during the storage period (Table 7) ranged from 11 to 73 g cow−1 day−1 for the 40 nutritional strategies. These results confirm the strong potential to reduce ammonia emission by means of a reduction of the dietary protein content, as observed before (Paul et al., 1998; Külling et al., 2001), and also reported in a recent meta-analysis on ammonia emissions from dairy cattle housing (Bougouin et al., 2016). However, actual N losses depend on a number of variables like temperature, moisture, air flow, cleaning frequency, urease activity, and urine puddle replacement rate (Hristov et al., 2011; Bougouin et al., 2016). The formulated assumptions, aimed to illustrate the impact of differences in cow excreta composition on losses in the stable and during storage, provide a satisfactory representation of the average Dutch manure storage process. However, it is recognized that an accurate simulation of slurry storage processes, also in different regions, requires a more detailed representation of the effect of several storage conditions including pH, temperature, and exposed surface area (e.g., Rotz et al., 2014).
Nutritional Strategies and the Composition of Slurry N
The present model simulates a large variation in slurry N content (Figure 4). This variation intrinsically affects the plant availability of N after field application. Expressed per kg of slurry N, plant availability is related to the Ninorganic: Ntotal ratio (e.g., Reijs et al., 2007; Cavalli et al., 2016). This ratio ranged from 0.34 to 0.65 for the 40 nutritional strategies with an average of 0.52, and resulted from a marked variation in slurry inorganic N combined with a moderate variation in the organic N content of slurry (Table 7). This average Ninorganic: Ntotal ratio corresponds with that (0.49) in a database (2008–2010; Den Boer et al., 2012) of dairy cattle slurries, but with a somewhat smaller variation than that observed (SD of 0.079 and 0.135, respectively).
Organic N in slurry is mainly derived from fecal material. Due to a large variation in fecal OM excretion (3.1–5.8 kg day−1, Table 5) compared to the relatively smaller variation in fecal N excretion (128–177 g day−1), the simulated fecal N content was positively related to the apparent digestibility of the diet. This is in correspondence with findings of Kyvsgaard et al. (2000) and Sørensen et al. (2003). In the present study, low fecal N contents were simulated for diets that contained LC silages, MSIL, or 40% concentrate feeds. In accordance, these nutritional strategies also showed lowest organic N contents in the slurry (Figure 4). The variation in simulated slurry organic N content (from 23 to 35 g kg−1 OM) was smaller than the variation in fecal N content (from 27 to 49 g kg−1 OM) due to the fact that high digestible diets (e.g., EC silages) contain also a relatively small NDF fraction, implying a higher mineralization of fecal N during storage. Our simulation results reveal only a limited scope for variation in the organic N content of slurry.
The major part of the variation in slurry N content results from the variation in the inorganic N content of slurry (Figure 4). This inorganic N content is determined by the excretion of UUC-N relative to the total OM excretion. Therefore, the highest slurry inorganic N contents are observed when diets are fed that combine a high UUC-N excretion with a high OM digestibility. This combination is highly applicable to the nutritional strategies in this study based on the HFEC silages. The opposite is true for diets based on LFLC grass silage and MSIL: a low excretion of UUC-N coincides with a high OM excretion. As the LFLC diets also contain a high NDF fraction, the simulated mineralization of fecal N during storage was low, resulting in extremely low inorganic N contents and Ninorganic: Ntotal ratio's.
Sørensen et al. (2003) showed that slurry N availability (expressed per kg slurry N) to a barley crop was strongly related to the slurry C:Ntotal ratio. These findings were confirmed on grassland by Reijs et al. (2007) and may be explained by an immobilizing effect of organic manure components with a high C:N ratio (Chadwick et al., 2000; Chrystal et al., 2016). Slurry C:Ntotal ratio is affected by the composition of the diet and reported values range from 7.5 to 10.5 (Paul et al., 1998), from 6.4 to 13.1 (Sørensen et al., 2003), and from 5.1 to 11.4 (Reijs et al., 2007). The simulated range in C:Ntotal ratio (from 4.4 to 11.9) is in line with these results. Following our model simulations, a high C:Ntotal ratio reflects both a high C excretion with FFFC and a low N excretion with UUC. Again, diets that combine a low UUC-N excretion with a low NDF digestion (LFLC, MSIL) show the highest values, whereas lowest values are observed for diets with excessive availability of digestible protein and a highly digestible NDF fraction (HFEC). The other selected strategies did not cause pronounced effects on simulated C:Ntotal ratio (Figure 4). The latter results indicate that substantial changes in slurry C:Ntotal ratio and the subsequent plant availability of N, require rather large adjustments in the diet composition, affecting both UUC-N excretion and FFFC-OM excretion.
The Added Value of the Followed Approach
In this study, a dynamic and mechanistic model of rumen fermentation was used to predict the composition of excreta as a function of diet composition. The results indicate a satisfactory prediction of production and composition of feces and urine, as the simulated ranges in fecal and urinary composition were largely in line with values reported in literature. Some areas are identified to require additional refinement of the model, in particular the prediction of hindgut digestion and of the amount of non-urea-like urinary components. The present model takes into account interactions between different types of nutrients and the interaction with microbial activity. Therefore, its use may significantly improve the prediction of feed digestion in comparison to current static feed evaluation systems (Bannink et al., 2016). This feature is clearly illustrated by the prediction of a reduced digestion of rumen digestible fiber on diets that contain a large fraction of concentrate feeds (Figure 3). Our predictions are qualitatively in line with observations of Sørensen et al. (2003) who showed that the content of forage-derived decomposable fiber in the slurry was higher when the diet included concentrates. The model predicts the partitioning of N excretion in feces and urine and contributes to a better understanding of the effect of nutritional strategies on the utilization of N in the cow and the direct losses of N in the slurry storage. Losses during storage of slurry were assumed to occur at typical average ambient temperatures in the winter in the Netherlands. Application of the model to other seasons or regions with different ambient temperature would require modification of the value adopted in the present model to result in changed composition of stored slurry.
Compared to an earlier integrated model (Kebreab et al., 2004) the model presented in this study predicts not only the amount but also the composition of excreta N. Mineralization, immobilization and plant availability of N from soil-applied dairy manure is affected by the composition of the manure (Chadwick et al., 2000; Powell et al., 2006; Chrystal et al., 2016). These effects are often complex and variable for different crops and soils, and therefore the plant availability of N following organic manure application is difficult to predict. Several authors have shown that differences in plant availability of N from soil-applied manure are related to differences in cow nutrition (Kyvsgaard et al., 2000; Sørensen et al., 2003; Powell et al., 2006). The current model helps to understand how differences in manure composition are related to the composition of the diet and therefore it might contribute to a better prediction of plant availability of N following field application of cattle manure.
Conclusions
The model represents digestion and enteric microbial metabolism in the cow and helps to understand effects of changes in diet composition on excreta composition. The simulation results demonstrate the substantial effects of diverging diets on total N excretion and the composition of excreta in terms of immediately available N for plant uptake and the C:N ratio of the resistant N fraction. Diets with high fertilized, early cut grass silage resulted in the greatest urinary N excretion and ratio of slurry inorganic N to OM, whilst the opposite occurred with low fertilized, late cut grass silage or upon inclusion of maize silage. Further efforts are required to integrate effects of slurry storage conditions on the storage processes and subsequently on stored slurry composition. The model may significantly contribute to a better utilization of N from field applied manure and it can provide essential information for a more elaborate, integrated evaluation of the effect of different nutritional strategies at the whole-farm level.
Author Contributions
JR, JD, and EL developed the concepts. JR, JD, PB, AB, and EL developed the equations. JR and AB performed the simulations and analyzed the data. JR wrote original draft of manuscript and JD, PB, AB, and EL contributed to discussion and revision of this manuscript.
Conflict of Interest Statement
The authors declare that the research was conducted in the absence of any commercial or financial relationships that could be construed as a potential conflict of interest.
Acknowledgments
The paper is based on a chapter in the PhD thesis of JR (Reijs, 2007). This research was financially supported by the Social Sciences Research Council of the Netherlands Organization of Scientific Research (NWO). We thank Henk Valk (Animal Sciences Group, Wageningen University and Research Centre, the Netherlands) and Peter Sørensen (Department of Agroecology, Danish Institute of Agricultural Sciences, Denmark) for useful suggestions on the estimations of grass silage composition and slurry storage processes.
References
Abrahamse, P. A., Vlaeminck, B., Tamminga, S., and Dijkstra, J. (2008). The effect of silage and concentrate type on intake behavior, rumen function, and milk production in dairy cows in early and late lactation. J. Dairy Sci. 91, 4778–4792. doi: 10.3168/jds.2008-1350
Anonymous (2011). Veevoedertabel 2011. Lelystad: Centraal Veevoederbureau. Available online at: http://edepot.wur.nl/367874
Appuhamy, J. A. D. R. N., Moraes, L. E., Wagner-Riddle, C., Casper, D. P., and Kebreab, E. (2018). Predicting manure volatile solid output of lactating dairy cows. J. Dairy Sci. 101, 820–829. doi: 10.3168/jds.2017-12813
Bannink, A., Kogut, J., Dijkstra, J., France, J., Kebreab, E., Van Vuuren, A. M., et al. (2006). Estimation of the stoichiometry of volatile fatty acid production in the rumen of lactating cows. J. Theor. Biol. 238, 36–51. doi: 10.1016/j.jtbi.2005.05.026
Bannink, A., van Lingen, H. J., Ellis, J. L., France, J., and Dijkstra, J. (2016). The contribution of mathematical modeling to understanding dynamic aspects of rumen metabolism. Front. Microbiol. 7:1820. doi: 10.3389/fmicb.2016.01820
Børsting, C. F., Kristensen, T., Misciatelli, L., Hvelplund, T., and Weisbjerg, M. R. (2003). Reducing nitrogen surplus from dairy farms: effect of feeding and management. Livest. Prod. Sci. 83, 165–178. doi: 10.1016/S0301-6226(03)00099-X
Børsting, C. F., Weisbjerg, M. R., and Hvelplund, T. (1992). Fatty acid digestibility in lactating cows fed increasing amounts of protected vegetable oil, fish oil or saturated fat. Acta. Agric. Scand., Sect. A. Anim. Sci. 42, 148–156.
Bosch, M. W., Tamminga, S., Post, G., Leffering, C. P., and Muylaert, J. M. (1992). Influence of stage of maturity of grass silages on digestion processes in dairy cows. 1. Composition, nylon bag degradation rates, fermentation characteristics, digestibility and intake. Livest. Prod. Sci. 32, 245–264. doi: 10.1016/S0301-6226(12)80005-4
Bougouin, A., Leytem, A., Dijkstra, J., Dungan, R. S., and Kebreab, E. (2016). Nutritional and environmental effects on ammonia emissions from dairy cattle housing: a meta-analysis. J. Environ. Qual. 45, 1123–1132. doi: 10.2134/jeq2015.07.0389
Brask, M., Lund, P., Hellwing, A. L. F., Poulsen, M., and Weisbjerg, M. R. (2013). Enteric methane production, digestibility and rumen fermentation in dairy cows fed different forages with and without rapeseed fat supplementation. Anim. Feed Sci. Technol. 184, 67–79. doi: 10.1016/j.anifeedsci.2013.06.006
Bristow, A. W., Whitehead, D. C., and Cockburn, J. E. (1992). Nitrogenous constituents in the urine of cattle, sheep and goats. J. Sci. Food Agric. 59, 387–394. doi: 10.1002/jsfa.2740590316
Bruinenberg, M. H., Van Gelder, A. H., González-Pérez, P., Hindle, V. A., and Cone, J. W. (2004). Estimating rumen degradability of forages from semi-natural grasslands, using nylon bag and gas production techniques. NJAS Wagen. J. Life Sci. 51, 351–368. doi: 10.1016/S1573-5214(04)80002-2
Bussink, D. W., and Oenema, O. (1998). Ammonia volatilization from dairy farming systems in temperate areas: a review. Nutr. Cycl. Agroecosyst. 51, 19–33. doi: 10.1023/A:1009747109538
Cantalapiedra-Hijar, G., Peyraud, J. L., Lemosquet, S., Molina-Alcaide, E., Boudra, H., Nozière, P., et al. (2014). Dietary carbohydrate composition modifies the milk N efficiency in late lactation cows fed low crude protein diets. Animal 8, 275–285. doi: 10.1017/S1751731113002012
Castillo, A. R., Kebreab, E., Beever, D. E., and France, J. (2000). A review of efficiency of nitrogen utilization in lactating dairy cows and its relationship with environmental pollution. J. Anim. Feed Sci. 9, 1–32. doi: 10.22358/jafs/68025/2000
Cavalli, D., Cabassi, G., Borrelli, L., Geromel, G., Bechini, L., Degano, L., et al. (2016). Nitrogen fertilizer replacement value of undigested liquid cattle manure and digestates. Eur. J. Agron. 73, 34–41. doi: 10.1016/j.eja.2015.10.007
CBGV (Committee Fertilisation Grassland and Forage Crops). (2017). Fertilisation Advice 2017 (in Dutch). Wageningen: Wageningen Livestock Research.
Chadwick, D. R., John, F., Pain, B. F., Chambers, B. J., and Williams, J. (2000). Plant uptake of nitrogen from the organic nitrogen fraction of animal manures: a laboratory experiment. J. Agric. Sci. 134, 159–168. doi: 10.1017/S0021859699007510
Chrystal, J. M., Smith, L. C., Monaghan, R. M., Hedley, M., and Horne, D. (2016). Effects of applying dairy wintering barn manure of differing C:N ratios directly to pasture on N mineralisation and forage growth. New Zealand J. Agric. Res. 59, 324–331. doi: 10.1080/00288233.2016.1188131
De Visser, H., Huisert, H., and Ketelaar, R. S. (1991). Dried beet pulp, pressed beet pulp and maize silage as substitutes for concentrates in dairy cow rations. 2. Feed intake, fermentation pattern and ruminal degradation characteristics. NJAS Wagen. J. Life Sci. 39, 21–30.
DeMeyer, D. I., and De Graeve, K. (1991). Differences in stoichiometry between rumen and hindgut fermentation. Adv. Anim. Physiol. Anim. Nutr. 22, 50–59.
Den Boer, D. J., Reijneveld, J. A., Schöder, J. J., and van Middelkoop, J. C. (2012). Manure Composition in Advisory Basis Fertilisation Grassland and Forage Crops (in Dutch). Lelystad: Wageningen UR Livestock Research.
DePeters, E. J., Fadel, J. G., and Arosemena, A. (1997). Digestion kinetics of neutral detergent fiber and chemical composition within some selected by-product feedstuffs. Anim. Feed Sci. Tech. 67, 127–140. doi: 10.1016/0377-8401(96)01145-5
Dijkstra, J., France, J., Assis, A. G., Neal, H. D. St. C., Campos, O. F., et al. (1996). Simulation of digestion in cattle fed sugarcane: model development. J. Agric. Sci. 127, 231–246. doi: 10.1017/S0021859600078011
Dijkstra, J., France, J., and Davies, D. R. (1998). Different mathematical approaches to estimating microbial protein supply in ruminants. J. Dairy Sci. 81, 3370–3384. doi: 10.3168/jds.S0022-0302(98)75902-8
Dijkstra, J., Neal, H. D. St. C., Beever, D. E., and France, J. (1992). Simulation of nutrient digestion, absorption and outflow in the rumen: model description. J. Nutr. 122, 2239–2256. doi: 10.1093/jn/122.11.2239
Dijkstra, J., Oenema, O., Van Groenigen, J. W., Spek, J. W., van Vuuren, A. M., and Bannink, A. (2013). Diet effects on urine composition of cattle and N2O emissions. Animal 7(Suppl. 2), 292–302. doi: 10.1017/S1751731113000578
Ding, Z., Rowe, J. B., Godwin, I. R., Xu, Y., Ball, F. M., and Atkinson, S. (1998). No lactic acid absorbed from the caecum and rumen of sheep. Aust. J. Agric. Res. 49, 293–301. doi: 10.1071/A97077
Drochner, W., and Meyer, H. (1991). Verdauung organischer substanzen im dickdarm verscheidener haustierarten. Adv. Anim. Physiol. Anim. Nutr. 22, 18–40.
Erdman, R. A. (1998). Dietary buffering requirements of the lactating dairy cow: a review. J. Dairy Sci. 71, 3246–3266. doi: 10.3168/jds.S0022-0302(88)79930-0
Heeren, J. A. H., Podesta, S. C., Hatew, B., Klop, G., van Laar, H., Bannink, A., et al. (2014). Rumen degradation characteristics of ryegrass herbage and ryegrass silage are affected by interactions between stage of maturity and nitrogen fertilisation rate. Anim. Prod. Sci. 54, 1263–1267. doi: 10.1071/AN14259
Hindrichsen, I. K., Wettstein, H.-R., Machmüller, A., and Kreuzer, M. (2006). Methane emission, nutrient degradation and nitrogen turnover in dairy cows and their slurry at different milk production scenarios with and without concentrate supplementation. Agric. Ecosyst. Environ. 113, 150–161. doi: 10.1016/j.agee.2005.09.004
Hristov, A. N., Hanigan, M., Cole, A., Todd, R., McAllister, T. A., Ndegwa, P. M., et al. (2011). Review: AMMONIA emissions from dairy farms and beef feedlots. Can. J. Anim. Sci. 91, 1–35. doi: 10.4141/CJAS10034
Huhtanen, P., and Hristov, A. N. (2009). A meta-analysis of the effects of dietary protein concentration and degradability on milk protein yield and milk N efficiency in dairy cows. J. Dairy Sci. 92, 3222–3232. doi: 10.3168/jds.2008-1352
Jost, D. I., Jörgensen, R. G., and Sundrum, A. (2013). Effect of cattle faeces with different microbial biomass content on soil properties, gaseous emissions and plant growth. Biol. Fertil. Soils 49, 61–70. doi: 10.1007/s00374-012-0697-y
Kebreab, E., France, J., Beever, D. E., and Castillo, A. R. (2001). Nitrogen pollution by dairy cows and its mitigation by dietary manipulation. Nutr. Cycl. Agroecosyst. 60, 275–285. doi: 10.1023/A:1012668109662
Kebreab, E., France, J., Mills, J. A., Allison, R., and Dijkstra, J. (2002). A dynamic model of N metabolism in the lactating dairy cow and an assessment of impact of N excretion on the environment. J. Anim. Sci. 80, 248–259. doi: 10.2527/2002.801248x
Kebreab, E., Mills, J. A. N., Crompton, L. A., Bannink, A., Dijkstra, J., Gerrits, W. J. J., et al. (2004). An integrated mathematical model to evaluate nutrient partition in dairy cattle between the animal and its environment. Anim. Feed Sci. Tech. 112, 131–154. doi: 10.1016/j.anifeedsci.2003.10.009
Kebreab, E., Strathe, A. B., Dijkstra, J., Mills, J. A. N., Reynolds, C. K., Crompton, L. A., et al. (2010). “Energy and protein interactions and their effect on nitrogen excretion in dairy cows,” in 3rd EAAP International Symposium on Energy and Protein Metabolism and Nutrition, ed. G.M. Crovetto (Wageningen: Wageningen Academic Publishers), 417–425.
Kirchmann, H., and Witter, E. (1992). Composition of fresh, aerobic and anaerobic farm animal dungs. Bioresour. Technol. 40, 137–142. doi: 10.1016/0960-8524(92)90199-8
Klop, A., and De Visser, H. (1994). Afbraak Van Snijmaissilage, Maiskolvensilage En Corn Cob Mix in de Pens Van Melkkoeien. Report IVVO-DLO no. 262.
Külling, D. R., Menzi, D. H., Kröber, T. F., Neftel, A., Sutter, F., Lischer, P., et al. (2001). Emissions of ammonia, nitrous oxide and methane from different types of dairy manure during storage as affected by dietary protein content. J. Agric. Sci. 137, 235–250. doi: 10.1017/S0021859601001186
Kyvsgaard, P., Sørensen, P., Møller, E., and Magid, J. (2000). Nitrogen mineralization from sheep faeces can be predicted from the apparent digestibility of the feed. Nutr. Cycl. Agroecosyst. 57, 207–214. doi: 10.1023/A:1009874500769
Lapierre, H., Galindo, C. E., Lemosquet, S., Ortigues-Marty, I., Doepel, L., and Ouellet, D. R. (2010). “Protein supply, glucose kinetics and milk yield in dairy cows,” in 3rd EAAP International Symposium on Energy and Protein Metabolism and Nutrition, eds G. M. Crovetto (Wageningen: Academic Publishers, Netherlands), 275–285.
Larsen, M., Madsen, T. G., Weisjberg, M. R., Hvelplund, T., and Madsen, J. (2001). Small intestinal digestibility of microbial and endogenous amino acids in dairy cows. J. Anim. Physiol. Anim. Nutr. 85, 9–21. doi: 10.1046/j.1439-0396.2001.00297.x
Martin, A. K. (1982). The origin of urinary aromatic compounds excreted by ruminants. 2. The metabolism of phenolic cinnamic acids to benzoic acid. Br. J. Nutr. 47, 155–164. doi: 10.1079/BJN19820020
Mason, V. C., Bech-Andersen, S., and Narang, M. P. (1981b). Factors influencing faecal nitrogen excretion in sheep: 3. Protein fermentation in the caecum and large intestine. J. Anim. Physiol. Anim. Nutr. 46, 150–164.
Mason, V. C., Kessank, P., Ononiwu, J. C., and Narang, M. P. (1981a). Factors influencing faecal nitrogen excretion in sheep: 2. Carbohydrate fermentation in the caecum and large intestine. J. Anim. Physiol. Anim. Nutr. 45, 174–184.
Mills, J. A., Dijkstra, J., Bannink, A., Cammell, S. B., Kebreab, E., and France, J. (2001). A mechanistic model of whole-tract digestion and methanogenesis in the lactating dairy cow: model development, evaluation, and application. J. Anim. Sci. 79, 1584–1597. doi: 10.2527/2001.7961584x
Misselbrook, T., del Prado, A., and Chadwick, D. (2013). Opportunities for reducing environmental emissions from forage based dairy farms. Agric. Food Sci. 22, 93–107. doi: 10.23986/afsci.6702
Misselbrook, T. H., Powell, J. M., Broderick, G. A., and Grabber, J. H. (2005). Dietary manipulation in dairy cattle: laboratory experiments to assess the influence on ammonia emissions. J. Dairy Sci. 88, 1765–1777. doi: 10.3168/jds.S0022-0302(05)72851-4
Nocek, J. E., and Tamminga, S. (1991). Site of digestion of starch in the gastrointestinal tract of dairy cows and its effect on milk yield and composition. J. Dairy Sci. 74, 3598–3629. doi: 10.3168/jds.S0022-0302(91)78552-4
Offner, A., Bach, A., and Sauvant, D. (2003). Quantitative review of in situ starch degradation in the rumen. Anim. Feed Sci. Technol. 106, 81–93. doi: 10.1016/S0377-8401(03)00038-5
Oosting, S. J. (1993). Wheat Straw as Ruminant Feed: Effect of Supplementation and Ammonia Treatment on Voluntary Intake and Nutrient Availability. PhD thesis, Wageningen Agricultural University, Wageningen, Netherlands, 232.
Palmquist, D. L., Weisbjerg, M. R., and Hvelplund, T. (1993). Ruminal, intestinal, and total digestibilities of nutrients in cows fed diets high in fat and undegradable protein. J. Dairy Sci. 76, 1353–1364. doi: 10.3168/jds.S0022-0302(93)77466-4
Paul, J. P., Dinn, N. E., Kannangara, T., and Fisher, L. J. (1998). Protein content in dairy cattle affects ammonia losses and fertiliser nitrogen value. J. Environ. Qual. 27, 528–534. doi: 10.2134/jeq1998.00472425002700030008x
Peyraud, J. L., and Astigarraga, L. (1998). Review of the effect of nitrogen fertilization on the chemical composition, intake, digestion and nutritive value of fresh herbage: consequences on animal nutrition and N balance. Anim. Feed Sci. Technol. 72, 235–259. doi: 10.1016/S0377-8401(97)00191-0
Powell, J. M., and Rotz, C. A. (2015). Measures of nitrogen use efficiency in dairy production systems. J. Environ. Qual. 44, 336–344. doi: 10.2134/jeq2014.07.0299
Powell, J. M., Wattiaux, M. A., Broderick, G. A., Moreira, V. R., and Casler, M. D. (2006). Dairy diet impacts on fecal chemical properties and nitrogen cycling in soils. Soil Sci. Soc. J. 70, 786–794. doi: 10.2136/sssaj2005.0286
Reed, K. F., Moraes, L. E., Fadel, J. G., Casper, D. P., Dijkstra, J., France, J., et al. (2014). Prediction of nitrogen use in dairy cattle: a multivariate Bayesian approach. Anim. Prod. Sci. 54, 1918–1926. doi: 10.1071/AN14534
Reijs, J. W. (2007). Improving Slurry By Diet Adjustments : A Novelty To Reduce N Losses From Grassland Based Dairy Farms. PhD Thesis, Wageningen University & Research, Wageningen, Netherlands, p. 203. Available online at: http://edepot.wur.nl/121912
Reijs, J. W., Sonneveld, M. P. W., Sørensen, P., Schils, R. L. M., Groot, J. C. J., and Lantinga, E. A. (2007). Effects of different diets on utilization of nitrogen from cattle slurry applied to grassland on a sandy soil in the Netherlands. Agric. Ecosyst. Environ. 118, 65–79. doi: 10.1016/j.agee.2006.04.013
Robinson, P. H., and Sniffen, C. J. (1985). Forestomach and whole tract digestibility for lactating dairy cows as influenced by feeding frequency. J. Dairy Sci. 68, 857–867. doi: 10.3168/jds.S0022-0302(85)80903-6
Robinson, P. H., Tamminga, S., and Van Vuuren, A. M. (1987). Influence of declining level of feed intake and varying the proportion of starch in the concentrate on milk production and whole tract digestibility in dairy cows. Livest. Prod. Sci. 17, 19–35. doi: 10.1016/0301-6226(87)90050-9
Rotz, C. A., Montes, F., Hafner, S. D., Heber, A. J., and Grant, R. H. (2014). Ammonia emission model for whole farm evaluation of dairy production systems. J. Environ. Qual. 43, 1143–1158. doi: 10.2134/jeq2013.04.0121
Selbie, D. R., Buckthought, L. E., and Shepherd, M. A. (2015). “The challenge of the urine patch for managing nitrogen in grazed pasture systems,” in Advances in Agronomy, Vol. 129, ed D. L Sparks (London: Academic Press), 229–292.
Sinclair, L. A., Garnsworthy, P. C., Newbold, J. R., and Buttery, P. J. (1993). Effect of synchronizing the rate of dietary energy and nitrogen release on rumen fermentation and microbial protein synthesis in sheep. J. Agric. Sci. 120, 251–263. doi: 10.1017/S002185960007430X
Sluijsmans, C. M. J., and Kolenbrander, G. J. (1977). “The significance of animal manure as a source of N in soils,” in Proceedings of the International Seminar on Soil Environment and Fertility Management in Intensive Agriculture. Tokyo: The society of the science of soil and manure, 403–411.
Sørensen, P. (1998). Effects of storage time and straw content of cattle slurry on the mineralization of nitrogen and carbon in soil. Biol. Fertil. Soils 27, 85–91. doi: 10.1007/s003740050404
Sørensen, P., Weisbjerg, M. R., and Lund, P. (2003). Dietary effects on the composition and plant utilization of nitrogen in dairy cattle manure. J. Agric. Sci. 141, 79–91. doi: 10.1017/S0021859603003368
Spek, J. W., Dijkstra, J., van Duinkerken, G., Hendriks, W. H., and Bannink, A. (2013). Prediction of urinary nitrogen and urinary urea nitrogen excretion by lactating dairy cattle in northwestern Europe and North America: a meta-analysis. J. Dairy Sci. 96, 4310–4322. doi: 10.3168/jds.2012-6265
Storm, E., Brown, D. S., and Ørskov, E.R. (1983). The nutritive value of rumen micro-organisms in ruminants: 3. The digestion of microbial amino and nucleic acids in, and losses of endogenous nitrogen from, the small intestine of sheep. Br. J. Nutr. 50, 479–485. doi: 10.1079/BJN19830116
Susmel, P., Spanghero, M., Stefanon, B., Mills, C. R., and Plazzotta, E. (1993). N losses, purine derivatives excretion and intestinal digestible protein requirements of cows at maintenance. Livest. Prod. Sci. 36, 213–222. doi: 10.1016/0301-6226(93)90054-L
Tamminga, S., Ketelaar, R., and Van Vuuren, A. M. (1991). Degradation of nitrogenous compounds in conserved forages in the rumen of dairy cows. Grass Forage Sci. 46, 427–435. doi: 10.1111/j.1365-2494.1991.tb02403.x
Tamminga, S., Van Straalen, W. M., Subnel, A. P. J., Meijer, R. G. M., Steg, A., Wever, C. J. G., et al. (1994). The Dutch protein evaluation system: the DVE/OEB-system. Livest. Prod. Sci. 40, 139–155. doi: 10.1016/0301-6226(94)90043-4
Tamminga, S., Van Vuuren, A. M., Van der Koelen, C. J., Ketelaar, R. S., and Van der Togt, P. L. (1990). Ruminal behaviour of structural carbohydrates, non-structural carbohydrates and crude protein from concentrate ingredients in dairy cows. NJAS Wagen. J. Life Sci. 38, 513–521.
Valadares, R. F., Broderick, G. A., Valadares Filho, S. C., and Clayton, M. K. (1999). Effect of replacing alfalfa silage with high moisture corn on ruminal protein synthesis estimated from excretion of total purine derivatives. J. Dairy Sci. 82, 2686–2696. doi: 10.3168/jds.S0022-0302(99)75525-6
Van der Walt, J. G. (1993). Nitrogen metabolism of the ruminant liver. Aust. J. Agric. Res. 44. 381–403.
Van Duinkerken, G., André, G., Smits, M. C. J., Monteny, G. J., Blanken, K., Wagemans, M. J. M., et al. (2003). Relatie Tussen voeding en Ammoniakemissie Vanuit de Melkveestal. PraktijkRapport 25. Lelystad: Applied Science; Animal Sciences Group; Wageningen University and Research, 66.
Van Gastelen, S., Antunes-Fernandes, E. C., Hettinga, K. A., Klop, G., Alferink, S. J. J., Hendriks, W. H., et al. (2015). Enteric methane production, rumen volatile fatty acid concentrations, and milk fatty acid composition in lactating Holstein-Friesian cows fed grass silage- or corn silage-based diets. J. Dairy Sci. 98, 1915–1927. doi: 10.3168/jds.2014-8552
Van Soest, P. J. (1994). Nutritional Ecology of the Ruminant, 2nd Edn. Ithaca, NY: Cornell University Press.
Van Straalen, W. M. (1995). Modelling of Nitrogen Flow and Excretion in Dairy Cows. PhD Thesis. Wageningen, Wageningen University, 205.
Velthof, G. L., Hou, Y., and Oenema, O. (2015). Nitrogen excretion factors of livestock in the European Union: a review. J. Sci. Food Agric. 95, 3004–3014. doi: 10.1002/jsfa.7248
Von Keyserlingk, M. A. G., Swift, M. L., Puchala, R., and Shelford, J. A. (1996). Degradability characteristics of dry matter and crude protein of forages in ruminants. Anim. Feed Sci. Technol. 57, 291–311. doi: 10.1016/0377-8401(95)00865-9
Warner, D., Hatew, B., Podesta, S. C., Klop, G., van Gastelen, S., van Laar, H., et al. (2016). Effects of nitrogen fertilisation rate and maturity of grass silage on methane emission by lactating dairy cows. Animal 10, 34–43. doi: 10.1017/S1751731115001640
Whitehead, D. C., and Raistick, N. (1993). Nitrogen in the excreta of dairy cattle: changes during short-term storage. J. Agric. Sci. 121, 79–81. doi: 10.1017/S0021859600076814
Keywords: models, dairy cattle, feces, urine, diet composition, manure composition
Citation: Dijkstra J, Bannink A, Bosma PM, Lantinga EA and Reijs JW (2018) Modeling the Effect of Nutritional Strategies for Dairy Cows on the Composition of Excreta Nitrogen. Front. Sustain. Food Syst. 2:63. doi: 10.3389/fsufs.2018.00063
Received: 16 February 2018; Accepted: 10 September 2018;
Published: 10 October 2018.
Edited by:
Tom Misselbrook, Rothamsted Research (BBSRC), United KingdomReviewed by:
Maria Alejandra Herrero, Universidad de Buenos Aires, ArgentinaDavid R. Yanez-Ruiz, Consejo Superior de Investigaciones Científicas (CSIC), Spain
Copyright © 2018 Dijkstra, Bannink, Bosma, Lantinga and Reijs. This is an open-access article distributed under the terms of the Creative Commons Attribution License (CC BY). The use, distribution or reproduction in other forums is permitted, provided the original author(s) and the copyright owner(s) are credited and that the original publication in this journal is cited, in accordance with accepted academic practice. No use, distribution or reproduction is permitted which does not comply with these terms.
*Correspondence: Jan Dijkstra, jan.dijkstra@wur.nl
†Present Address: Pieter M. Bosma, Dairy farm Bosma, Winsum, Netherlands Joan W. Reijs, Wageningen Economic Research, Wageningen University & Research, Wageningen, Netherlands