Article

Integration of Microalgae-Based Bioenergy Production into a Petrochemical Complex: Techno-Economic Assessment

by
Ana L. Gonçalves
,
Maria C. M. Alvim-Ferraz
,
Fernando G. Martins
,
Manuel Simões
and
José C. M. Pires
*
LEPABE, Departamento de Engenharia Química, Faculdade de Engenharia, Universidade do Porto, Rua Dr. Roberto Frias, Porto 4200-465, Portugal
*
Author to whom correspondence should be addressed.
Energies 2016, 9(4), 224; https://doi.org/10.3390/en9040224
Submission received: 20 January 2016 / Revised: 2 March 2016 / Accepted: 16 March 2016 / Published: 23 March 2016
(This article belongs to the Special Issue Algae Fuel 2015)

Abstract

:
The rapid development of modern society has resulted in an increased demand for energy, mainly from fossil fuels. The use of this source of energy has led to the accumulation of carbon dioxide (CO2) in the atmosphere. In this context, microalgae culturing may be an effective solution to reduce the CO2 concentration in the atmosphere, since these microorganisms can capture CO2 and, simultaneously, produce bioenergy. This work consists of a techno-economic assessment of a microalgal production facility integrated in a petrochemical complex, in which established infrastructure allows efficient material and energy transport. Seven different scenarios were considered regarding photosynthetic, lipids extraction and anaerobic digestion efficiencies. This analysis has demonstrated six economically viable scenarios able to: (i) reduce CO2 emissions from a thermoelectric power plant; (ii) treat domestic wastewaters (which were used as culture medium); and (iii) produce lipids and electrical and thermal energy. For a 100-ha facility, considering a photosynthetic efficiency of 3%, a lipids extraction efficiency of 75% and an anaerobic digestion efficiency of 45% (scenario 3), an economically viable process was obtained (net present value of 22.6 million euros), being effective in both CO2 removal (accounting for 1.1 × 10⁴ t per year) and energy production (annual energy produced was 1.6 × 10⁷ kWh and annual lipids productivity was 1.9 × 10³ m3).

Graphical Abstract

1. Introduction

In the last decades, greenhouse gas (GHG, mainly carbon dioxide, CO2) emissions to the atmosphere have increased drastically, leading to atmospheric concentrations 40% higher than those observed in the pre-industrial period [1]. This concentration increase is associated with the planet’s climate change, strongly concerning different entities worldwide, because the associated environmental changes tend to be uncontrolled and unacceptable [2,3,4]. Therefore, there is an urgent need to develop efficient CO2 mitigation systems and also to use carbon neutral energy sources. Microalgae culturing is considered a promising alternative to efficiently remove CO2 from atmosphere or from flue gas emissions; microalgae are photosynthetic microorganisms that convert CO2 into organic compounds in the presence of light [5,6]. Although terrestrial plants are also capable of reducing CO2 levels, microalgae present some notable advantages [7,8,9,10]: (i) higher growth and biomass production rates; (ii) shorter times to maturity; (iii) no need for arable land; and (iv) the capability to grow using waste as nutrients. To reduce the costs associated with nutrient supply and the environmental impact of using freshwater resources, microalgal culture can be performed using: (i) domestic [11,12]; (ii) leachate [13,14]; (iii) agricultural [15,16]; (iv) refinery [17]; and (v) industrial [18] wastewater as culture medium. This procedure simultaneously promotes nutrient removal from wastewaters (a costly treatment process) and biomass production [19,20,21]. In addition, microalgal biomass can play an important role in biofuel production [22,23,24]: (i) the fatty acids produced by microalgae can be extracted and converted into biodiesel; and (ii) residual biomass can be fermented to produce ethanol or methane. This study aims to develop a techno-economic analysis of microalgal cultivation near a petrochemical complex located in Sines (Portugal) for bioenergy production using CO2 from local emissions and domestic wastewater as culture medium.

2. Microalgal Production Plant Siting

Under autotrophic conditions, microalgae reproduce through photosynthesis, requiring CO2, water and inorganic salts to convert light energy into chemical energy in the form of organic compounds [25]. Growth medium requires the presence of the inorganic elements that constitute algal cells: nitrogen and phosphorus. Marine microalgae are commonly grown in sea water supplemented with nitrate and phosphate fertilizers, whereas other microalgae can be cultivated in wastewaters, thus reducing culturing costs and providing wastewater treatment [26]. In commercial scale systems, microalgal culturing represents up to 30% of the total oil production costs [27]. The utilization of wastewater as culture medium can significantly reduce the operational costs associated to the culturing step. In addition, CO2 from the atmosphere or from flue gas emissions should be supplied continuously during light periods, thus enabling CO2 mitigation. Therefore, the selection of the location for microalgal culturing should not focus exclusively on the weather conditions, but also on the availability of water, nutrients (carbon, nitrogen and phosphorus) and land [28,29]. In addition, the proximity to an established infrastructure will also be important to allow the efficient material transport (raw materials and process products) and utility needs. The reduction of transportation costs will enhance the economic viability of the process and improve its overall energy balance. In biofuel production using other feedstocks, the transportation costs may represent 12%–50% of the total production costs [28].

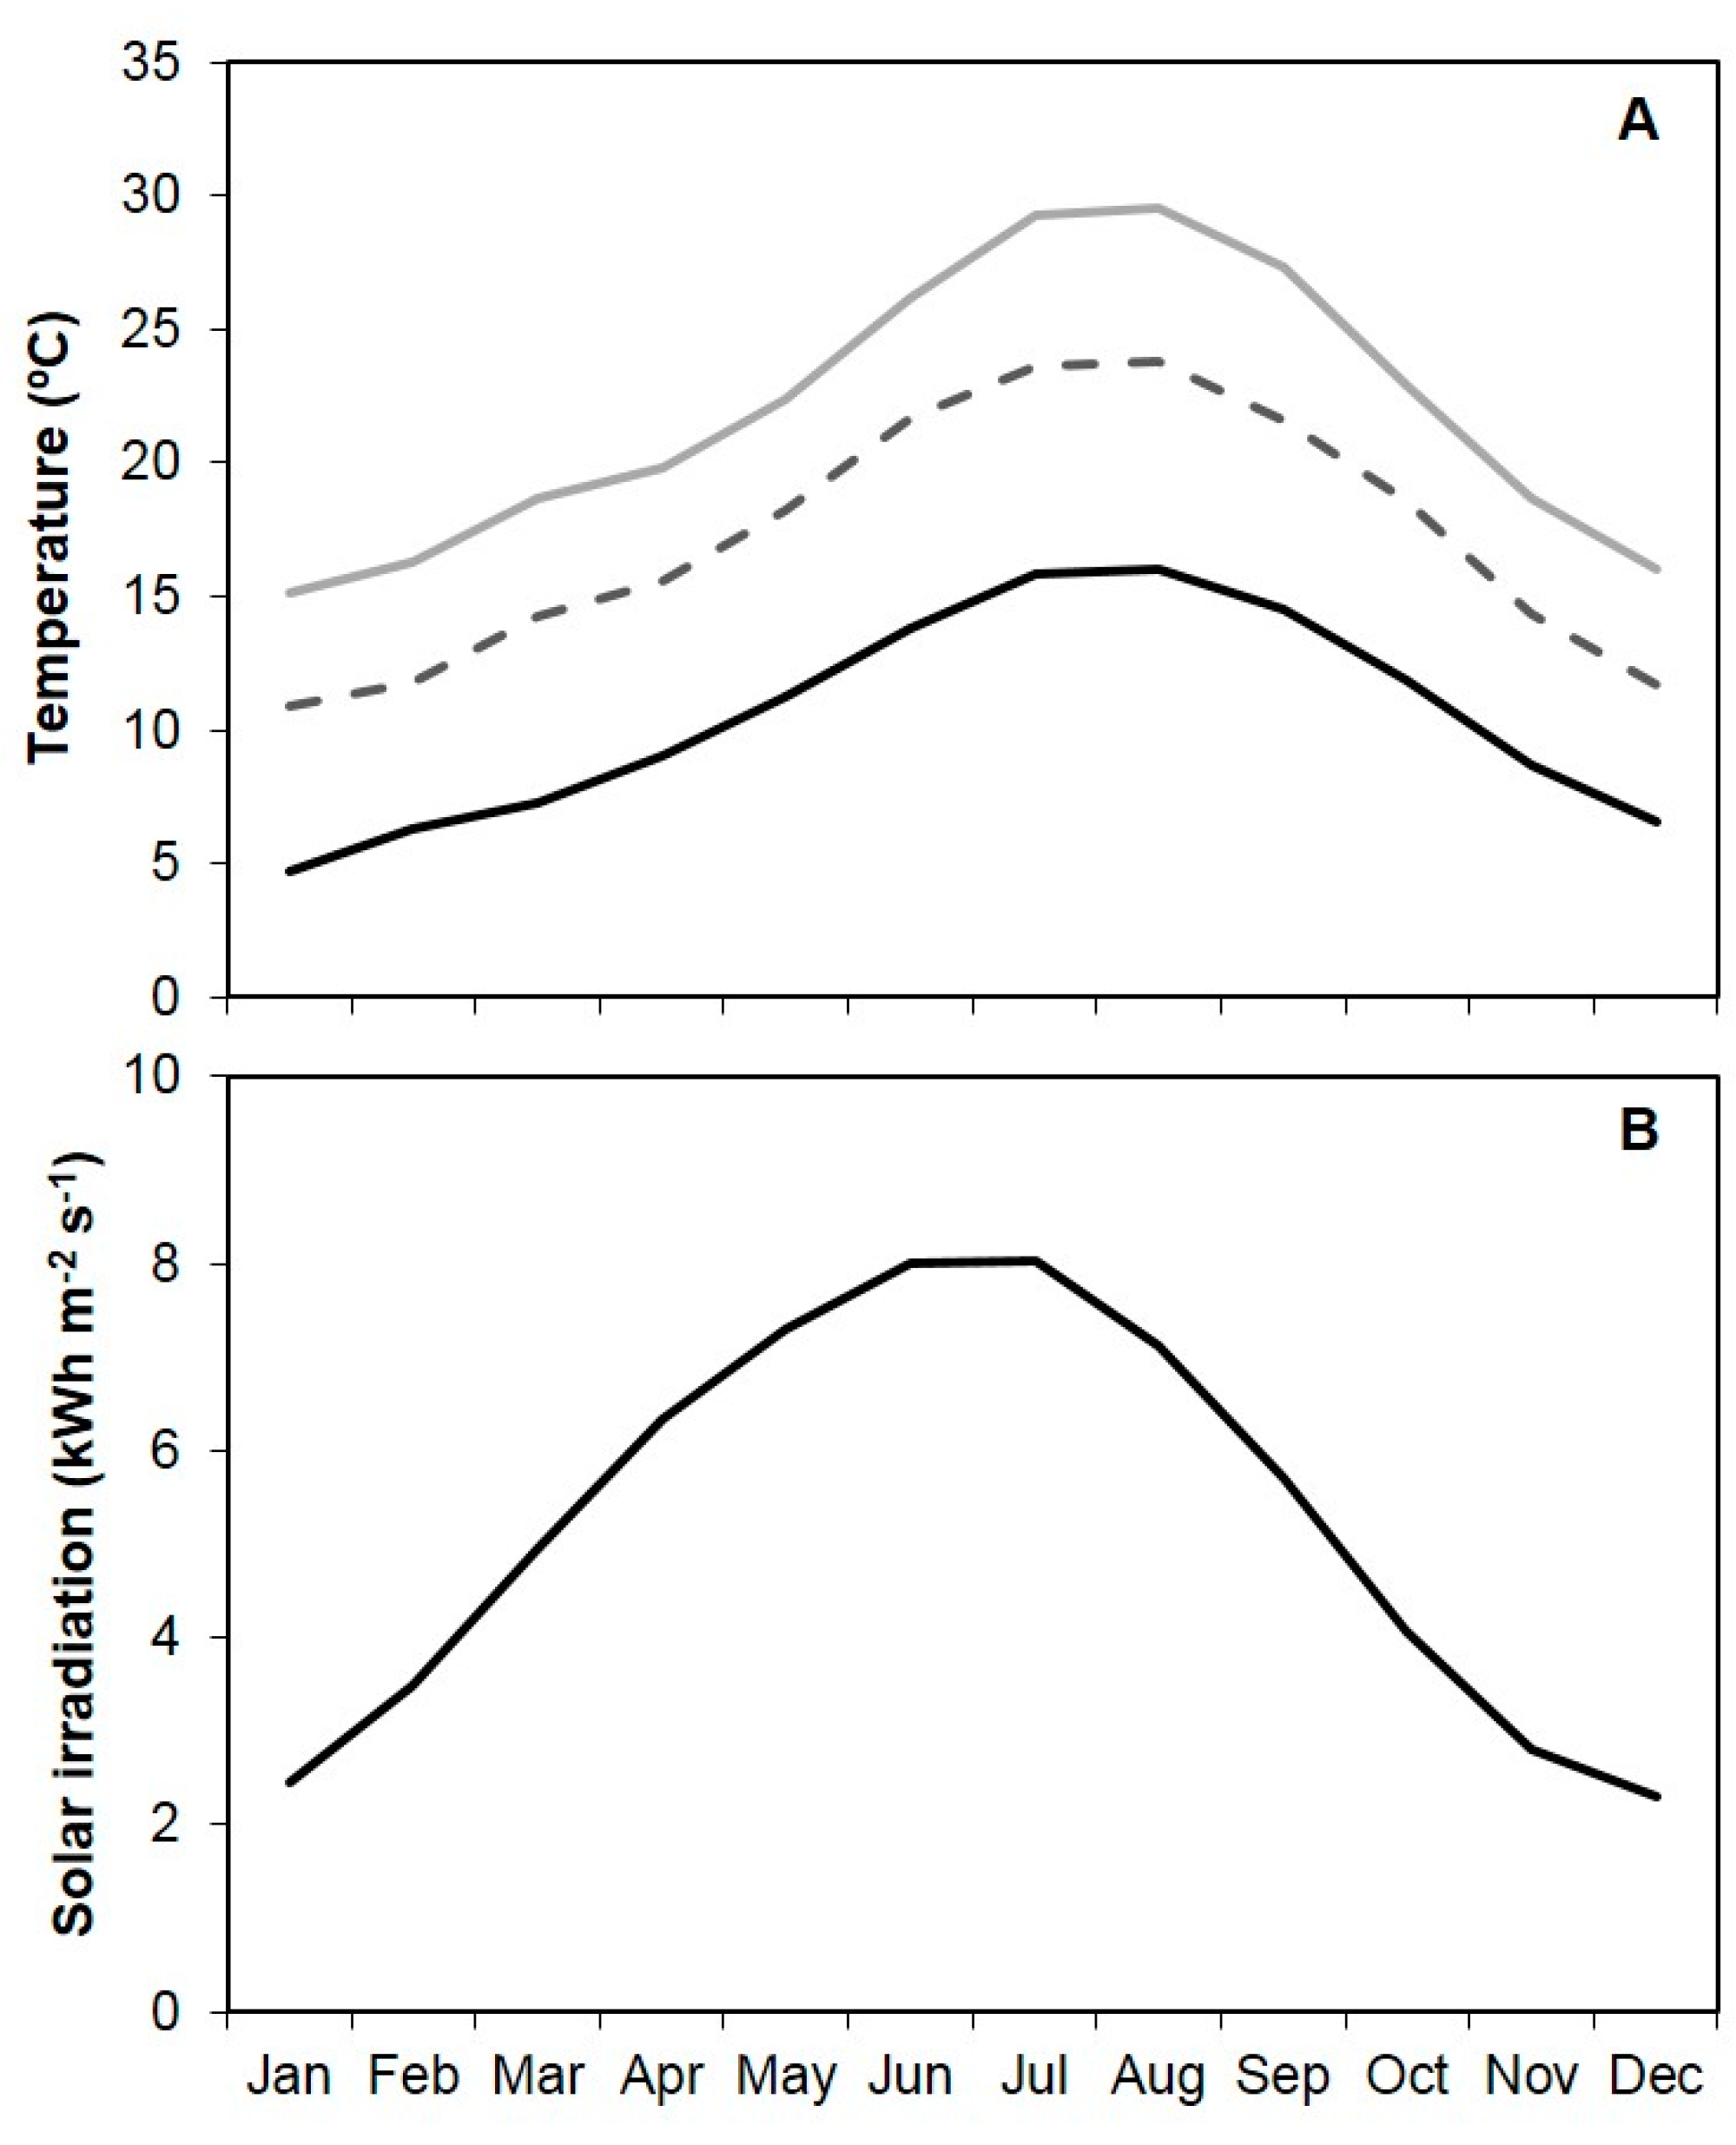
2.1. Proposed Location and Site Description

The present study proposes the construction of a high rate pond facility in Sines, Portugal. Sines is a municipality from the district of Setúbal, which is located in the Alentejo Litoral region. Total area of this municipality is approximately 203 km2 and in 2011, its population density was 70 inhabitants km−2, corresponding to a total of 14,210 inhabitants [30].
Microalgal culturing in open ponds strongly depends on environmental factors, such as temperature, solar light irradiation and evaporation rates. Therefore, selection of an adequate site for the installation of an algal facility should take into account these parameters. Daily and annual fluctuations in temperature can result in significant microalgal productivity losses. Temperatures ranging from 15 to 26 °C have been reported as optimal growth temperatures for some microalgal species [31]. The average annual temperature observed in the region of Sines is around 17.2 °C (monthly minimum, maximum and average temperatures are presented in Figure 1A). Horizontal light irradiation in Sines municipality (Figure 1B) presents an annual average of 5.21 kWh·m−2·day−1 [32]. Water evaporative losses in open ponds are very common. Evaporation rate depends on different factors, such as [33]: (i) water temperature in the air-water surface; (ii) air-water surface area; and (iii) air temperature. Evaporation rates in lagoons from the south of Portugal were determined by Rodrigues [33]. In this study, the author has demonstrated average evaporation rates of 0.075 m·month−1.
Selection of this local site was based on these environmental factors. However, other characteristics were considered: (i) the flat topography of this region, which avoids the need for land preparation before open pond construction; (ii) the presence of a thermoelectric power plant in this area, which can supply the facility with the required CO2 and other utilities, such as steam; (iii) the presence of a biodiesel production plant able to generate energy from raw materials, such as oils and animal fats, with a production capacity of 27 kt·year−1; (iv) the closeness to the coast, so that seawater can be easily used if required; and (v) the availability of sufficient domestic wastewater to feed the algal facility (the wastewater load at a typical Portuguese wastewater treatment plant is about 1000 m3·h−1 for a population equivalent of 170,000 inhabitants and the number of inhabitants of Setúbal district is approximately 867,000 [30]).

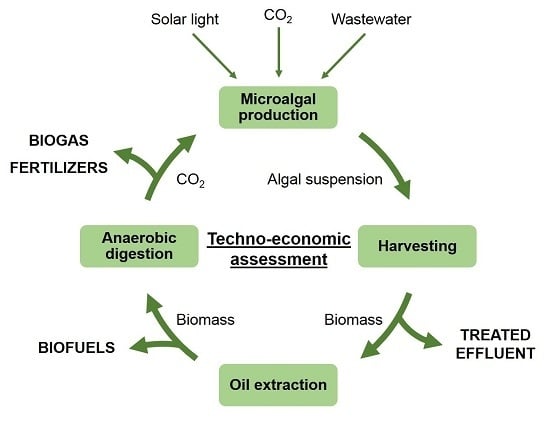
3. Process Flowsheet and Scenarios Description

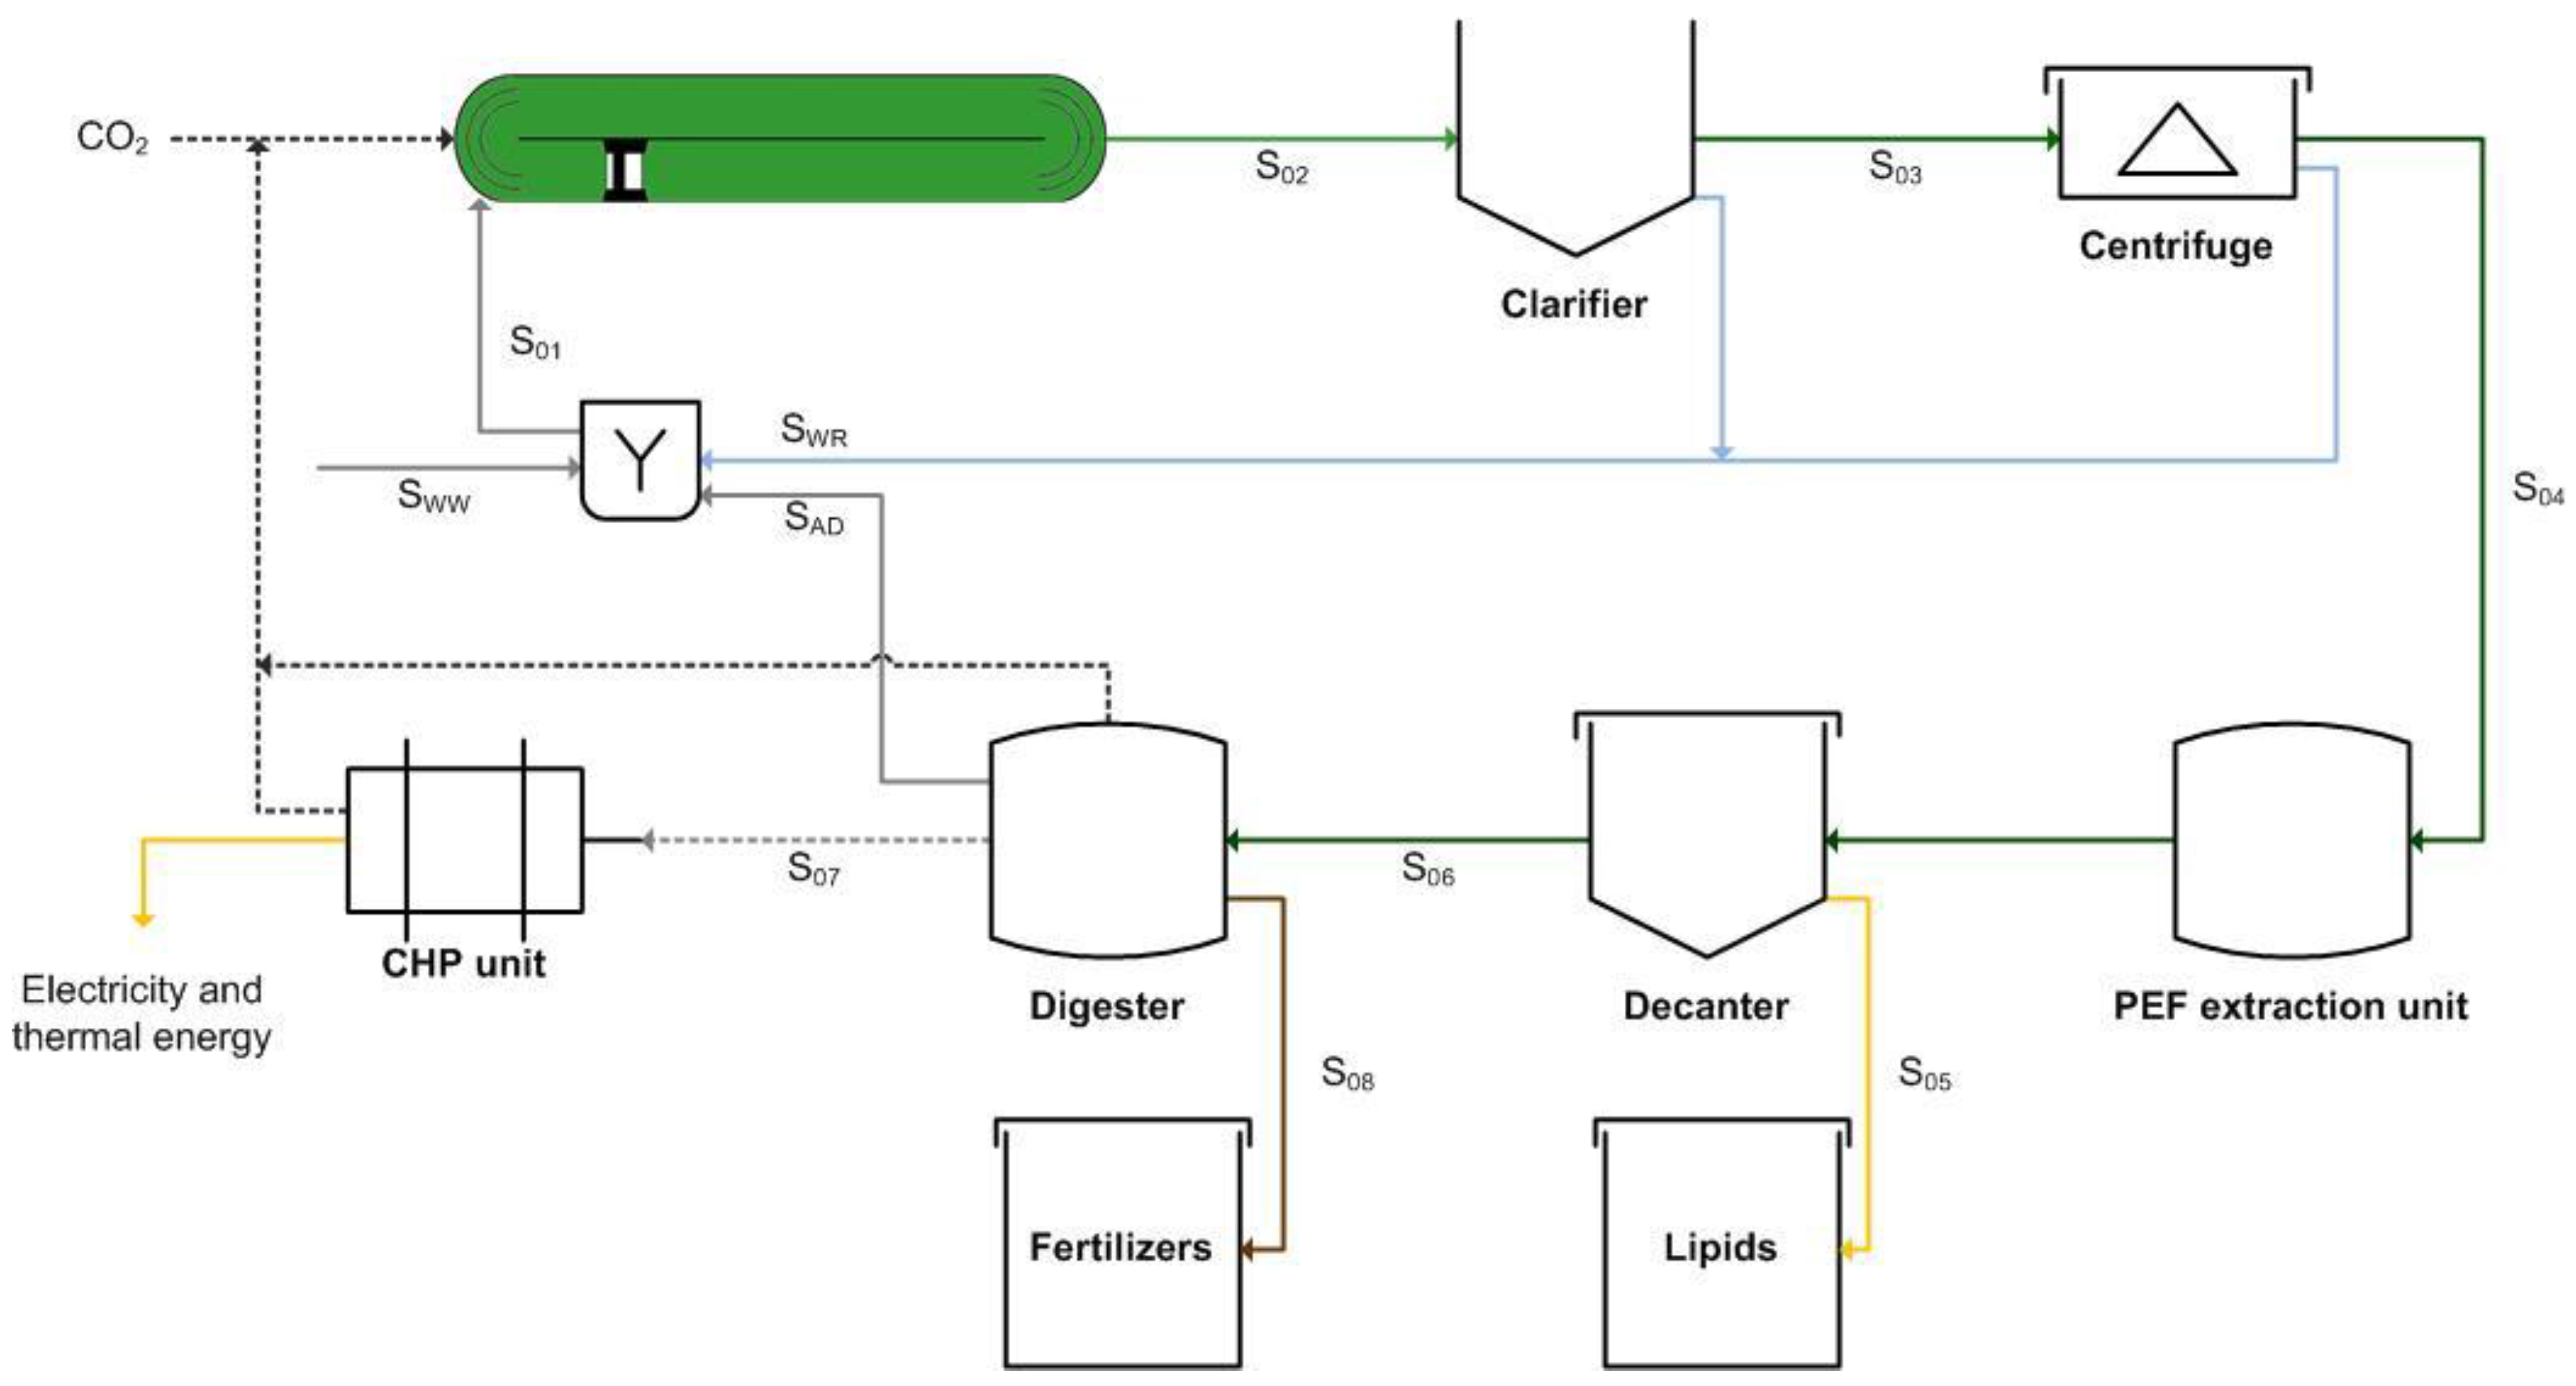
3.1. Process Flowsheet Description

Cultivation of microalgae can be carried out in closed or open bioreactors. Microalgal production in open systems is less expensive in terms of construction and operation and has larger production capacity [35,36,37]. However, biomass productivities achieved with these systems are lower than those achieved with closed systems, which is mainly due to insufficient mixing. Additionally, these systems are more susceptible to the diffusion of CO2 to the atmosphere, evaporative losses of water, poor light utilization by cells, oscillations in the culture conditions and microbial contaminations [36,37,38,39].
As open pond systems are more commonly used for commercial scale applications [35,40,41] and lower investment and operational costs (important advantage in bioenergy production) are required, they are proposed in this study for Chlorella vulgaris growth (a fast-growing microalga widely applied in wastewater treatment processes and biofuels production, due to its high biomass productivities and lipid contents and to their high ability for nutrients removal and resistance to contaminations [7,42,43,44]) using domestic wastewater as culture medium ( S W W ). According to Cai et al. [45], nitrogen and phosphorus concentrations typically range between 15–90 and 5–20 mg·L−1, respectively. In this study, nitrogen and phosphorus concentrations in the domestic wastewater were assumed to be 50 and 10 mg·L−1, respectively. To enhance biomass productivities, CO2 can be provided to cultures using flue gases from a thermoelectric power plant and some refinery processes (e.g., steam methane reforming). Microalgal biomass ( S 02 —output stream of open ponds) is then harvested by flocculation in a clarifier ( S 03 ) followed by centrifugation ( S 04 ) to a concentration of about 20% (w/w). To avoid the use of chemicals, cell disruption procedure was the continuous pulsed electric field (PEF) tested for lipids extraction from C. vulgaris by Flisar et al. [46]. The extracted lipids ( S 05 ) will be sold to the biodiesel plant located nearby. The remaining biomass ( S 06 ) is then forwarded to the anaerobic digestion process. The output streams of this process are the following: (i) biogas that is burned in the combined heat and power (CHP) generation unit ( S 07 ); (ii) fertilizer, considered a product of the process ( S 08 ); and (iii) wastewater that is recycled to the open ponds ( S A D ). The process diagram of this plant is presented in Figure 2.

3.2. Scenarios Description

In this study, seven scenarios were considered, characterized by different efficiencies in some of the most important steps of the microalgal facility (see Table 1). In the scenarios 1 (base scenario), 2 and 3, the effect of photosynthetic efficiency (2%, 1% and 3%, respectively) was analysed. These values were already determined for open ponds. Photosynthetic efficiencies achieved in open systems lie between one tenth and one third of the “theoretical” value of 10%, due to several losses [40,47]: (i) inactive photon absorption; (ii) reflection; (iii) respiration; (iv) light saturation; and (v) photo-inhibition [48]. In the scenarios 1, 4 and 5, the efficiency of lipids extraction (75%, 60% and 90%, respectively) was assessed. PEF extraction efficiencies between 60% and 90% have already been reported in the literature [46,49,50]. Since lipids extraction efficiency is easier to control than cell lipid content, this value was assumed to be constant (25%). In the scenarios 1, 6 and 7, the efficiency of anaerobic digestion (45%, 30% and 60%, respectively) was compared, since different studies have reported anaerobic digestion efficiencies within this range of values [51,52].

4. Techno-Economic Assessment

4.1. Mass Balance

The overall process is schematically represented in Figure 2 and the mass balance to the different streams involved in the process is presented in Table 2. Briefly, the process comprises four different steps: (i) microalgal growth; (ii) microalgal harvesting; (iii) combined cell disruption and lipids extraction; and (iv) anaerobic digestion followed by electricity production. The following sections include a description of each step and all the considerations assumed to determine mass balances for each process unit.

4.1.1. Microalgal Growth

The proposed algal facility consists of 25 similar high rate ponds with 0.3 m height, performing a total pond area of 100 ha. These open ponds may operate during diurnal periods, since photosynthetic growth does not occur at night. Therefore, this period may be used for shut down for cleaning and maintenance. Average biomass productivities were determined taking into account the operation time of open ponds, average horizontal light irradiance observed in Sines (Figure 1B) and the assumed photosynthetic efficiencies (1% to 3%). Photosynthetic efficiencies ranging between approximately 1.5% and 4.5% were already reported for C. vulgaris [53]. Accordingly, annual average biomass productivity determined for the base scenario in this region is approximately 16 g m−2·day−1, which is similar to the values determined by Doucha and Lívanský [54] for Chlorella sp. grown in open ponds (25 g m−2·day−1). Considering annual average biomass productivities and the pond volume (3.0 × 10⁵ m3) and considering the average evaporation rate reported in Section 2.1 (0.075 m·month−1), the input stream of water and nutrients ( S 01 ) required for microalgal growth on a daily basis corresponds to 3.5 × 10⁴ m3·day−1 (in the base scenario). This water input is obtained from domestic wastewater ( S W W , 2.4 × 10⁴ m3·day−1), from water recycling ( S W R , 1.1 × 10⁴ m3·day−1) and from water resulting from the anaerobic digestion step ( S A D , 62 m3·day−1). Flow rates of the recycling water ( S W R ) can be regulated to avoid excessive dilution of the cultures in rainy days. Assuming that biomass concentration achieved during the cultivation step is 0.5 g·L−1, biomass flow rate after the cultivation step ( S 02 ) is, in the base scenario, 3.3 × 10⁴ m3·day−1. Input and output streams of microalgal production in the studied scenarios are summarized in Table 2.
As referred before, domestic wastewater will be used as culture medium. Wastewater will provide nutrients, such as nitrogen and phosphorus, to microalgae. On the other hand, CO2 resulting from the thermoelectric power plant and refinery processes will be supplied to the cultures. Taking into account the annual average biomass productivities and the typical molecular formula described for microalgae, CO0.48H1.83N0.11P0.01 [7], theoretical nitrogen, phosphorus and carbon removal rates were estimated. For these determinations, it was assumed that all nitrogen, phosphorus and carbon removed from the wastewater or from the flue gas were incorporated into microalgal biomass. Although the typical molecular formula of microalgal biomass was not determined for C. vulgaris, it has already been applied by several authors to determine C, N and P removal rates by microalgae from the genus Chlorella [55,56,57]. Considering the base scenario, nitrogen, phosphorus and carbon removal rates are 1.1, 0.22 and 8.43 g·m−2·day−1. With these values, minimum concentrations of these nutrients required in the feed stream were determined. Accordingly, for the same scenario, minimum nitrogen and phosphorus concentrations in the feed stream are 31 and 6.2 mg·L−1, respectively, whereas CO2 requirements correspond to 39 t·day−1. Table 3 presents average removal rates determined for nitrogen, phosphorus and carbon in the studied scenarios, as well as minimum required concentrations of these nutrients.

4.1.2. Microalgal Harvesting

The proposed harvesting techniques for this study include a pre-concentration step through flocculation followed by centrifugation, where biomass concentration achieved was assumed to be 200 g·L−1 [48,58]. The use of a pre-concentration step aims the reduction of the flow rate to be processed in the centrifugation step, which may result in significant savings in terms of energy. In the pre-concentration step, flocculation may be induced by the addition of NaOH as flocculant. The amount of flocculant used was assumed to be 9 mg·g−1biomass, as reported by Vandamme [59]. In the last step, a harvesting efficiency of 95% was also assumed. Harvesting efficiencies higher than 94% were obtained in different studies, when applying centrifugation for the harvesting of microalgal biomass [60,61]. With this harvesting efficiency and the average biomass productivities, the flow rate of the output stream from the centrifugation step ( S 04 ) corresponds to 78 m3·day−1 (in the base scenario).
Knowing the initial composition of the domestic wastewater, as well as elemental composition of microalgae and total biomass collected per harvesting, it is possible to determine effluent composition. Considering that all nitrogen and phosphorus removed from wastewater is incorporated into microalgal biomass, effluent composition in nitrogen and phosphorus (for the studied scenarios) range between 3.2–5.3 and 0.57–1.0 mg·L−1, respectively. Nitrogen and phosphorus concentrations in the resulting effluent are lower than the limits established by EU legislation for the discharge of domestic effluents (15–20 and 1–2 mg·L−1 for nitrogen and phosphorus, respectively) [62,63], which means that the proposed process promotes the efficient treatment of domestic wastewaters.

4.1.3. Cell Disruption and Lipids Extraction

PEF technology is a non-thermal method usually applied in food processing applications for inactivation of microbes, helping to maintain the food quality for human consumption [64,65]. This technique uses short and high voltage pulses, which induce the non-thermal permeabilization of cell membranes and, in determined conditions, the complete disruption of cells into fragments. It is a rapid (treatment time is less than a second), flexible and energy-efficient method (heat is minimized) that avoids the use of organic solvents, usually toxic, thus not affecting the biochemical composition of microalgal biomass [46,64,66]. Regarding microalgal products, PEF is considered to have high potential for the extraction of compounds, due to the low energy consumption, easy scale-up and low operational costs. This extraction method does not use any toxic extraction solvent (not requiring a solvent recovery step) and is highly effective when directly applied to wet feedstocks [49,65,67]. PEF was already applied to extract lipids from C. vulgaris [46,68,69]. It was considered a clean, cheap and quick extraction process, being a promising method for the production of biodiesel and pharmaceutical and dietary products.
Considering the base scenario, presenting a PEF efficiency of 75% [49], total microalgal oil extracted, with a density of 0.86 kg·L−1 [70], corresponds to 3.4 m3·day−1. For the other studied PEF efficiencies, 60% (scenario 4) and 90% (scenario 5), total lipids extracted are 2.7 and 5.1 m3·day−1, respectively. For the base scenario, biodiesel production through transesterification of the extracted lipids results in a biodiesel productivity of 3.0 t·day−1 (3.47 m3·day−1).

4.1.4. Anaerobic Digestion

Biomass resulting from the oil extraction step (75 m3·day−1 in the base scenario) is subjected to anaerobic digestion followed by electricity production. In this step different process efficiencies were evaluated (45%, 30% and 60%). Taking into account the elemental composition of microalgal biomass after lipids extraction and considering that fractions of CH4 and CO2 in the biogas are respectively 60% and 40% (v/v) (typical composition of the biogas consists of 55%–70% CH4 and 30%–45% CO2 [71]), resulting biogas stream in the base scenario has the following composition: 2.3 t·day−1 of CH4 and 4.3 t·day−1 of CO2. Additionally, a residue rich in nitrogen and phosphorus is produced (approximately 7.0 t·day−1 in the base scenario). Due to its high content in nitrogen, this residue can then be used as fertilizer [43].

4.1.5. Net CO2 Balance
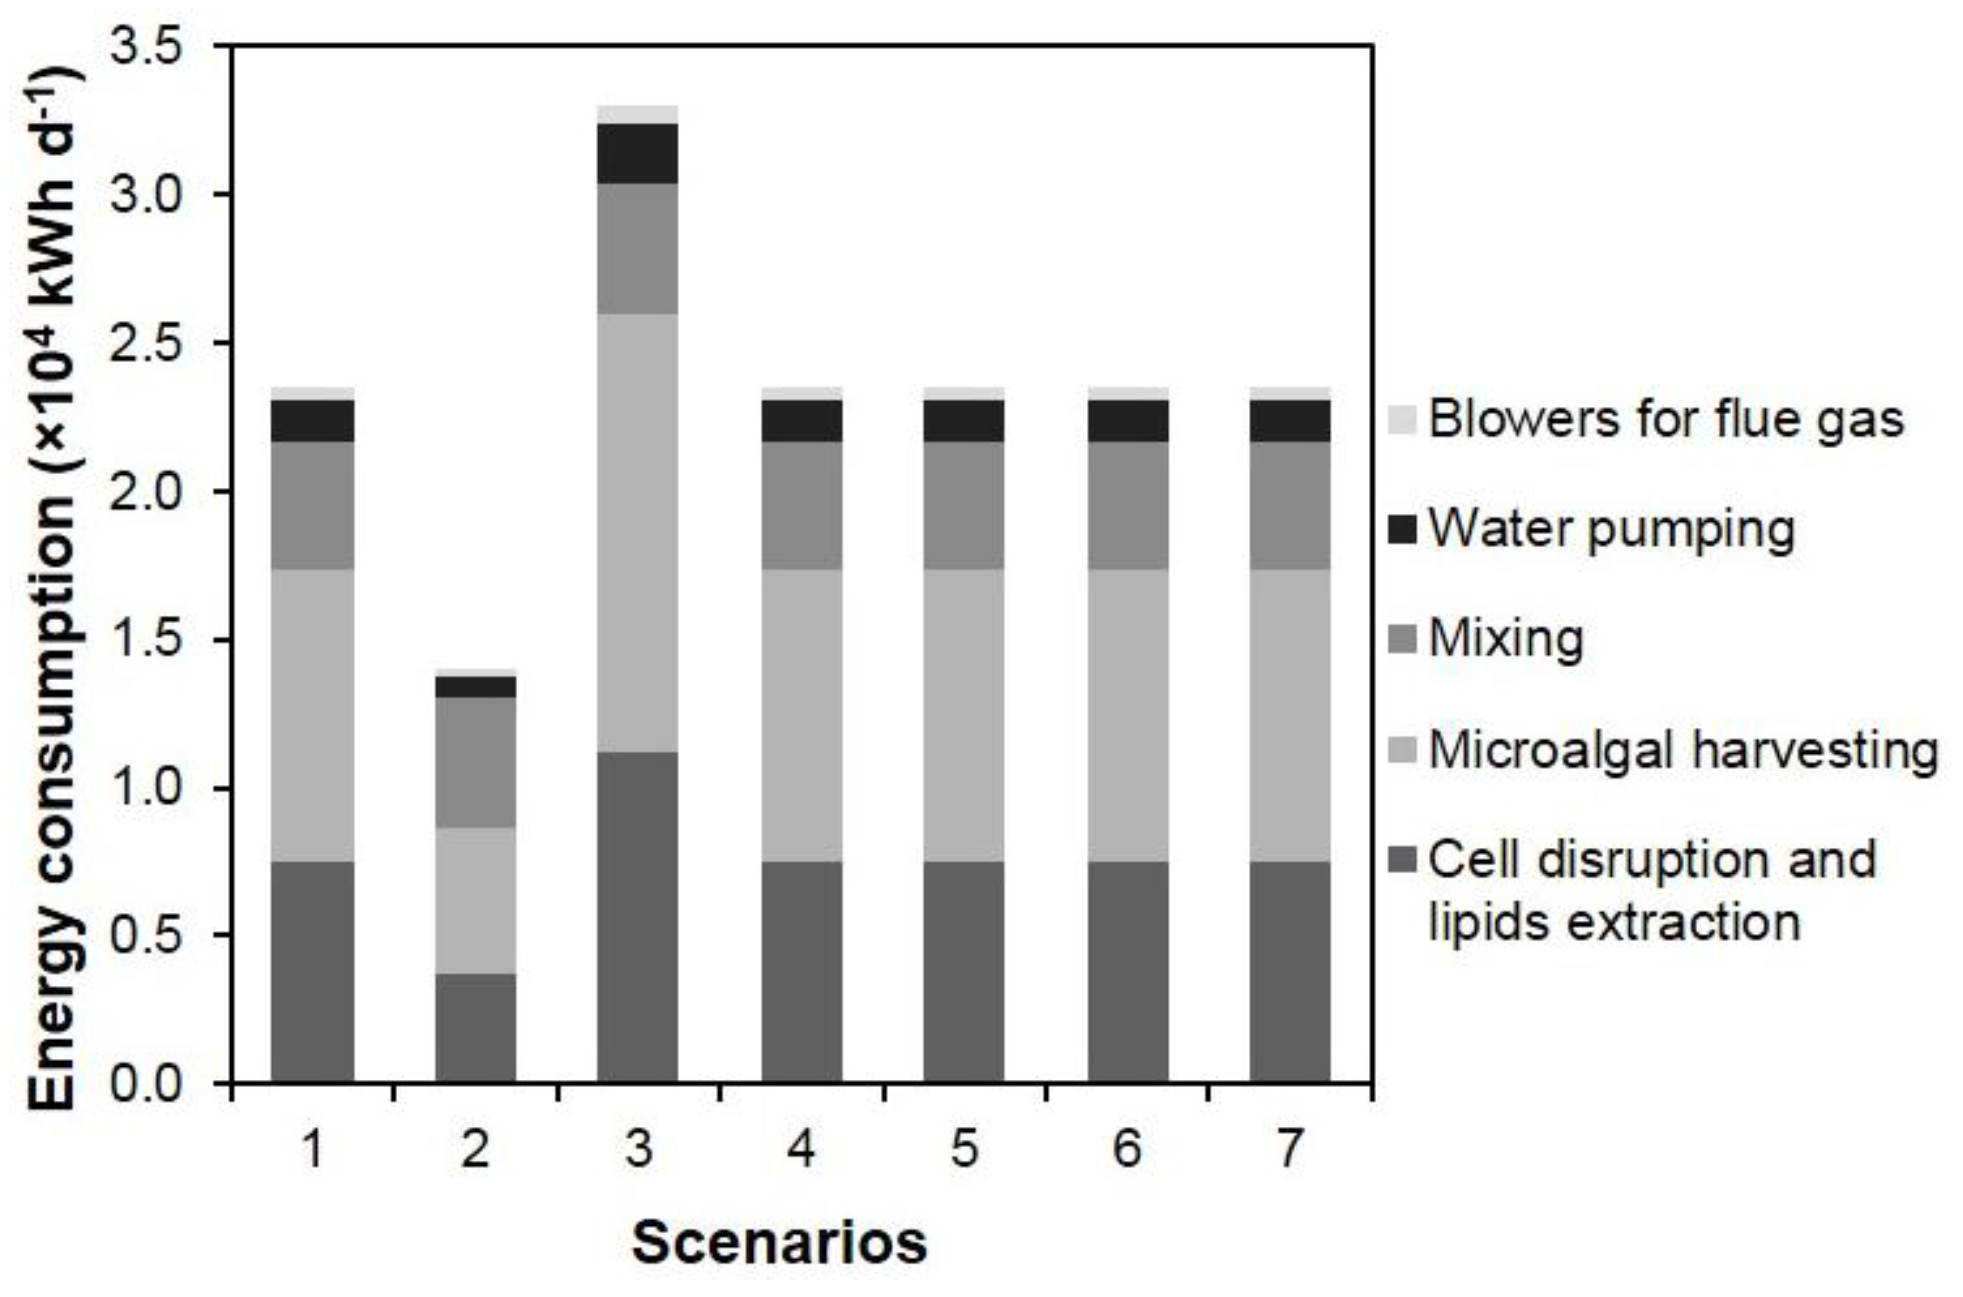
Based on a recent study performed for C. vulgaris [72], the use of a CO2 concentration of about 5% (v/v) was proposed, which has shown to be optimal for microalgal growth. Taking into account the results obtained in this study, it is expected a slight decrease in the pH of the culture to about 6.5, which will not be harmful for microalgae. During this process different CO2 streams are involved. In the cultivation step, CO2 is fed into microalgal cultures at different rates (Table 3), depending on the studied scenarios. On the other hand, anaerobic digestion and electricity production in the CHP generation unit release CO2. Since CO2 will be mainly supplied from the flue gas of a thermoelectric power plant working with natural gas, it is expected that this flue gas presents residual sulphite and nitrite concentrations. Accordingly, there is no need of a purification step prior to addition in the ponds. Considering a CO2 uptake efficiency of 80%, net CO2 balances were determined for the studied scenarios (Table 4).
These results have shown negative values in all the scenarios (net CO2 balances range between −30 and −10 t·day−1), which means that the proposed process is a net zero emission process able to efficiently uptake CO2 from the flue gases of a thermoelectric power plant. Comparing the studied scenarios, it is possible to conclude from Table 4 that the most effective in CO2 uptake is the scenario 3, the one assuming the highest photosynthetic efficiency (3%). In this scenario, annual CO2 uptake corresponds to 1.1 × 10⁴ t.

4.2. Energy Balance

In this process, energy is mainly required in the following steps: microalgal cultivation, microalgal harvesting and cell disruption and lipids extraction. Figure 3 shows the electrical requirements of each of these processes for the studied scenarios.
In the cultivation step, energy is required in three different stages: (i) mixing; (ii) water pumping; and (iii) blowers for flue gas. Considering a mixing velocity of 0.23 m·s−1 and all the head losses occurring in the open ponds (corresponding to head losses around the bends, 0.010 m, through the sumps, 0.026 m, and down the straightaways, 0.11 m), it is possible to determine the power required to overcome all these head losses. Assuming 25 similar open ponds operating at the same time, energy required daily can be determined. Therefore, assuming a 12:12 light:dark period, the total energy required for mixing corresponds to 4.4 × 10³ kWh·day−1. Energy needed in water pumping is calculated based on the flow rate of the input ( S 01 ). Pump and motor efficiencies of 88% and 83% were assumed [73]. Therefore, for the base scenario, a water input of 3.5 × 10⁴ m3·day−1 corresponds to an energy input of 1.4 × 10³ kWh·day−1. Energy required for CO2 distribution was determined based on the CO2 requirements for each studied scenario (Table 3), assuming a CO2 concentration in the flue gas of 5% (v/v). Additionally, air blower efficiency was considered to be 77% [74]. Accordingly, the energy consumption associated to the air blowers was 4.4 × 10² kWh·day−1 for the base scenario.
Energy consumption in biomass harvesting corresponds to the energy required for centrifugation. Accordingly, this value was determined taking into account the flow rate resulting from the pre-concentration step ( S 03 ) and the specific energy consumption, 1.2 kWh·m−3, commonly reported for microalgal harvesting through centrifugation [75]. For the base scenario, the harvesting step corresponds to a power consumption of 9.8 × 10³ kWh·day−1.
Regarding cell disruption and lipids extraction through the continuous PEF method, energy required was determined assuming the specific energy consumption reported by Flisar et al. [46]. According to the authors, the energy required to process 1 L of culture broth for 1 h is 14.4 kJ, which corresponds to 4.0 kW·m−3. Taking into account the flow rates to be processed in this unit ( S 04 ) for each scenario, energy consumption for this step was determined. For the base scenario, an energy input of 7.5 × 10³ kWh·day−1 is required.
Although energy is required in several processes, in the CHP generation unit there is an energetic output composed by electrical (40% of the total energy) and thermal energy (45% of the total energy) [76]. Assuming that the biogas produced by anaerobic digestion of microalgae presents a chemical composition similar to the one obtained from household waste, inferior and superior calorific power correspond to 6.0 and 6.6 kWh·m−3, respectively [77]. With the flow rates resulting from the anaerobic digestion process ( S 07 ) for each scenario and considering an average value between inferior and superior calorific power, values for electrical and thermal energy produced were determined. Considering the base scenario, total electrical and thermal energy produced is 1.4 × 10⁴ and 1.6 × 10⁴ kWh·day−1, respectively.
The energy balance performed to the microalgal facility allowed the evaluation of the energetic performance for each of the studied scenarios (Table 5). Analysing the ratio between the energy produced by the microalgal facility (corresponding to the energy obtained from the extracted lipids and the one obtained in the CHP generation unit) and the total energy required, the energy returned on energy invested (EROEI) was determined. For all studied scenarios, EROEI was higher than one, which means that the studied scenarios are energetically efficient. With an EROEI of 3.0, the scenario 7, which assumes an anaerobic digestion efficiency of 60%, is the most efficient in terms of energy.

4.3. Economic Assessment

The economic analysis of an industrial process should take into account the investment capital, also known as fixed capital, as well as annual production costs and annual revenues. With these parameters, it is possible to determine the economic viability of the project. Therefore, the next sections present a detailed economic analysis of the proposed system of wastewater treatment and energy production (electricity and biofuels) using microalgae.

4.3.1. Fixed Capital

Fixed capital is the total investment cost needed to create the facility. It includes the equipment acquisition and installation costs, piping and electrical costs and also the costs of buildings, yard improvements, service facilities and land. Acquisition costs were determined for almost all the equipment required in this process: high rate pond, air blowers, clarifier, centrifuge, decanter, digester and CHP generation unit (Table 6).
These costs were defined according to values already reported in the literature for different years and were normalized to 2014 cost basis, using the Chemical Engineering Plant Cost Index, I, according to Equation (1):
Cost = Base cost I I base
For the studied scenarios, total acquisition costs determined ranged between 5.7 and 6.3 million euros. This value was obtained assuming that the estimated costs account for 90% of total purchase costs. The correct estimation of total capital investment should also include cost factors associated to direct and indirect costs (Table 7).
In the direct costs, typical factors that should be considered are: (i) installation costs; (ii) instrumentation and control; (iii) piping; (iv) electrical equipment and materials; (v) buildings; (vi) yard improvements; and (vii) service facilities. Indirect costs comprise engineering and supervision, construction expenses, contractor’s fee and contingency [81]. These factors typically represent a fraction of the total purchase costs. Including these factors in the calculus of fixed capital results in a total capital investment between 14.4 and 15.8 million euros (Table 7). For the studied scenarios, this value is mainly influenced by the expenses associated to the acquisition costs, followed by those associated to engineering and supervision, equipment installation, piping and service facilities.

4.3.2. Annual Production Costs

To evaluate the economic viability of a project, it is also necessary to determine the annual production costs, which are presented in detail in Table 8. These costs include variable and fixed costs. Variable costs oscillate according to productivity rates. In this study, these costs comprise raw materials, miscellaneous materials, utilities, such as electricity and steam, costs associated to the pre-concentration step with NaOH and to PEF extraction and shipping and packaging. On the other hand, fixed costs are constant and do not oscillate with productivity rates. In these costs are included maintenance, operating labour, laboratory costs, supervision, plant overheads, insurance, local taxes and royalties. Normally, estimation of these costs is done by attributing a percentage of fixed capital or other variables to each of the referred parameters [82].
In this case-study, it was assumed that raw materials costs were negligible because all the process requirements can be found in the local site of the facility: nutrients are supplied in the domestic wastewater that is daily fed into the algal ponds and CO2 is obtained from flue gas emissions from the thermoelectric power plant located in Sines and from the anaerobic digestion and combined heat and power generation processes. Regarding the utilities, electrical energy was considered the most important one. According to the energetic balance, total energy required oscillates between the studied scenarios, being 2.3 × 10⁴ kWh·day−1 in the base scenario. Considering electricity costs of 0.10 € kWh−1 [81], total annual costs for utilities are, for the base scenario, 857 thousand euros. Assuming NaOH requirements of 9 mg·g−1biomass and NaOH costs of 0.682 USD·kg−1 [83], the costs associated to the pre-concentration step were determined. Production costs for PEF extraction were determined assuming lipids extraction costs of 10 €·t−1 [84]. Operating labour costs were calculated assuming 10 operators with an average salary per month of 1000 €. The other parameters were determined basing on the percentages proposed by Sinnott and Towler [82] and showed in Table 8. Resulting annual production costs are, for the base scenario, approximately 3.0 million euros.

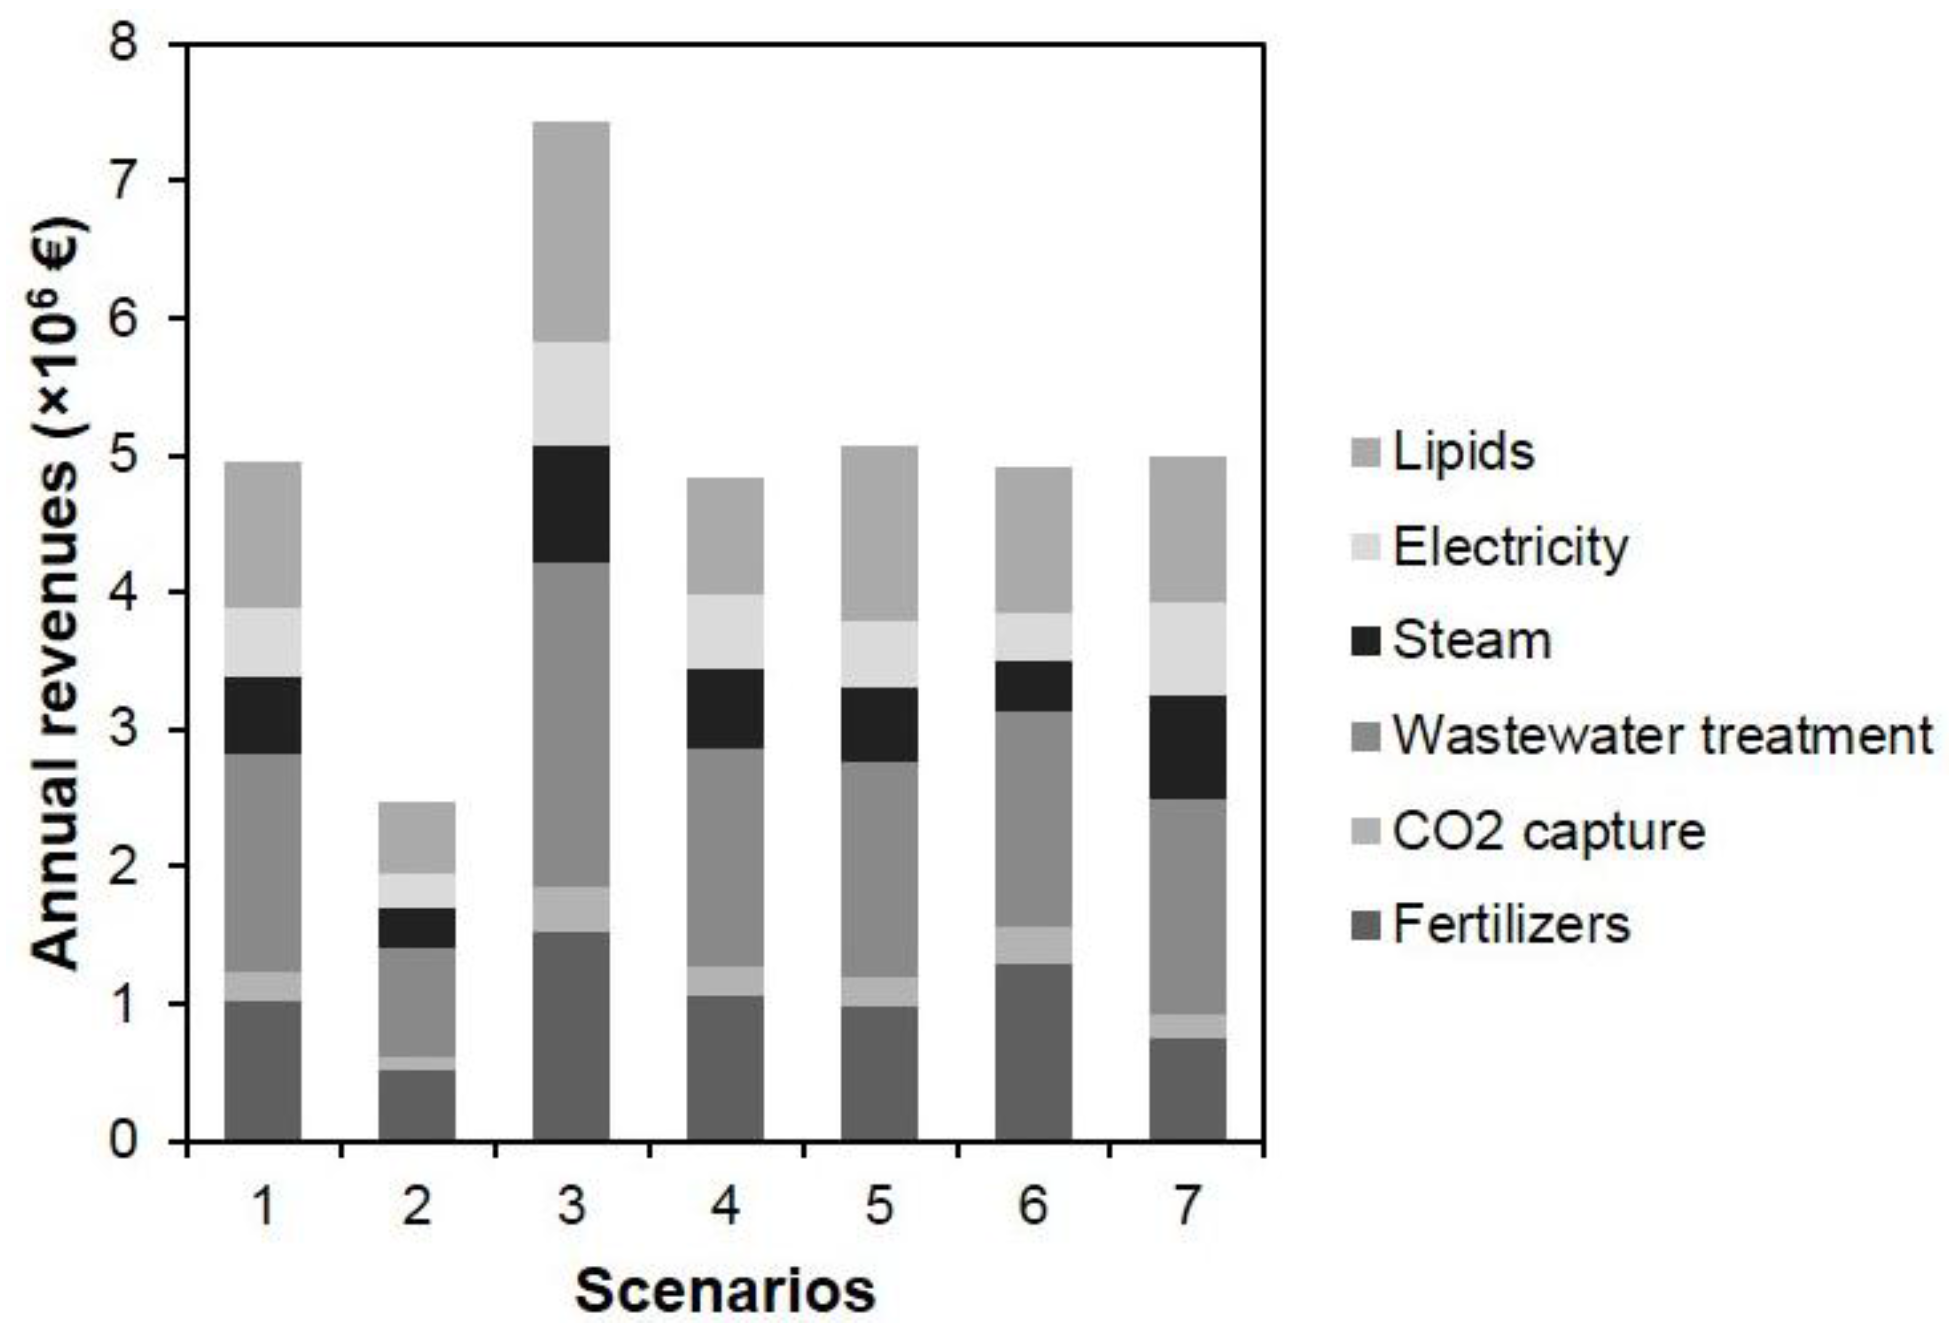
4.3.3. Annual Revenues

Although the major aims of this process are the production of lipids and energy (both electrical and thermal), credits from wastewater treatment, CO2 capture and from the production of an N-rich residue that can be used as fertilizer should also be considered.
Therefore, considering lipids sales of 1 €·kg−1, electricity and steam sales of 0.10 €·kWh−1 [81], a credit of 3.50 €·kg−1 of nitrogen removed and 2.40 €·kg−1 of phosphorus removed [76], a credit of 30 € t−1 of CO2 captured [85] and an income from fertilizers sales of 0.40 €·kg−1 [79], total annual revenues for the studied scenarios oscillate between 2.5 and 7.4 million euros (Figure 4), being the best scenario, the one assuming a photosynthetic efficiency of 3% (scenario 3), and the worst, the one considering a photosynthetic efficiency of 1% (scenario 2). The other studied scenarios have shown similar annual revenues of about 5.0 million euros.

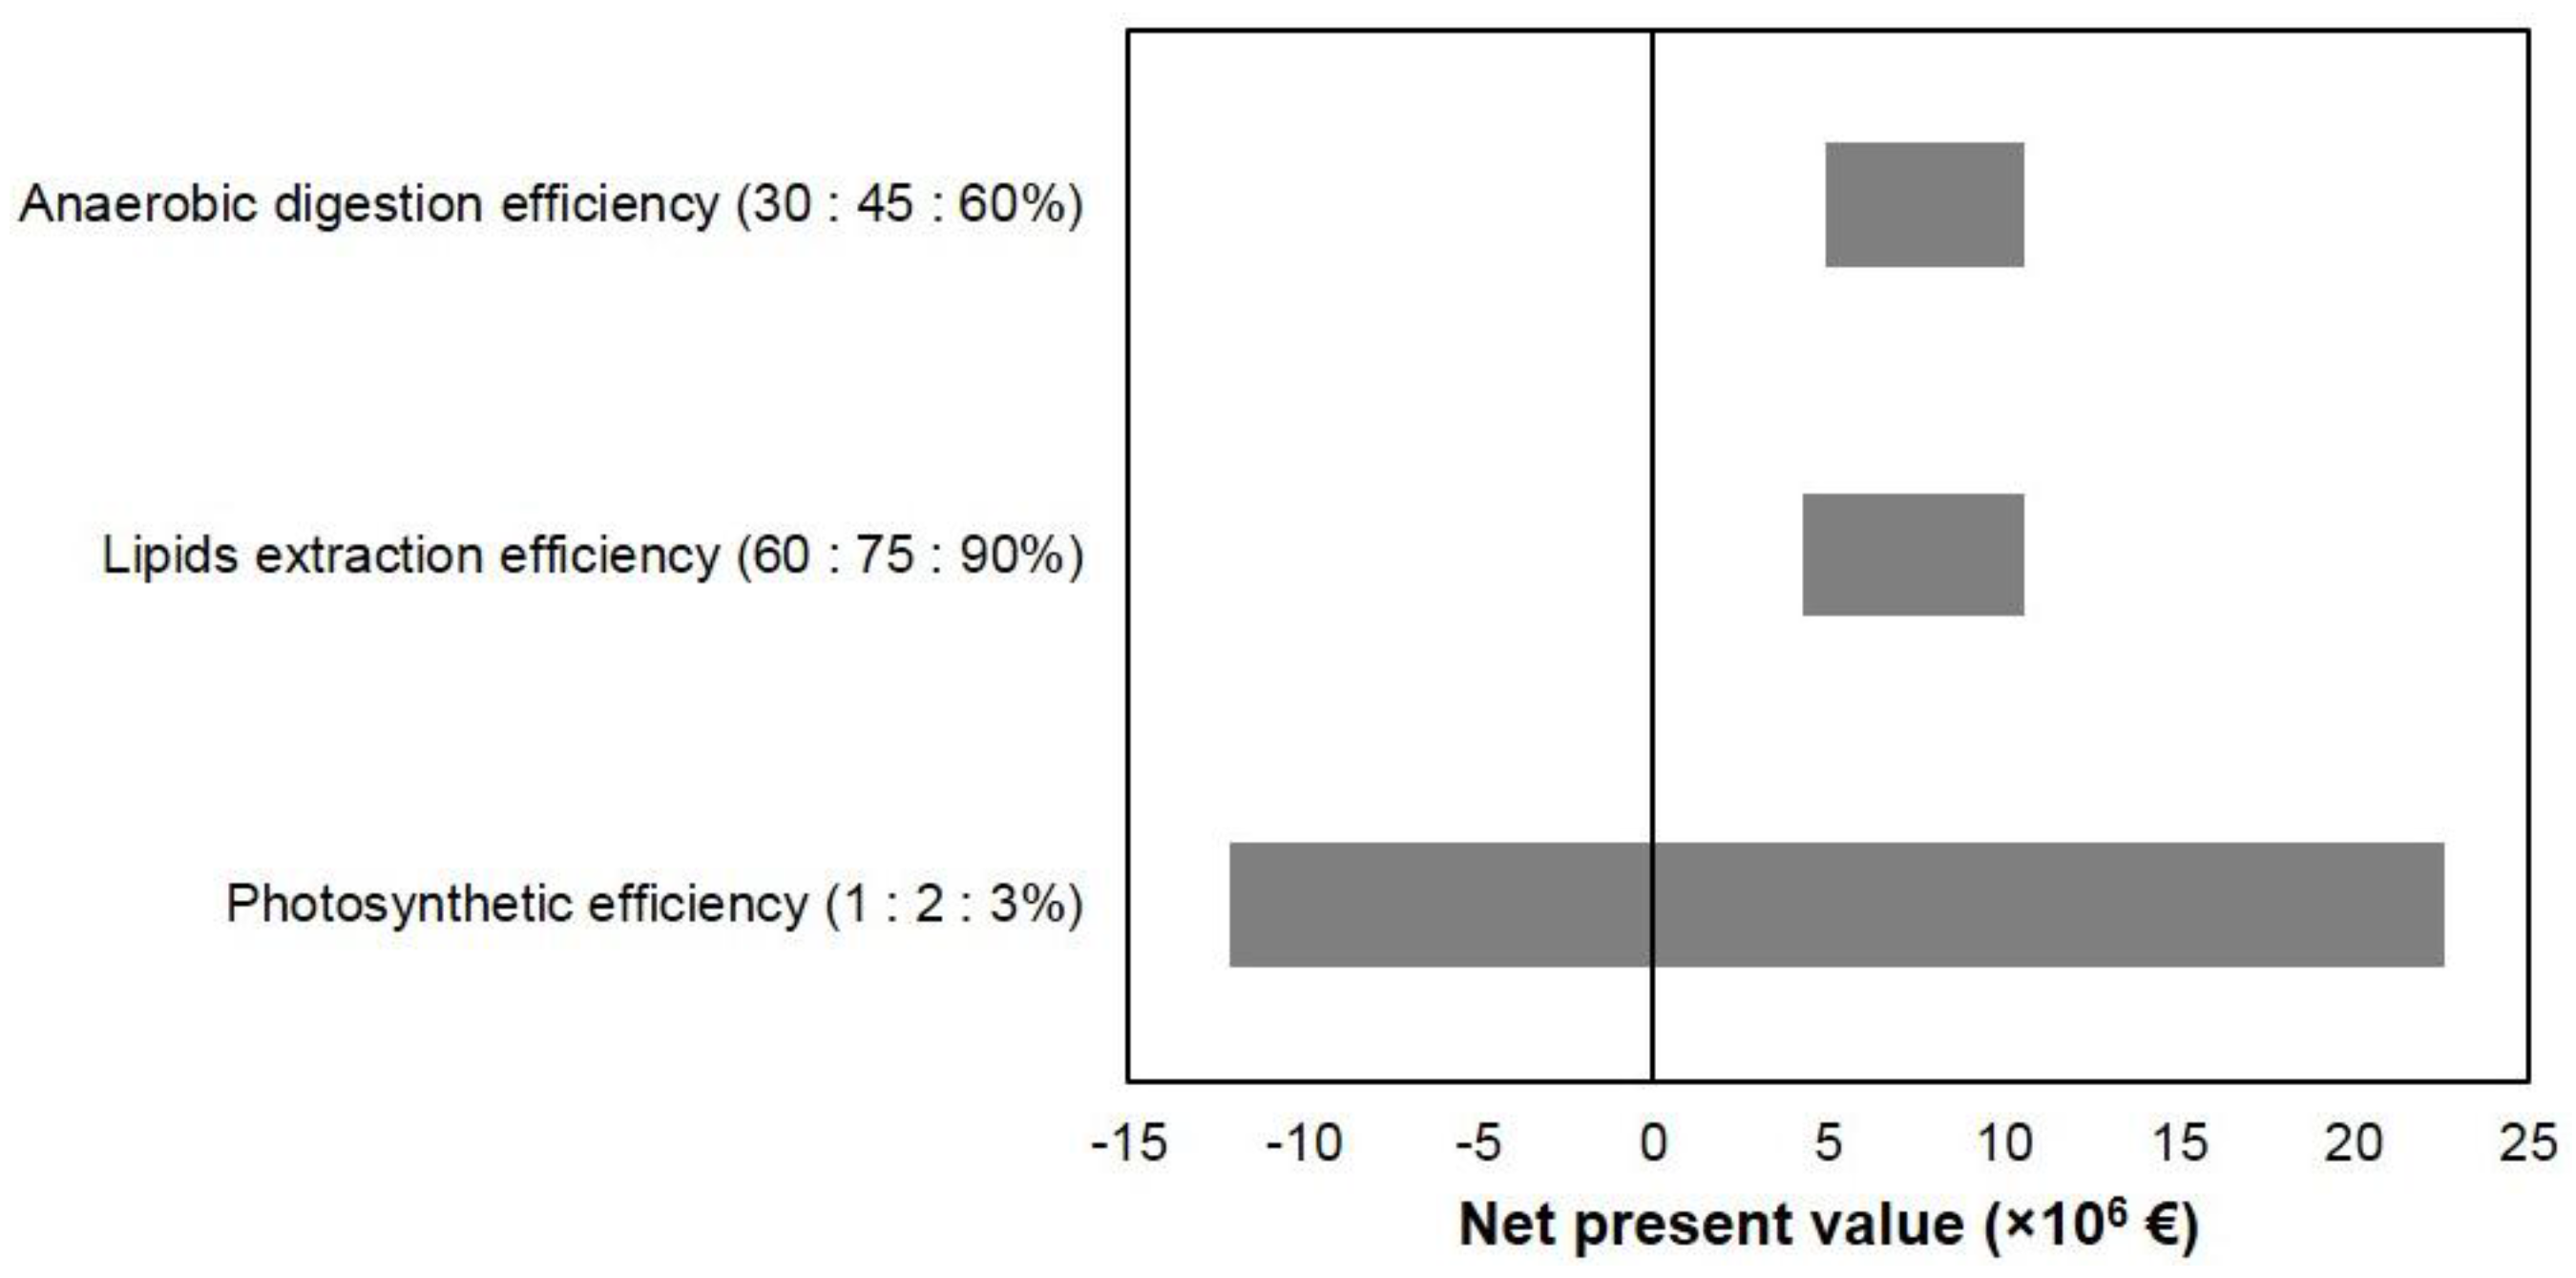
4.3.4. Economic Viability

The viability of a project can be evaluated through the determination of net present value (NPV) and internal rate of return (IRR). NPV is the sum of present values of the individual cash-flows (revenues minus costs). When NPV is positive, the viability of the project is ensured because it implies that net income is higher than costs. On the other hand, IRR is the rate of return that makes NPV of all cash flows (both positive and negative) from a particular investment equals to zero. In other words, IRR is the minimum interest value for which there is no income, but there are no other costs. Therefore, a project is economically feasible when this value is higher than the interest rate, so that revenues are higher than costs [86].
NPV and IRR were determined for the process here described, assuming a 10% interest rate and a 30-year bond to fund the facility construction (Table 9). According to these values, it is possible to state that the project is economically viable for all the studied scenarios (except the scenario 2), as they present a positive NPV, ranging between 4.3 and 22.6 million euros. However, the best scenario is the third one (which assumes a photosynthetic efficiency of 3%), since the IRR determined for this scenario (26%) is much higher than the assumed interest rate. Additionally, a payback time of about 4 years was determined for this scenario, whereas for the other studied scenarios payback times determined range between 7 and 8 years. These results indicate that at the end of the 30-year bond term, this project would be fully amortized and debt-free for these scenarios.
Taking into account the NPV obtained in each of the studied scenarios, a sensitivity analysis was performed to evaluate which are the crucial conditions for an economically viable process (Figure 5). Analysis of Figure 5 shows that photosynthetic efficiency is the most important factor influencing NPV: for photosynthetic efficiencies ranging between 1% and 3%, NPV oscillates between −12.1 and 22.6 million euros.
Regarding the other assumptions considered, lipids extraction and anaerobic digestion efficiencies, the evaluated ranges have not strongly influenced NPV, being these values positive for all studied scenarios. For lipids extraction efficiencies ranging between 60% and 90%, NPV obtained, ranged between 4.3 and 6.3 million euros. On the other hand, anaerobic digestion efficiencies between 30% and 60% have resulted in NPV of 4.9 and 5.6 million euros.

5. Conclusions

This study presents an economically viable process of microalgal production in Portugal concerning wastewater treatment, CO2 emission saving and bioenergy production purposes. For this process, seven scenarios were considered, assuming different efficiencies in some of the most important steps of microalgal processing. From the considered scenarios, six were economically viable. From those, the one assuming a photosynthetic efficiency of 3%, a lipids extraction efficiency of 75% and an anaerobic digestion efficiency of 45% (scenario 3) was considered the most effective in terms of: (i) CO2 uptake (1.1 × 10⁴ t per year); (ii) energy production (annual energy produced was 1.6 × 10⁷ kWh and annual lipids productivity was 1.9 × 10³ m3); and (iii) economic viability (NPV of 22.6 million euros with an IRR of 26% and a payback time of 4 years). In addition, since this project assumes the use of domestic wastewater as culture medium, this scenario is also effective in nitrogen and phosphorus removal, processing 1.9 × 10⁷ m3 of wastewater per year.

Acknowledgments

This work was financially supported by: Project UID/EQU/00511/2013-LEPABE (Laboratory for Process Engineering, Environment, Biotechnology and Energy—EQU/00511) by FEDER funds through Programa Operacional Competitividade e Internacionalização—COMPETE2020 and by national funds through FCT—Fundação para a Ciência e a Tecnologia; SFRH/BD/88799/2012 and FEUP-ON2-26-FM-Eng Sistemas.

Author Contributions

Ana L. Gonçalves performed the techno-economic assessment and wrote the manuscript; Maria C. M. Alvim-Ferraz helped in manuscript revision; Fernando G. Martins helped in the economic assessment and manuscript revision; Manuel Simões helped in manuscript revision; José C. M. Pires conceived and designed this study and helped in the mass and energetic balances and in manuscript revision.

Conflicts of Interest

The authors declare no conflict of interest.

References

  1. Trends in Atmospheric Carbon Dioxide. Available online: http://www.esrl.noaa.gov/gmd/ccgg/trends/ (accessed on 19 February 2016).
  2. Allen, M.R.; Frame, D.J.; Huntingford, C.; Jones, C.D.; Lowe, J.A.; Meinshausen, M.; Meinshausen, N. Warming caused by cumulative carbon emissions towards the trillionth tonne. Nature 2009, 458, 1163–1166. [Google Scholar] [CrossRef] [PubMed]
  3. Moss, R.H.; Edmonds, J.A.; Hibbard, K.A.; Manning, M.R.; Rose, S.K.; van Vuuren, D.P.; Carter, T.R.; Emori, S.; Kainuma, M.; Kram, T. The next generation of scenarios for climate change research and assessment. Nature 2010, 463, 747–756. [Google Scholar] [CrossRef] [PubMed]
  4. Rockström, J.; Steffen, W.; Noone, K.; Persson, Å.; Chapin, F.S.; Lambin, E.F.; Lenton, T.M.; Scheffer, M.; Folke, C.; Schellnhuber, H.J. A safe operating space for humanity. Nature 2009, 461, 472–475. [Google Scholar] [CrossRef] [PubMed]
  5. Bilanovic, D.; Andargatchew, A.; Kroeger, T.; Shelef, G. Freshwater and marine microalgae sequestering of CO2 at different C and N concentrations—Response surface methodology analysis. Energy Conv. Manag. 2009, 50, 262–267. [Google Scholar] [CrossRef]
  6. Sayre, R. Microalgae: The potential for carbon capture. Bioscience 2010, 60, 722–727. [Google Scholar] [CrossRef]
  7. Chisti, Y. Biodiesel from microalgae. Biotechnol. Adv. 2007, 25, 294–306. [Google Scholar] [CrossRef] [PubMed]
  8. Clarens, A.F.; Resurreccion, E.P.; White, M.A.; Colosi, L.M. Environmental life cycle comparison of algae to other bioenergy feedstocks. Environ. Sci. Technol. 2010, 44, 1813–1819. [Google Scholar] [CrossRef] [PubMed]
  9. Gonçalves, A.L.; Pires, J.C.; Simões, M. Green fuel production: Processes applied to microalgae. Environ. Chem. Lett. 2013, 11, 315–324. [Google Scholar] [CrossRef]
  10. Lee, A.K.; Lewis, D.M.; Ashman, P.J. Energy requirements and economic analysis of a full-scale microbial flocculation system for microalgal harvesting. Chem. Eng. Res. Des. 2010, 88, 988–996. [Google Scholar] [CrossRef]
  11. Rawat, I.; Ranjith Kumar, R.; Mutanda, T.; Bux, F. Dual role of microalgae: Phycoremediation of domestic wastewater and biomass production for sustainable biofuels production. Appl. Energy 2011, 88, 3411–3424. [Google Scholar] [CrossRef]
  12. Yang, J.; Li, X.; Hu, H.; Zhang, X.; Yu, Y.; Chen, Y. Growth and lipid accumulation properties of a freshwater microalga, Chlorella ellipsoidea YJ1, in domestic secondary effluents. Appl. Energy 2011, 88, 3295–3299. [Google Scholar] [CrossRef]
  13. Lin, L.; Chan, G.; Jiang, B.; Lan, C. Use of ammoniacal nitrogen tolerant microalgae in landfill leachate treatment. Waste Manag. 2007, 27, 1376–1382. [Google Scholar] [CrossRef] [PubMed]
  14. Mustafa, E.-M.; Phang, S.-M.; Chu, W.-L. Use of an algal consortium of five algae in the treatment of landfill leachate using the high-rate algal pond system. J. Appl. Phycol. 2012, 24, 953–963. [Google Scholar] [CrossRef]
  15. González, L.E.; Cañizares, R.O.; Baena, S. Efficiency of ammonia and phosphorus removal from a Colombian agroindustrial wastewater by the microalgae Chlorella vulgaris and Scenedesmus dimorphus. Bioresour. Technol. 1997, 60, 259–262. [Google Scholar] [CrossRef]
  16. Lefebvre, S.; Hussenot, J.; Brossard, N. Water treatment of land-based fish farm effluents by outdoor culture of marine diatoms. J. Appl. Phycol. 1996, 8, 193–200. [Google Scholar] [CrossRef]
  17. Chojnacka, K.; Chojnacki, A.; Górecka, H. Trace element removal Spirulina sp. from copper smelter and refinery effluents. Hydrometallurgy 2004, 73, 147–153. [Google Scholar] [CrossRef]
  18. Woertz, I.; Feffer, A.; Lundquist, T.; Nelson, Y. Algae grown on dairy and municipal wastewater for simultaneous nutrient removal and lipid production for biofuel feedstock. J. Environ. Eng. 2009, 135, 1115–1122. [Google Scholar] [CrossRef]
  19. Boelee, N.C.; Temmink, H.; Janssen, M.; Buisman, C.J.N.; Wijffels, R.H. Nitrogen and phosphorus removal from municipal wastewater effluent using microalgal biofilms. Water Res. 2011, 45, 5925–5933. [Google Scholar] [CrossRef] [PubMed]
  20. Park, J.B.K.; Craggs, R.J.; Shilton, A.N. Wastewater treatment high rate algal ponds for biofuel production. Bioresour. Technol. 2011, 102, 35–42. [Google Scholar] [CrossRef] [PubMed]
  21. Silva-Benavides, A.; Torzillo, G. Nitrogen and phosphorus removal through laboratory batch cultures of microalga Chlorella vulgaris and cyanobacterium Planktothrix isothrix grown as monoalgal and as co-cultures. J. Appl. Phycol. 2012, 24, 267–276. [Google Scholar] [CrossRef]
  22. Benemann, J.R. Hydrogen production by microalgae. J. Appl. Phycol. 2000, 12, 291–300. [Google Scholar] [CrossRef]
  23. Singh, S.; Kate, B.; Banerjee, U. Bioactive compounds from cyanobacteria and microalgae: An overview. Crit. Rev. Biotechnol. 2005, 25, 73–95. [Google Scholar] [CrossRef] [PubMed]
  24. Spolaore, P.; Joannis-Cassan, C.; Duran, E.; Isambert, A. Commercial applications of microalgae. J. Biosci. Bioeng. 2006, 101, 87–96. [Google Scholar] [CrossRef] [PubMed] [Green Version]
  25. Falkouski, P.G.; Raven, J.A. Aquatic Photosynthesis, 2nd ed.; Princeton University Press: Princeton, NJ, USA, 2007; pp. 5–21. [Google Scholar]
  26. Pires, J.C.M.; Alvim-Ferraz, M.C.M.; Martins, F.G.; Simões, M. Wastewater treatment to enhance the economic viability of microalgae culture. Environ. Sci. Pollut. Res. 2013, 20, 5096–5105. [Google Scholar] [CrossRef] [PubMed]
  27. Richardson, J.W.; Johnson, M.D.; Zhang, X.; Zemke, P.; Chen, W.; Hu, Q. A financial assessment of two alternative cultivation systems and their contributions to algae biofuel economic viability. Algal Res. 2014, 4, 96–104. [Google Scholar] [CrossRef]
  28. Slegers, P.; Leduc, S.; Wijffels, R.; van Straten, G.; van Boxtel, A. Logistic analysis of algae cultivation. Bioresour. Technol. 2015, 179, 314–322. [Google Scholar] [CrossRef] [PubMed]
  29. Venteris, E.R.; McBride, R.C.; Coleman, A.M.; Skaggs, R.L.; Wigmosta, M.S. Siting algae cultivation facilities for biofuel production in the United States: Trade-offs between growth rate, site constructability, water availability, and infrastructure. Environ. Sci. Technol. 2014, 48, 3559–3566. [Google Scholar] [CrossRef] [PubMed]
  30. Densidade Populacional Segundo os Censos em Portugal. Available online: http://www.pordata.pt/Portugal/Densidade+populacional+segundo+os+Censos-412 (accessed on 5 March 2013). (In Portugese)
  31. Kumar, A.; Ergas, S.; Yuan, X.; Sahu, A.; Zhang, Q.; Dewulf, J.; Malcata, F.X.; van Langenhove, H. Enhanced CO2 fixation and biofuel production via microalgae: Recent developments and future directions. Trends Biotechnol. 2010, 28, 371–380. [Google Scholar] [CrossRef] [PubMed]
  32. Photovoltaic Geographical Information system—Incident Global Irradiation. Available online: http://re.jrc.ec.europa.eu/pvgis/apps4/pvest.php (accessed on 20 Jaunary 2013).
  33. Rodrigues, C.M.M. Cálculo da evaporação de albufeiras de grande regularização do sul de Portugal. Ph.D. Thesis, Universidade de Évora, Évora, Portugal, October 2009. [Google Scholar]
  34. Chazarra, A.; Barceló, A.M.; Pires, V.; Cunha, S.; Mendes, M.; Neto, J. Iberian Climate Atlas—Air Temperature and Precipitation (1971–2000); AEMET-IM—Agencia Estatal de Meteorología de España and Instituto de Meteorologia de Portugal: Madrid, Spain, 2001. [Google Scholar]
  35. Borowitzka, M.A. Commercial production of microalgae: Ponds, tanks, and fermenters. Prog. Ind. Microbiol. 1999, 35, 313–321. [Google Scholar] [CrossRef]
  36. Posten, C.; Schaub, G. Microalgae and terrestrial biomass as source for fuels—A process view. J. Biotechnol. 2009, 142, 64–69. [Google Scholar] [CrossRef] [PubMed]
  37. Pulz, O. Photobioreactors: Production systems for phototrophic microorganisms. Appl. Microbiol. Biotechnol. 2001, 57, 287–293. [Google Scholar] [PubMed]
  38. Lee, Y.-K. Microalgal mass culture systems and methods: their limitation and potential. J. Appl. Phycol. 2001, 13, 307–315. [Google Scholar] [CrossRef]
  39. Ugwu, C.; Aoyagi, H.; Uchiyama, H. Photobioreactors for mass cultivation of algae. Bioresour. Technol. 2008, 99, 4021–4028. [Google Scholar] [CrossRef] [PubMed]
  40. Jiménez, C.; Cossı́o, B.R.; Labella, D.; Niell, F.X. The feasibility of industrial production of Spirulina (Arthrospira) in Southern Spain. Aquaculture 2003, 217, 179–190. [Google Scholar] [CrossRef]
  41. Tredici, M.R.; Materassi, R. From open ponds to vertical alveolar panels: The Italian experience in the development of reactors for the mass cultivation of phototrophic microorganisms. J. Appl. Phycol. 1992, 4, 221–231. [Google Scholar] [CrossRef]
  42. Lardon, L.; Hélias, A.; Sialve, B.; Steyer, J.-P.; Bernard, O. Life-cycle assessment of biodiesel production from microalgae. Environ. Sci. Technol. 2009, 43, 6475–6481. [Google Scholar] [CrossRef] [PubMed]
  43. Mata, T.M.; Melo, A.C.; Simões, M.; Caetano, N.S. Parametric study of a brewery effluent treatment by microalgae Scenedesmus obliquus. Bioresour. Technol. 2012, 107, 151–158. [Google Scholar] [CrossRef] [PubMed]
  44. Wang, L.; Min, M.; Li, Y.; Chen, P.; Chen, Y.; Liu, Y.; Wang, Y.; Ruan, R. Cultivation of green algae Chlorella sp. in different wastewaters from municipal wastewater treatment plant. Appl. Biochem. Biotechnol. 2010, 162, 1174–1186. [Google Scholar] [CrossRef] [PubMed]
  45. Cai, T.; Park, S.Y.; Li, Y.B. Nutrient recovery from wastewater streams by microalgae: Status and prospects. Renew. Sust. Energy Rev. 2013, 19, 360–369. [Google Scholar] [CrossRef]
  46. Flisar, K.; Meglic, S.H.; Morelj, J.; Golob, J.; Miklavcic, D. Testing a prototype pulse generator for a continuous flow system and its use for E. coli inactivation and microalgae lipid extraction. Bioelectrochemistry 2014, 100, 44–51. [Google Scholar] [CrossRef] [PubMed]
  47. Norsker, N.-H.; Barbosa, M.J.; Vermuë, M.H.; Wijffels, R.H. Microalgal production—A close look at the economics. Biotechnol. Adv. 2011, 29, 24–27. [Google Scholar] [CrossRef] [PubMed]
  48. Williams, P.J.L.B.; Laurens, L.M.L. Microalgae as biodiesel & biomass feedstocks: Review & analysis of the biochemistry, energetics & economics. Energy Environ. Sci. 2010, 3, 554–590. [Google Scholar]
  49. Joannes, C.; Sipaut, C.; Dayou, J.; Yasir, S.; Mansa, R. Review Paper on Cell Membrane Electroporation of Microalgae Using Electric Field Treatment Method for Microalgae Lipid Extraction. In Proceedings of the 9th CUTSE International Conference, Miri, Sarawak, Malaysia, 3–4 December 2014; IOP Publishing: Miri, Sarawak, Malaysia, 2015. [Google Scholar]
  50. Show, K.-Y.; Lee, D.-J.; Tay, J.-H.; Lee, T.-M.; Chang, J.-S. Microalgal drying and cell disruption—Recent advances. Bioresour. Technol. 2015, 184, 258–266. [Google Scholar] [CrossRef] [PubMed]
  51. Kinnunen, V.; Craggs, R.; Rintala, J. Influence of temperature and pretreatments on the anaerobic digestion of wastewater grown microalgae in a laboratory-scale accumulating-volume reactor. Water Res. 2014, 57, 247–257. [Google Scholar] [CrossRef] [PubMed]
  52. Tran, K.C.; Mendoza Martin, J.L.; Heaven, S.; Banks, C.J.; Acien Fernandez, F.G.; Molina Grima, E. Cultivation and anaerobic digestion of Scenedesmus spp. grown in a pilot-scale open raceway. Algal Res. 2014, 5, 95–102. [Google Scholar] [CrossRef]
  53. Hirayama, S.; Ueda, R.; Sugata, K. Evaluation of active oxygen effect on photosynthesis of Chlorella vulgaris. Free Rad. Res. 1996, 25, 247–254. [Google Scholar] [CrossRef]
  54. Doucha, J.; Lívanský, K. Novel outdoor thin-Iayer high density microalgal culture system: Productivity and operational parameters. Algol. Stud. 1995, 76, 129–147. [Google Scholar]
  55. Gonçalves, A.L.; Simões, M.; Pires, J.C.M. The effect of light supply on microalgal growth, CO2 uptake and nutrient removal from wastewater. Energy Conv. Manag. 2014, 85, 530–536. [Google Scholar] [CrossRef]
  56. Gouveia, L. Microalgae as a Feedstock for Biofuels; Springer: Heidelberg, Germany, 2011; pp. 30–32. [Google Scholar]
  57. Wang, B.; Lan, C.Q. Biofixation of carbon dioxide (CO2) by microorganisms. In Developments and Innovation in Carbon Dioxide (CO2) Capture and Storage Technology, 1st ed.; Maroto-Valer, M.M., Ed.; Woodhead Publishing Limited: Cambridge, UK, 2010; Volume 2. [Google Scholar]
  58. Davis, R.; Aden, A.; Pienkos, P.T. Techno-economic analysis of autotrophic microalgae for fuel production. Appl. Energy 2011, 88, 3524–3531. [Google Scholar] [CrossRef]
  59. Vandamme, D. Flocculation Based Harvesting Processes for Microalgae Biomass Production. Ph.D. Thesis, KU Leuven, Belgium, May 2013. [Google Scholar]
  60. Barros, A.I.; Gonçalves, A.L.; Simões, M.; Pires, J.C.M. Harvesting techniques applied to microalgae: A review. Renew. Sustain. Energy Rev. 2015, 41, 1489–1500. [Google Scholar] [CrossRef]
  61. Molina Grima, E.; Belarbi, E.H.; Acién Fernández, F.G.; Robles Medina, A.; Chisti, Y. Recovery of microalgal biomass and metabolites: Process options and economics. Biotechnol. Adv. 2003, 20, 491–515. [Google Scholar] [CrossRef]
  62. Directive 1991/271/EEC. Directive of the European Council of 21 May 1991 Concerning Urban Waste-Water Treatment. Off. J. Eur. Union 1991, L 135, 40–52. [Google Scholar]
  63. Directive 1998/15/EC. Directive of the European Comission of 27 February 1998 amending Council Directive 91/271/EEC with respect to certain requirements established in Annex I thereof. Off. J. Eur. Union 1998, L 67, 29–30. [Google Scholar]
  64. Guderjan, M.; Töpfl, S.; Angersbach, A.; Knorr, D. Impact of pulsed electric field treatment on the recovery and quality of plant oils. J. Food Eng. 2005, 67, 281–287. [Google Scholar] [CrossRef]
  65. Taher, H.; Al-Zuhair, S.; Al-Marzouqui, A.H.; Haik, Y.; Farid, M.M. A review of enzymatic transesterification of microalgal oil-based biodiesel using supercritical technology. Enzyme Res. 2011. [Google Scholar] [CrossRef] [PubMed]
  66. Guderjan, M.; Elez-Martínez, P.; Knorr, D. Application of pulsed electric fields at oil yield and content of functional food ingredients at the production of rapeseed oil. Innov. Food Sci. Emerg. Technol. 2007, 8, 55–62. [Google Scholar] [CrossRef]
  67. Halim, R.; Danquah, M.K.; Webley, P.A. Extraction of oil from microalgae for biodiesel production: A review. Biotechnol. Adv. 2012, 30, 709–732. [Google Scholar] [CrossRef] [PubMed]
  68. Foltz, G. Algae Lysis with Pulsed Electric Fields. Master’s Thesis, California State Polytechnic University, San Luis Obispo, CA, USA, May 2012. [Google Scholar]
  69. Luengo, E.; Condón-Abanto, S.; Álvarez, I.; Raso, J. Effect of pulsed electric field treatments on permeabilization and extraction of pigments from Chlorella vulgaris. J. Membr. Biol. 2014, 247, 1269–1277. [Google Scholar] [CrossRef] [PubMed]
  70. Schlagermann, P.; Göttlicher, G.; Dillschneider, R.; Rosello-Sastre, R.; Posten, C. Composition of algal oil and its potential as biofuel. J. Comb. 2012, 2012, 1–14. [Google Scholar] [CrossRef]
  71. Sialve, B.; Bernet, N.; Bernard, O. Anaerobic digestion of microalgae as a necessary step to make microalgal biodiesel sustainable. Biotechnol. Adv. 2009, 27, 409–416. [Google Scholar] [CrossRef] [PubMed]
  72. Gonçalves, A.L.; Rodrigues, C.M.; Pires, J.C.M.; Simões, M. The effect of increasing CO2 concentrations on its capture, biomass production and wastewater bioremediation by microalgae and cyanobacteria. Algal Res. 2016, 14, 127–136. [Google Scholar] [CrossRef]
  73. Lundquist, T.J.; Woertz, I.C.; Quinn, N.; Benemann, J.R. A Realistic Technology and Engineering Assessment of Algae Biofuel Production; Energy Biosciences Institute: Berkeley, CA, USA, 2010. [Google Scholar]
  74. Fans—Efficiency and Power Consumption. Available online: http://www.engineeringtoolbox.com/fans-efficiency-power-consumption-d_197.html (accessed on 22 December 2015).
  75. Tredici, M.R.; Bassi, N.; Prussi, M.; Biondi, N.; Rodolfi, L.; Chini Zittelli, G.; Sampietro, G. Energy balance of algal biomass production in a 1-ha “Green Wall Panel” plant: How to produce algal biomass in a closed reactor achieving a high Net Energy Ratio. Appl. Energy 2015, 154, 1103–1111. [Google Scholar] [CrossRef]
  76. Zamalloa, C.; Vulsteke, E.; Albrecht, J.; Verstraete, W. The techno-economic potential of renewable energy through the anaerobic digestion of microalgae. Bioresour. Technol. 2011, 102, 1149–1158. [Google Scholar] [CrossRef] [PubMed]
  77. Biogas renewable energy—The biogas composition. Available online: http://www.biogas-renewable-energy.info/biogas_composition.html (accessed on 22 December 2015).
  78. Davis, R.; Fishman, D.; Frank, E.D.; Wigmosta, M.S. Renewable Diesel from Algal Lipids: An Integrated Baseline for Cost, Emissions, and Resource Potential from a Harmonized Model; U.S. Department of Energy Biomass Program: Oak Ridge, TN, USA, 2012. [Google Scholar]
  79. Acién, F.; Fernández, J.; Magán, J.; Molina, E. Production cost of a real microalgae production plant and strategies to reduce it. Biotechnol. Adv. 2012, 30, 1344–1353. [Google Scholar] [CrossRef] [PubMed]
  80. Benemann, J.R.; Oswald, W.J. Systems and Economic Analysis of Microalgae Ponds for Conversion of CO2 to Biomass—Final Report; Department of Civil Engineering of the California University: Berkeley, CA, USA, 1996. [Google Scholar]
  81. Peters, M.S.; Timmerhaus, K.D. Plant. Design and Economics for Chemical Engineers, 4th ed.; McGraw-Hill: New York, NY, USA, 1991. [Google Scholar]
  82. Sinnott, R.K.; Towler, G. Chemical Engineering Design, 4th ed.; Elsevier Butterworth-Heinemann: Oxford, UK, 2009; pp. 243–268. [Google Scholar]
  83. Chemical Market Insight and Foresight on a Single Page—Caustic Soda. Available online: http://www.orbichem.com/userfiles/CNF%20Samples/cas_13_11.pdf (accessed on 22 Feburay 2016).
  84. FAQ about Pulsed Electric Field Processing. Available online: https://www.pulsemaster.us/pef-pulsemaster/faq (accessed on 23 December 2015).
  85. Declercq, B.; Delarue, E.; D’haeseleer, W. Impact of the economic recession on the European power sector’s CO2 emissions. Energy Policy 2011, 39, 1677–1686. [Google Scholar] [CrossRef]
  86. Mithá, O. Análise de Projectos de Investimento; Escolar Editora: Lisboa, Portugal, 2004. (In Portuguese) [Google Scholar]
Figure 1. Minimum (black line), maximum (grey line) and average (dashed line) temperature (A) and horizontal solar irradiation (B) per month observed in Sines municipality, Portugal [32,34].
Energies 09 00224 g001
Figure 2. Process diagram. CHP—combined heat and power; PEF—pulsed electric field.
Energies 09 00224 g002
Figure 3. Electrical requirements determined for different steps of the microalgal facility in each of the studied scenarios.
Energies 09 00224 g003
Figure 4. Annual revenues obtained in each of the studied scenarios.
Energies 09 00224 g004
Figure 5. Sensitivity analysis of the process considering the different studied scenarios.
Energies 09 00224 g005
Table 1. Characterization of the seven scenarios (Sc) evaluated in this study.
Scenarios‘ AssumptionsSc1Sc2Sc3Sc4Sc5Sc6Sc7
Photosynthetic efficiency (%)2132222
Biomass productivity (g·m−2·day−1)16.48.224.616.416.416.416.4
Lipids extraction efficiency (%)75757560907575
Anaerobic digestion efficiency (%)45454545453060
Table 2. Mass balance to the flow streams involved in the process determined in each of the studied scenarios (Sc).
StreamsSc1Sc2Sc3Sc4Sc5Sc6Sc7
S 01 —water input in the cultivation step (×104 m3·day−1)3.51.95.23.53.53.53.5
S 02 —biomass flow rate after the cultivation step a (×104 m3·day−1)3.31.64.93.33.33.33.3
S 03 —biomass flow rate after the pre-concentration step (×103 m3·day−1)8.24.1128.28.28.28.2
S 04 —biomass flow rate after the centrifugation step (m3·day−1)783911778787878
S 05 —extracted lipids flow rate (m3·day−1)3.41.75.12.74.13.43.4
S 06 —biomass flow rate after the lipids extraction step (m3·day−1)753711275747575
S 07 —biogas flow rate after the anaerobic digestion step (t·day−1)6.63.3106.96.34.48.9
S 08 —flow rate of the residue produced in the anaerobic digestion step (t·day−1)7.03.5117.36.68.95.1
S E V —water flow rate required to compensate evaporation losses (×103 m3·day−1)2.52.52.52.52.52.52.5
S W W —wastewater flow rate required to feed the culture (×104 m3·day−1)2.40.625.22.42.42.42.4
S W R —recycling water flow rate required to feed the culture (×104 m3·day−1)1.11.301.11.11.11.1
S A D —anaerobic digestion effluent flow rate required to feed the culture (m3·day−1)62319362626262
a Biomass flow rate after the cultivation step was determined considering annual average biomass productivities and assuming a final biomass concentration of 0.5 g·L−1 [40,47].
Table 3. Average removal rates of nitrogen, phosphorus and carbon and minimum concentrations required for microalgal cultivation in each of the studied scenarios (Sc).
Nutrients Loads and Removal RatesSc1Sc2Sc3Sc4Sc5Sc6Sc7
r N (g·m−2·day−1)1.10.541.61.11.11.11.1
[ N ] (mg·L−1)31154631313131
r P (g·m−2·day−1)0.220.110.330.220.220.220.22
[ P ] (mg·L−1)6.23.19.26.26.26.26.2
r C (g·m−2·day−1)8.44.2138.48.48.48.4
[ C ] (t·day−1)39195839393939
Table 4. Net CO2 balance in each of the studied scenarios (Sc).
CO2 StreamsSc1Sc2Sc3Sc4Sc5Sc6Sc7
CO2 required for microalgal growth (t·day−1)39195839393939
CO2 resulting from the anaerobic digestion (t·day−1)4.32.16.44.54.12.95.7
CO2 resulting from CHP generation (t·day−1)6.43.29.76.76.14.38.6
Net CO2 balance (t·day−1)−20−10−30−20−21−24−17
CHP—combined heat and power.
Table 5. Net energy balance in each of the studied scenarios (Sc).
Energetic StreamsSc1Sc2Sc3Sc4Sc5Sc6Sc7
Energy required in microalgal cultivation (×103 kWh·day−1)6.25.37.06.26.26.26.2
Energy required in microalgal harvesting (×103 kWh·day−1)9.84.9159.89.89.89.8
Energy required in cell disruption and lipids extraction (×103 kWh·day−1)7.53.7117.57.57.57.5
Energy obtained from the extracted lipids (×104 kWh·day−1)3.01.54.62.43.63.03.0
Electrical energy produced in the CHP generation unit (×104 kWh·day−1)1.40.692.11.41.30.921.8
Thermal energy produced in the CHP generation unit (×104 kWh·day−1)1.60.772.31.61.51.02.1
EROEI2.52.12.72.32.72.13.0
CHP—combined heat and power; EROEI—energy returned on energy invested.
Table 6. Total purchase costs (in k€) of the major equipment in each of the studied scenarios (Sc).
EquipmentsSc1Sc2Sc3Sc4Sc5Sc6Sc7
High rate pond a3479347934793479347934793479
Air blowers b12362185123123123123
Clarifier c325163488325325325325
Centrifuge d14141414141414
Decanter e44448944444444
Digester and CHP generation unit f1399139913991399139913991399
Total5753553060235753575357535753
Total purchase costs5983573462815983598359835983
a 34,000 USD per ha (2009) [78], including the costs associated to paddlewheels and liners; b 2500 € per 200 m3·h−1 (2012) [79]; c 948,000 USD per 23,200 m3 (2010) [73]; d 4500 USD per ha (1996) [80]; e 45,000 € per 4 m3·h−1 (2012) [79]; f 10,000 USD per ha (1996) [80]; CHP—combined heat and power.
Table 7. Total capital (fixed capital) cost estimation (in k€) in each of the studied scenarios (Sc).
CostsFactor aSc1Sc2Sc3Sc4Sc5Sc6Sc7
Direct costs
Total purchase costs1.005983573462815983598359835983
Purchased equipment installation0.201197114712561197119711971197
Instrumentation and control0.15897860942897897897897
Piping0.201197114712561197119711971197
Electrical0.10598573628598598598598
Buildings0.15897860942897897897897
Yard improvements0.05299287314299299299299
Service facilities0.201197114712561197119711971197
Indirect costs
Engineering and supervision0.31795172018841795179517951795
Construction expenses0.05299287314299299299299
Contractor’s fee0.03179172188179179179179
Contingency0.08479459502479479479479
Total capital cost 15,01714,39115,76515,01715,01715,01715,017
a Fraction of the total purchase costs [79].
Table 8. Estimation of the annual production costs (in k€) in each of the studied scenarios (Sc).
CostsSc1Sc2Sc3Sc4Sc5Sc6Sc7
Variable costs
Raw materials0000000
Miscellaneous materials a75747775757575
Utilities8575101205857857857857
Pre-concentration with NaOH35175235353535
PEF extraction115169131111
Shipping and packaging b0000000
Fixed costs
Maintenance c751738766751751751751
Operating labour120120120120120120120
Laboratory costs d24242424242424
Supervision d24242424242424
Plant overheads e60606060606060
Insurance f150148153150150150150
Local taxes g300295306300300300300
Royalties f150148153150179150150150
Annual production costs2557216429562555255925572557
a 10% of the Maintenance costs; b Usually negligible; c 5% of the total fixed capital; d 20% of the Operating labour costs; e 50% of the Operating labour costs; f 1% of the total fixed capital; g 2% of the total fixed capital; PEF—pulsed electric field.
Table 9. Economic viability of the proposed project in each of the studied scenarios.
Economic Viability ParametersSc1Sc2Sc3Sc4Sc5Sc6Sc7
Interest rate (%)10101010101010
Lifetime (years)30303030303030
Net present value (NPV, k€)5287−12,12422,6094267630749405634
Internal rate of return (IRR, %)14n.a.2613151414
Payback time (years)8n.a.48788
n.a.—not applicable; NPV—net present value; IRR—internal rate of return.

