Effectiveness of a Program Intervention with Reduced-Iron Multiple Micronutrient Powders on Iron Status, Morbidity and Growth in Young Children in Ethiopia

 , ,
, ,
Abstract
:1. Introduction
2. Materials and Methods
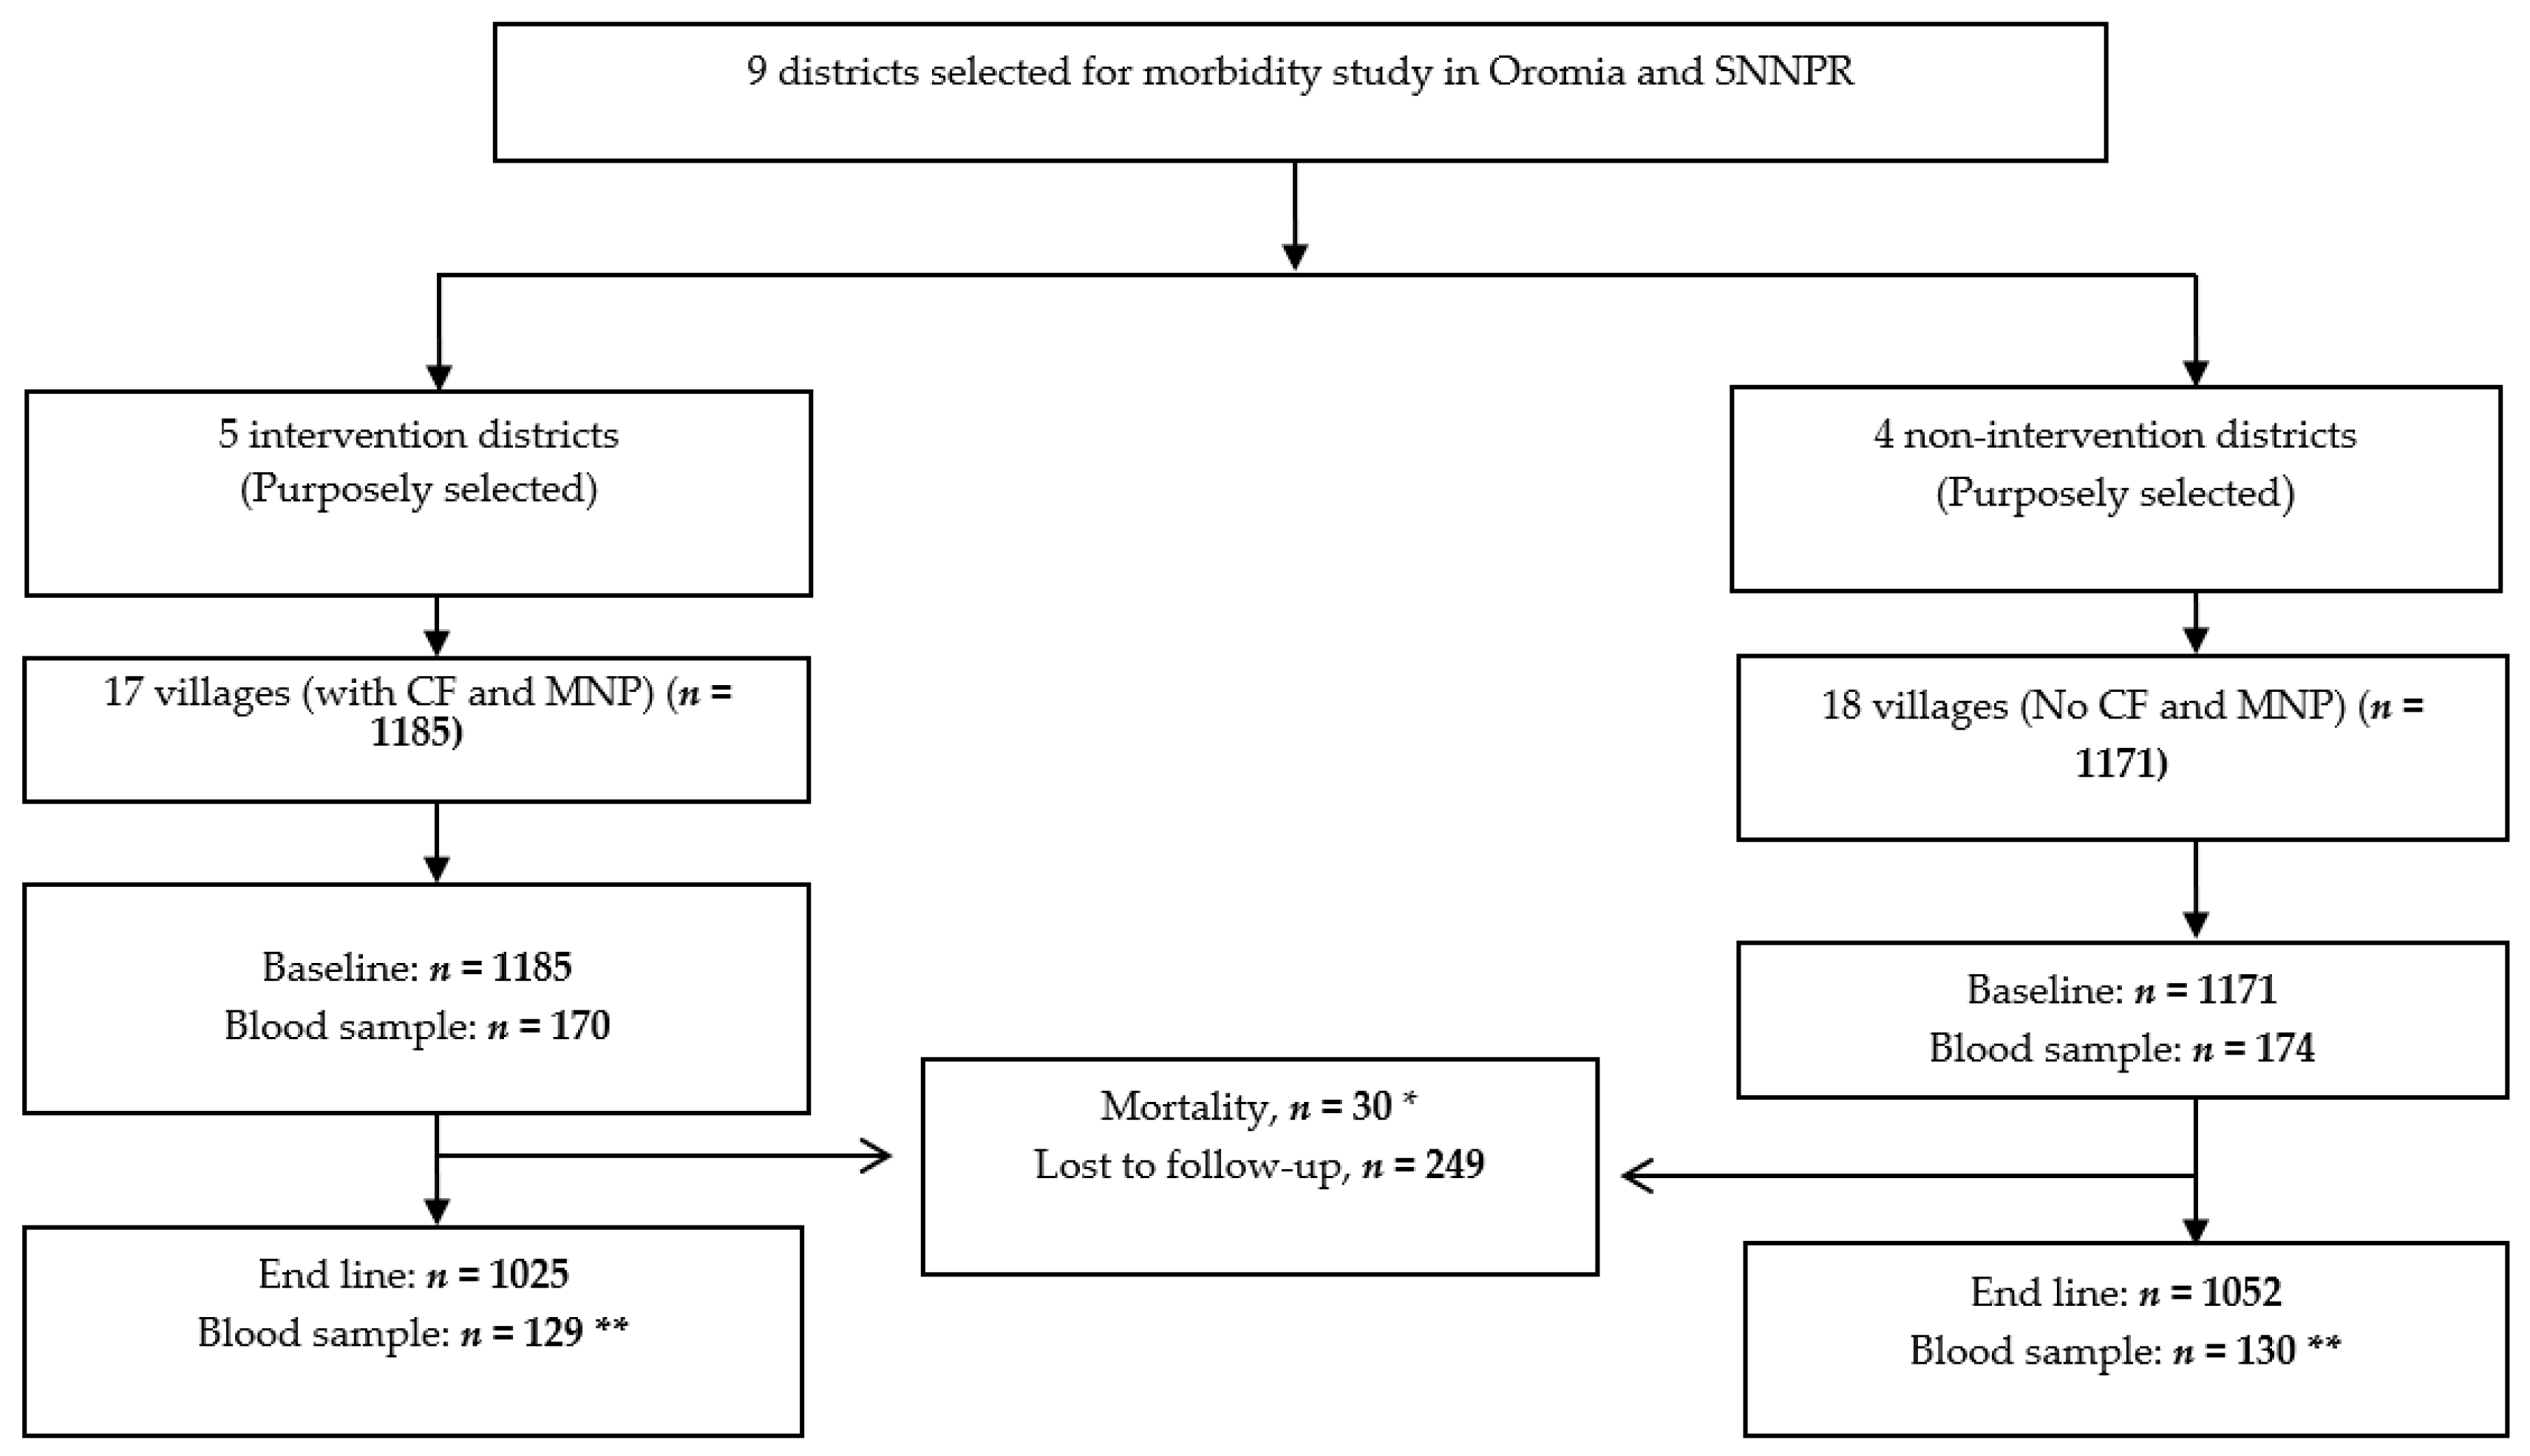
2.1. Study Design and Participants
2.2. Data Collection Procedures
2.3. Statistical Methods
3. Results
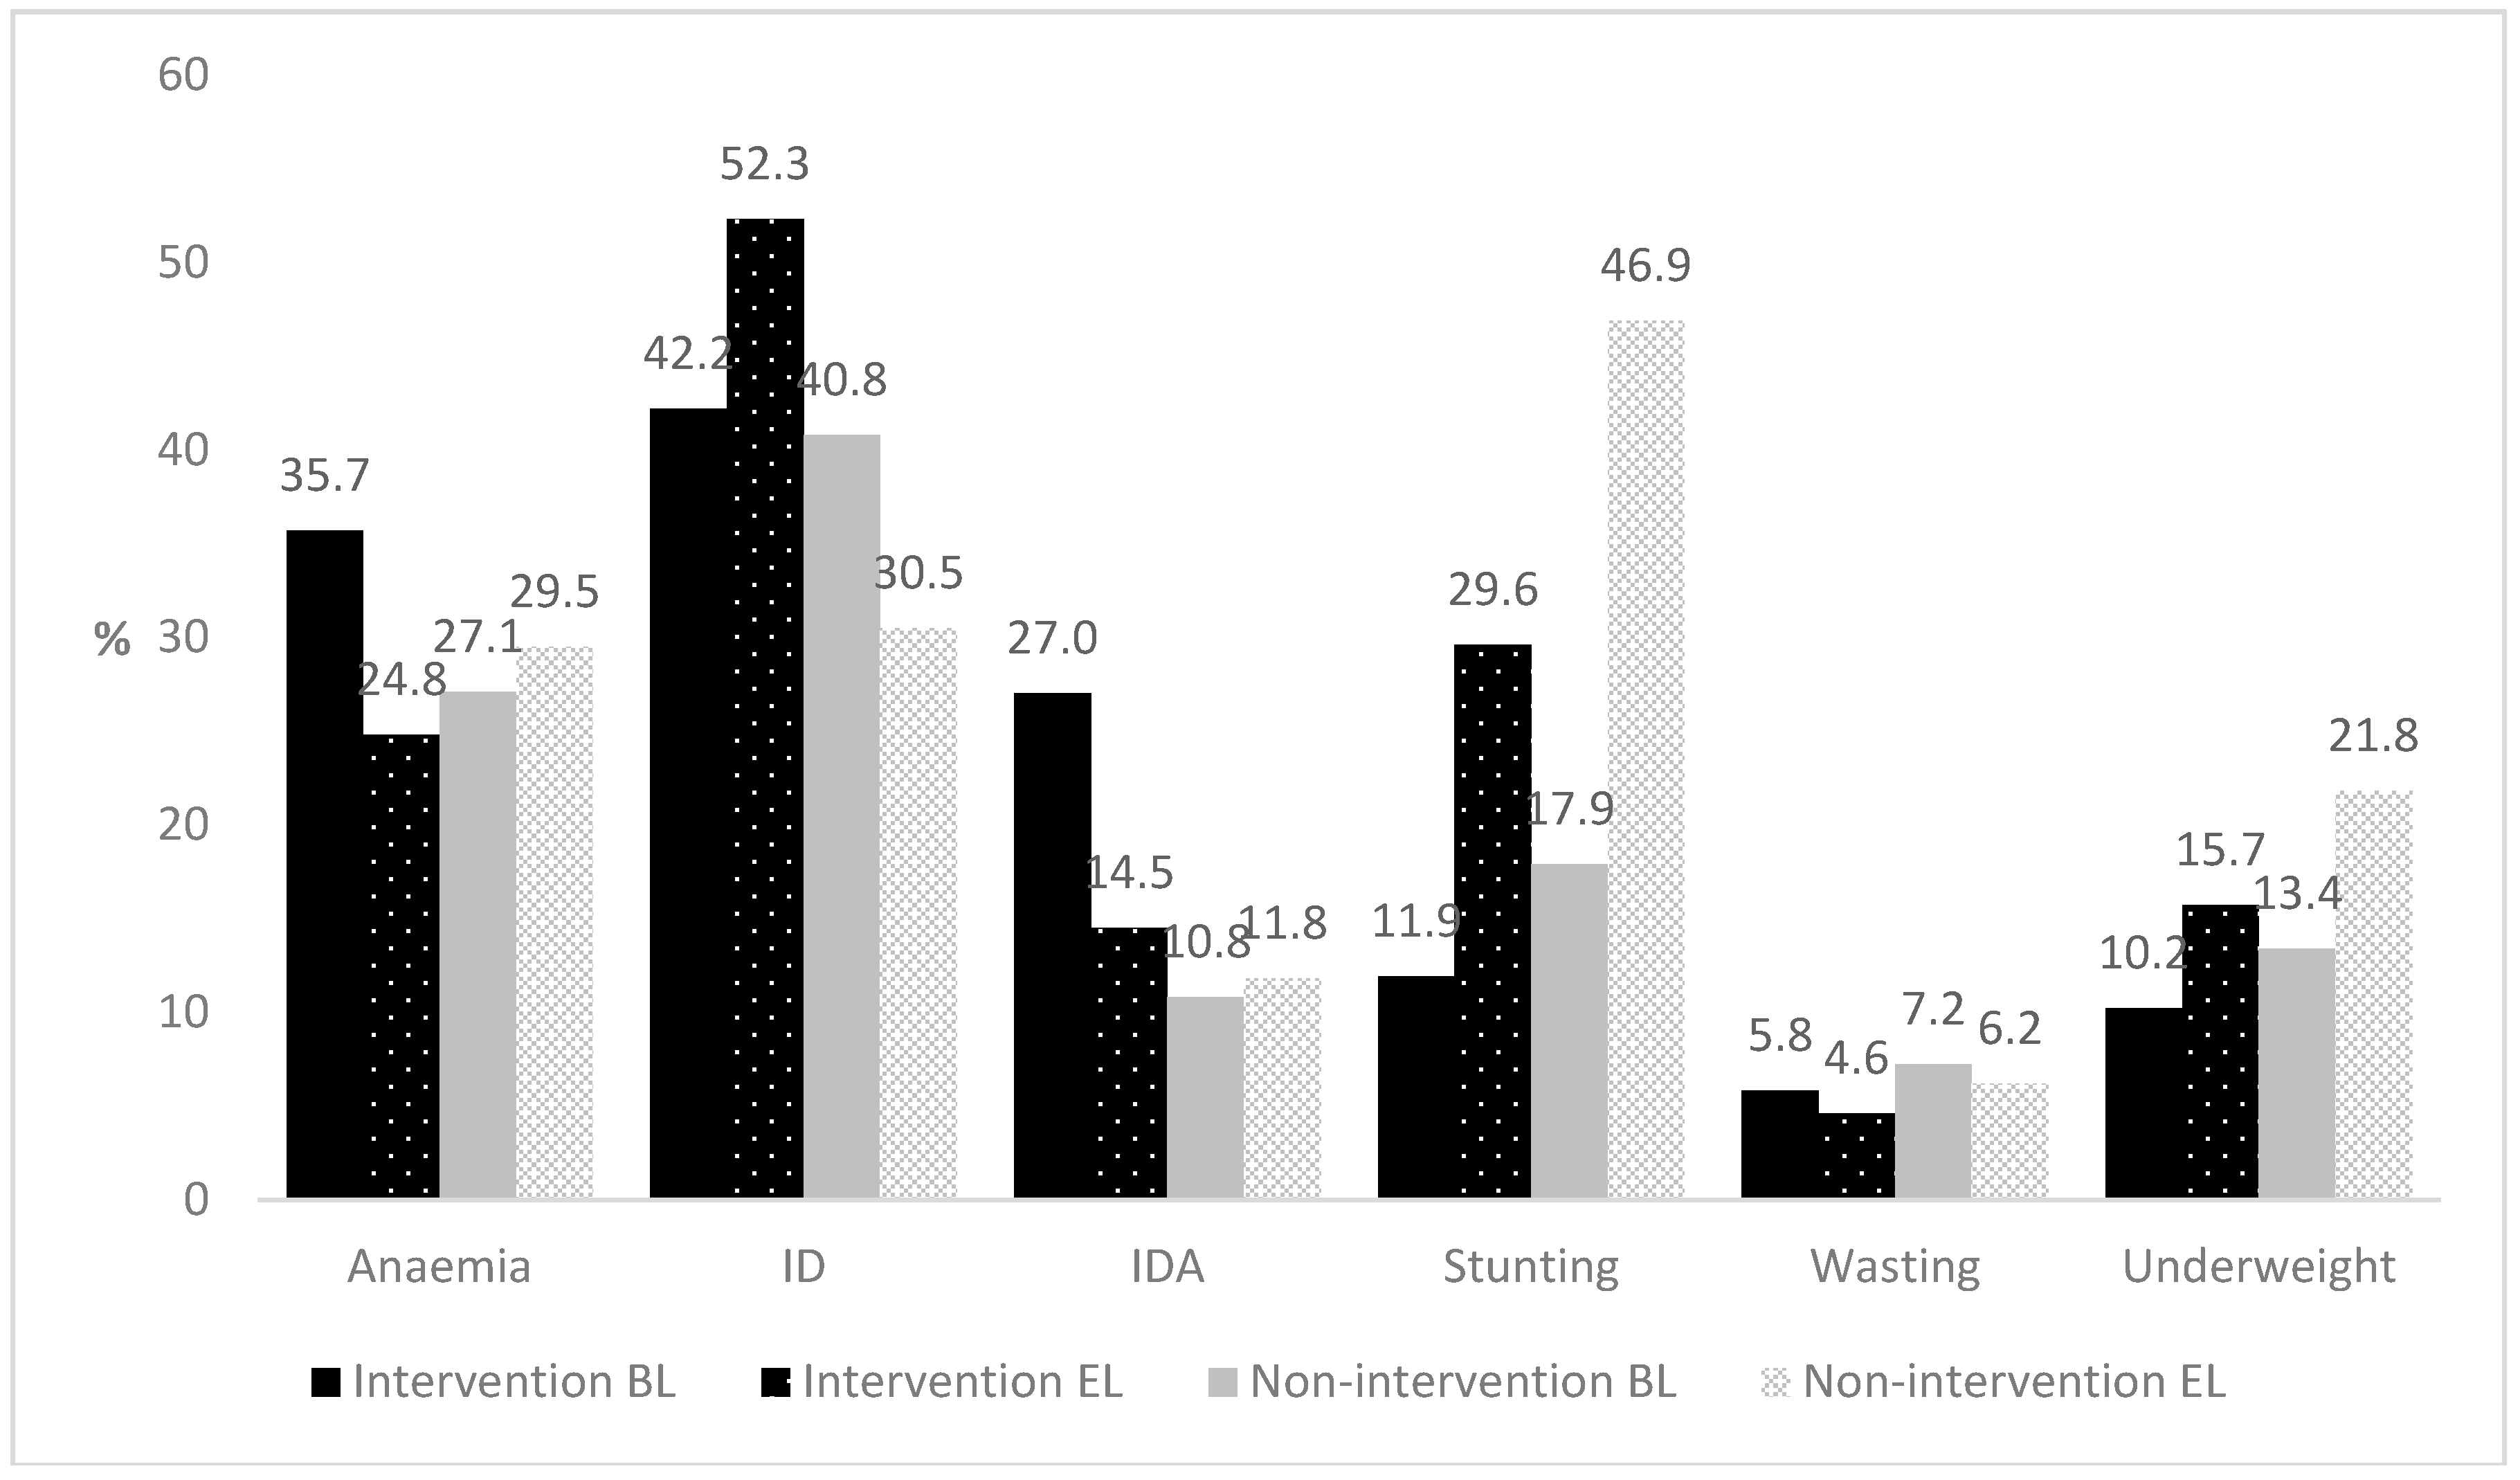
3.1. Iron Status
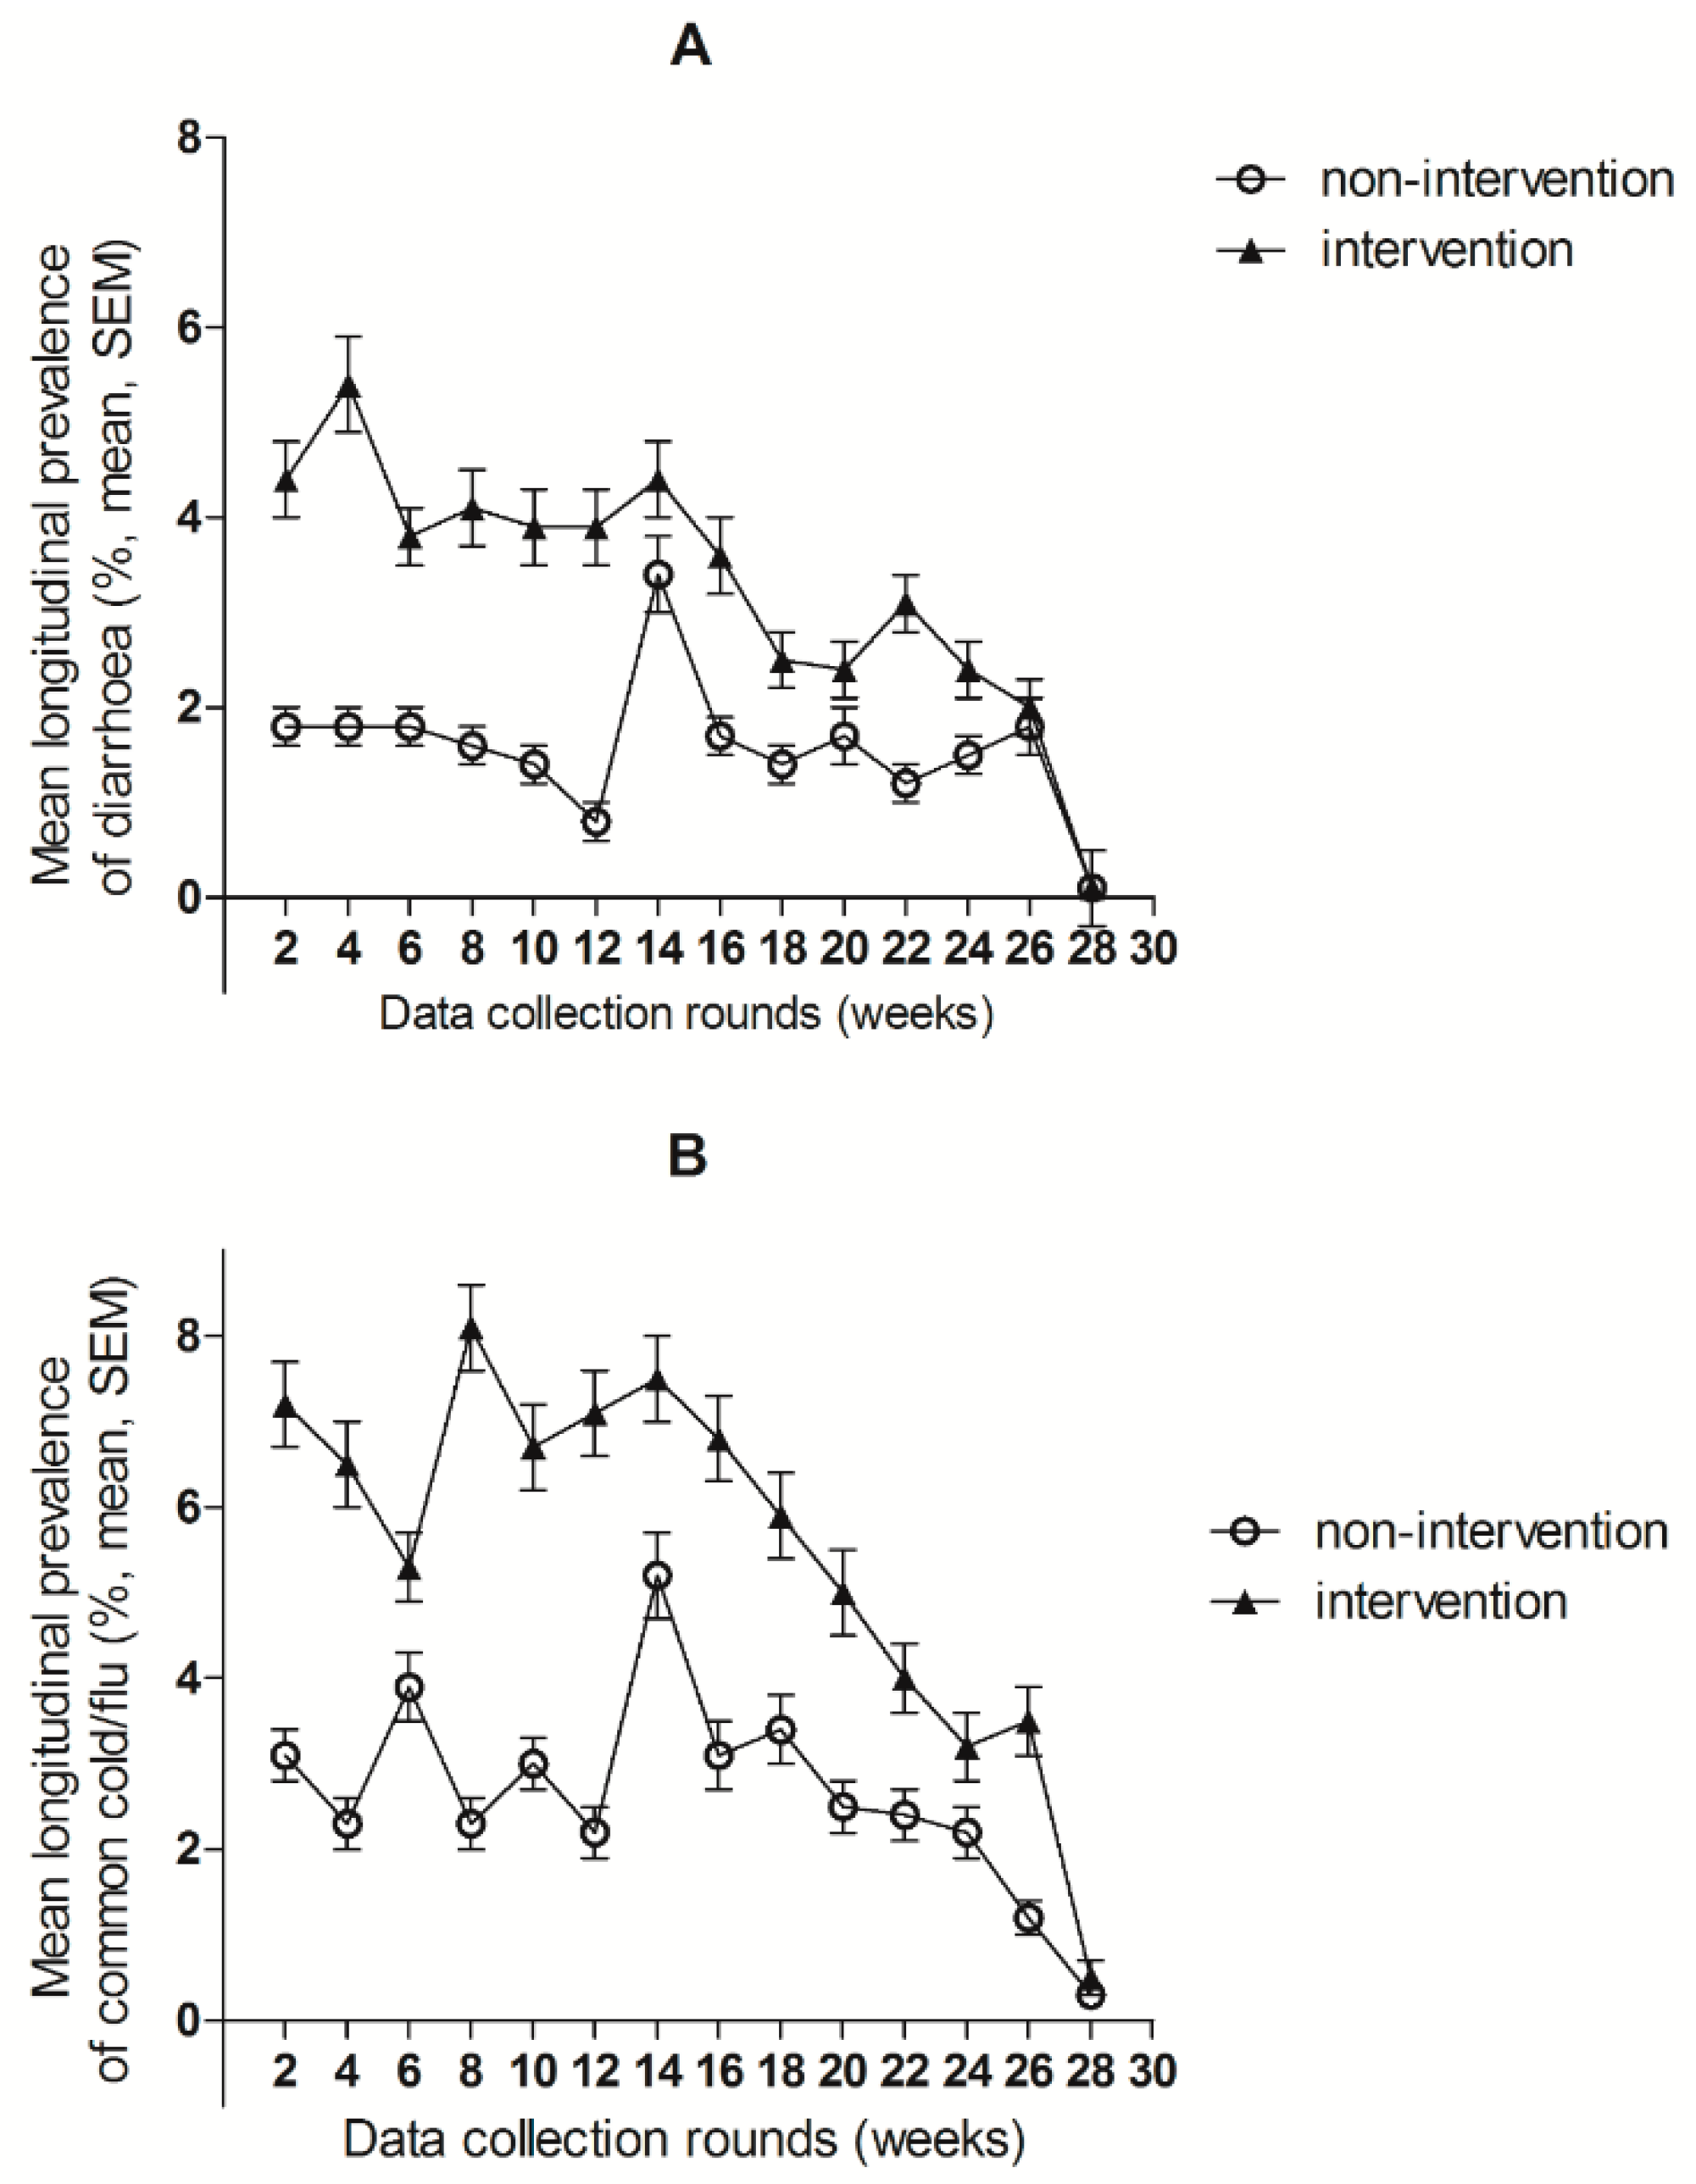
3.2. Morbidity
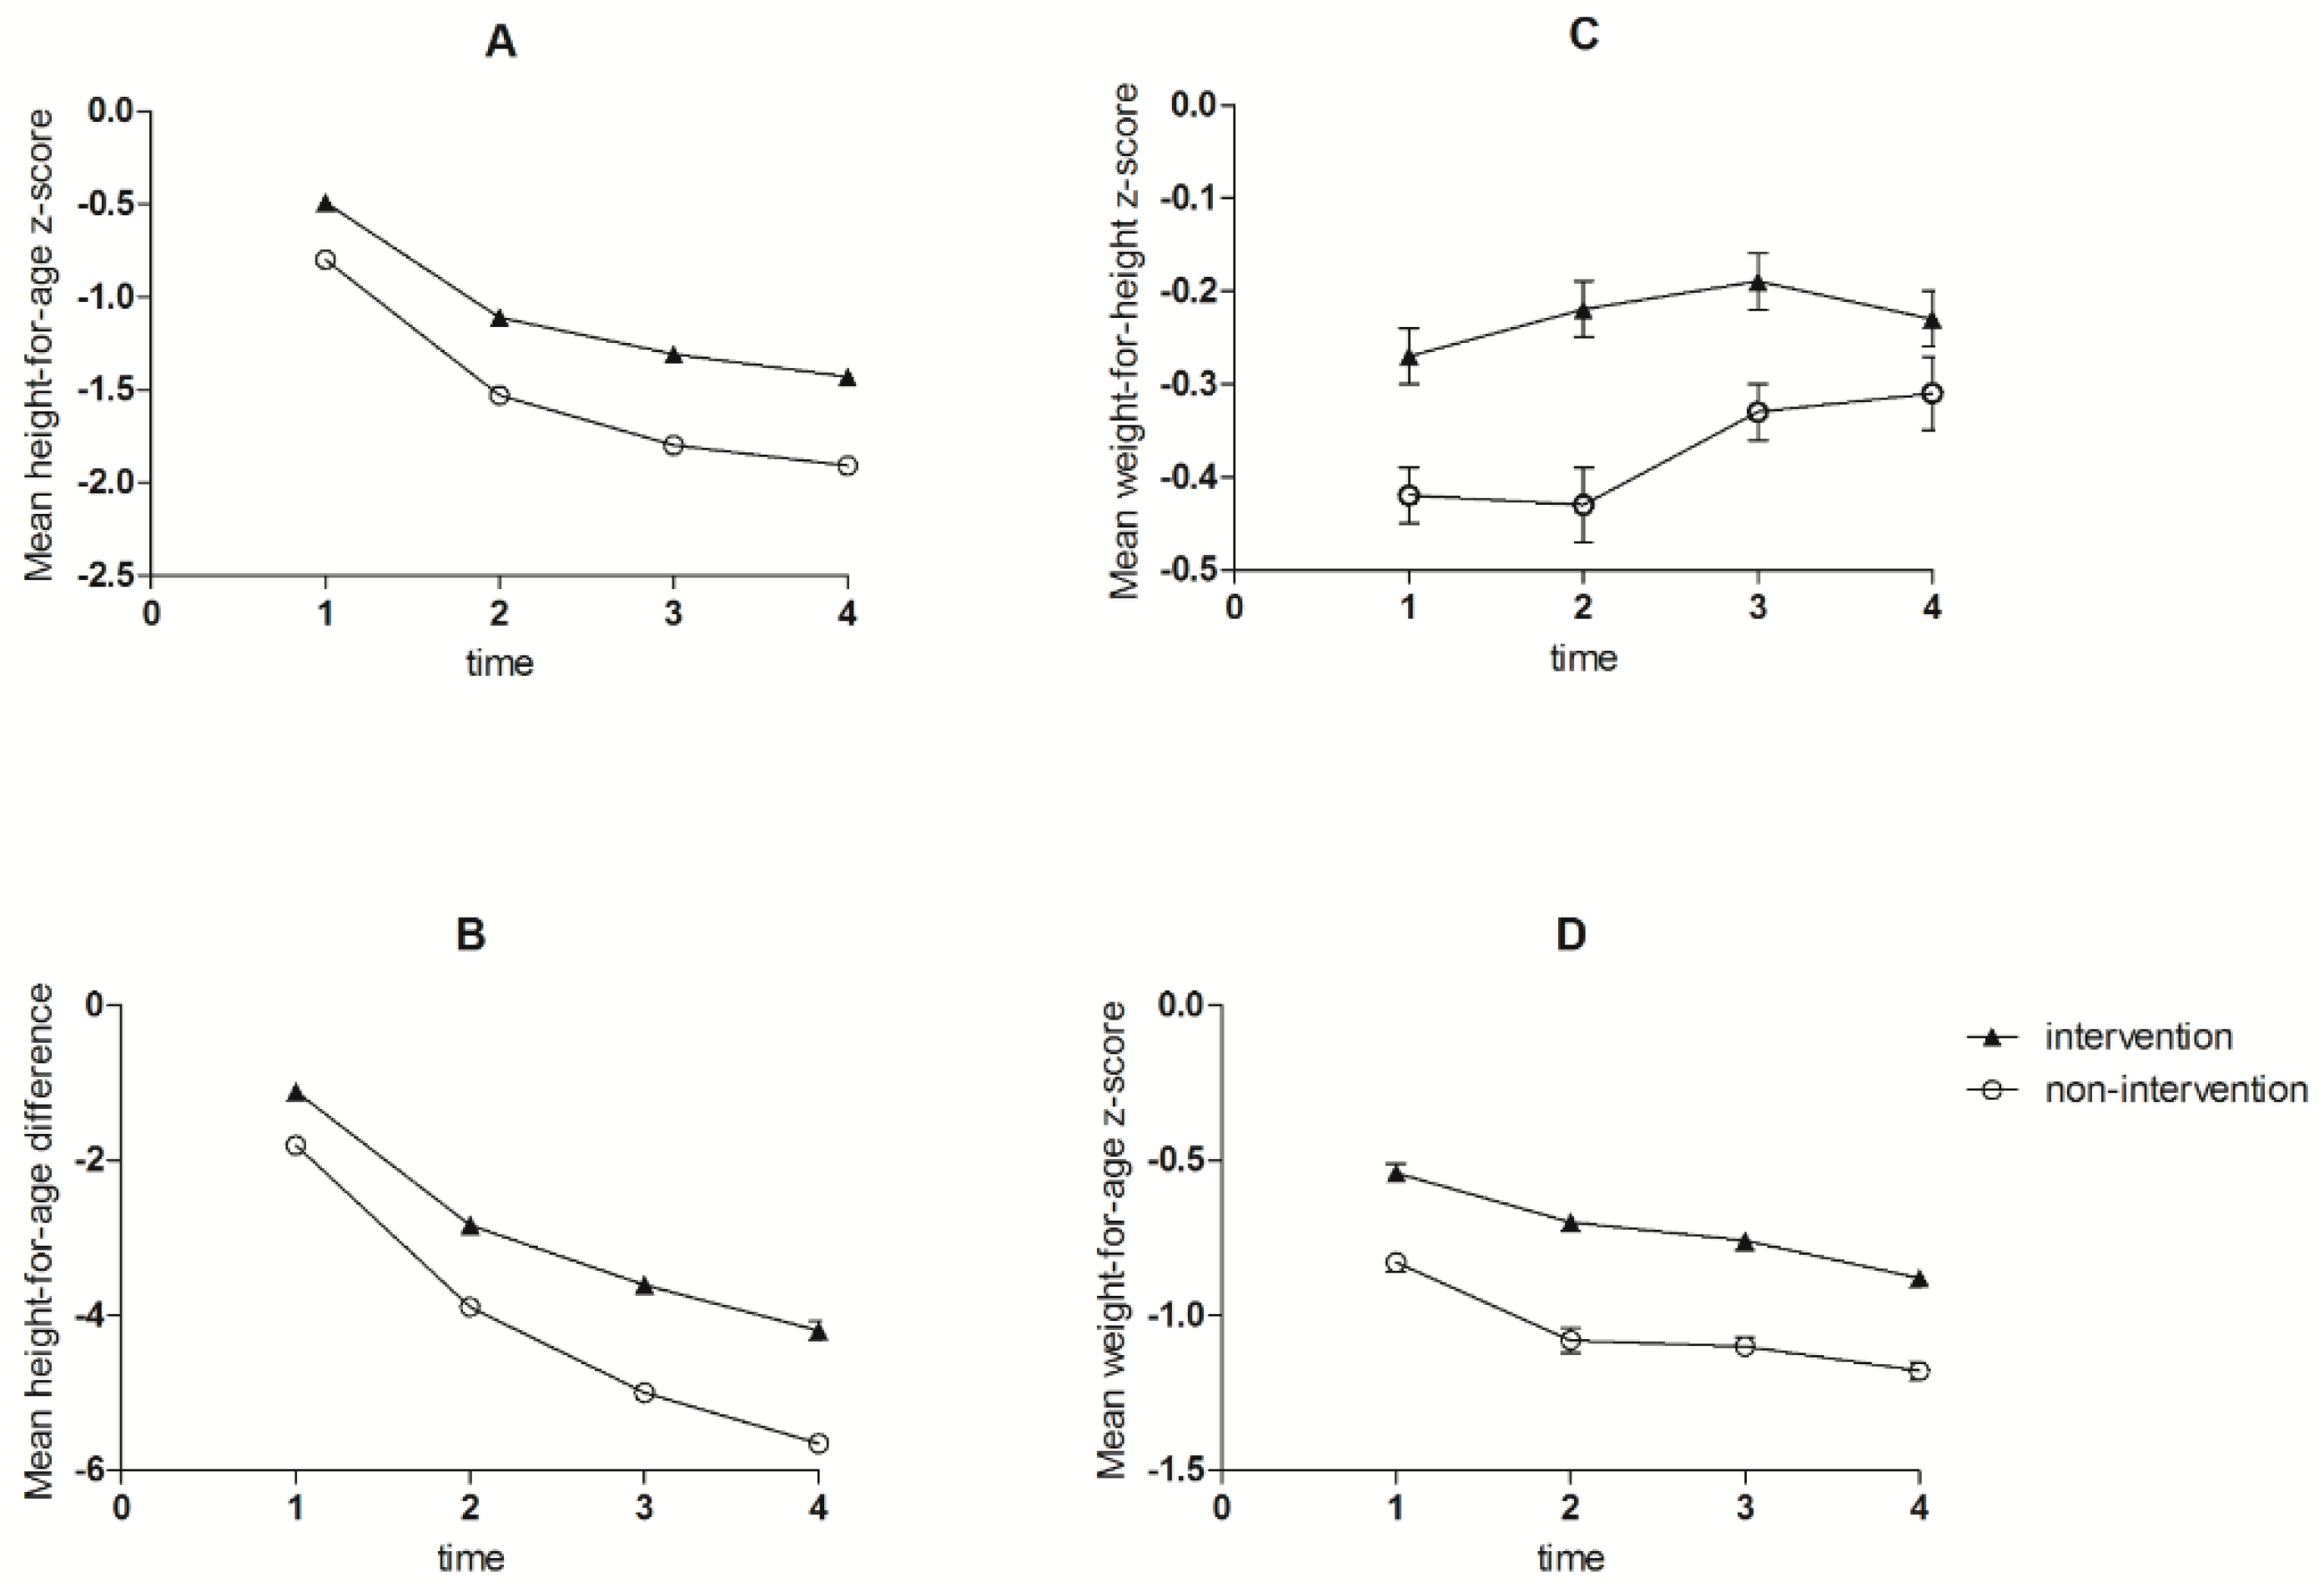
3.3. Growth
4. Discussion
5. Conclusions
Author Contributions
Funding
Acknowledgments
Conflicts of Interest
References
- Black, R.E. Summary of complementary feeding interventions in LMIC. Nestle Nutr. Inst. Workshop Ser. 2017, 87, 139–140. [Google Scholar] [PubMed]
- Camaschella, C. Iron-deficiency anemia. N. Engl. J. Med. 2015, 373, 485–486. [Google Scholar] [CrossRef] [PubMed]
- Ahmed, T.; Hossain, M.; Sanin, K.I. Global burden of maternal and child undernutrition and micronutrient deficiencies. Ann. Nutr. Metab. 2012, 61, 8–17. [Google Scholar] [CrossRef] [PubMed]
- WHO Guideline: Use of Multiple Micronutrient Powders for Point-of-Use Fortification of Foods Consumed by Infants and Young Children Aged 6–23 Months and Children Aged 2–12 Years; World Health Organization: Geneva, Switzerland, 2016.
- De-Regil, L.M.; Suchdev, P.S.; Vist, G.E.; Walleser, S.; Peña-Rosas, J.P. Home fortification of foods with multiple micronutrient powders for health and nutrition in children under two years of age (review). Evid.-Based Child Health Cochrane Rev. J. 2013, 8, 112–201. [Google Scholar] [CrossRef] [PubMed]
- Soofi, S.; Cousens, S.; Iqbal, S.P.; Akhund, T.; Ahmed, I.; Zaidi, A.K.M.; Bhutta, Z.A. Effect of provision of daily zinc and iron with several micronutrients on growth and morbidity among young children in pakistan: A cluster-randomised trial. Lancet 2013, 382, 29–40. [Google Scholar] [CrossRef]
- Sazawal, S.; Black, R.E.; Ramsan, M.; Chwaya, H.M.; Stoltzfus, R.J.; Dutta, A.; Dhingra, U.; Kabole, I.; Deb, S.; Othman, M.K. Effects of routine prophylactic supplementation with iron and folic acid on admission to hospital and mortality in preschool children in a high malaria transmission setting: Community-based, randomised, placebo-controlled trial. Lancet 2006, 367, 133–143. [Google Scholar] [CrossRef]
- Jaeggi, T.; Kortman, G.A.M.; Moretti, D.; Chassard, C.; Holding, P.; Dostal, A.; Boekhorst, J.; Timmerman, H.M.; Swinkels, D.W.; Tjalsma, H.; et al. Iron fortification adversely affects the gut microbiome, increases pathogen abundance and induces intestinal inflammation in Kenyan infants. Gut 2015, 64, 731–742. [Google Scholar] [CrossRef] [PubMed]
- Wieringa, F.T. Micronutrient powders to combat anemia in young children: Does it work? BMC Med. 2017, 15, 99. [Google Scholar] [CrossRef] [PubMed]
- Zlotkin, S.; Newton, S.; Aimone, A.M.; Azindow, I.; Amenga-Etego, S.; Tchum, K.; Mahama, E.; Thorpe, K.E.; Owusu-Agyei, S. Effect of iron fortification on malaria incidence in infants and young children in ghana: A randomized trial. JAMA 2013, 310, 938–947. [Google Scholar] [CrossRef] [PubMed]
- Adu-Afarwuah, S.; Lartey, A.; Brown, K.H.; Zlotkin, S.; Briend, A.; Dewey, K.G. Home fortification of complementary foods with micronutrient supplements is well accepted and has positive effects on infant iron status in Ghana. Am. J. Clin. Nutr. 2008, 87, 929–938. [Google Scholar] [CrossRef] [PubMed] [Green Version]
- Giovannini, M.; Sala, D.; Usuelli, M.; Livio, L.; Francescato, G.; Braga, M.; Radaelli, G.; Riva, E. Double-blind, placebo-controlled trial comparing effects of supplementation with two different combinations of micronutrients delivered as sprinkles on growth, anemia, and iron deficiency in Cambodian infants. J. Pediatr. Gastroenterol. Nutr. 2006, 42, 306–312. [Google Scholar] [CrossRef] [PubMed]
- Shafique, S.; Sellen, D.W.; Lou, W.; Jalal, C.S.; Jolly, S.P.; Zlotkin, S.H. Mineral- and vitamin-enhanced micronutrient powder reduces stunting in full-term low-birth-weight infants receiving nutrition, health, and hygiene education: A 2 × 2 factorial, cluster-randomized trial in Bangladesh. Am. J. Clin. Nutr. 2016, 103, 1357–1369. [Google Scholar] [CrossRef] [PubMed]
- Hess, S.Y.; Abbeddou, S.; Jimenez, E.Y.; Somé, J.W.; Vosti, S.A.; Ouédraogo, Z.P.; Guissou, R.M.; Ouédraogo, J.-B.; Brown, K.H. Small-quantity lipid-based nutrient supplements, regardless of their zinc content, increase growth and reduce the prevalence of stunting and wasting in young burkinabe children: A cluster-randomized trial. PLoS ONE 2015, 10, e0122242. [Google Scholar] [CrossRef] [PubMed]
- Roche, M.L.; Sako, B.; Osendarp, S.J.; Adish, A.A.; Tolossa, A.L. Community-based grain banks using local foods for improved infant and young child feeding in Ethiopia. Matern. Child Nutr. 2017, 13. [Google Scholar] [CrossRef] [PubMed]
- Hayes, R.J.; Bennett, S. Simple sample size calculation for cluster-randomized trials. Int. J. Epidemiol. 1999, 28, 319–326. [Google Scholar] [CrossRef] [PubMed] [Green Version]
- Mengistie, B.; Berhane, Y.; Worku, A. Household water chlorination reduces incidence of diarrhoea among under-five children in rural ethiopia: A cluster randomized controlled trial. PLoS ONE 2013, 8, e77887. [Google Scholar] [CrossRef] [PubMed]
- De Onis, M.; Onyango, A.W.; Van den Broeck, J.; Chumlea, W.C.; Martorell, R. Measurement and standardization protocols for anthropometry used in the construction of a new international growth reference. Food Nutr. Bull. 2004, 25, S27–S36. [Google Scholar] [CrossRef] [PubMed]
- WHO. Who Guidelines on Drawing Blood: Best Practices in Phlebotomy; WHO: Geneva, Switzerland, 2010. [Google Scholar]
- Sullivan, K.M.; Mei, Z.; Grummer-Strawn, L.; Parvanta, I. Haemoglobin adjustments to define anaemia. Trop. Med. Int. Health 2008, 13, 1267–1271. [Google Scholar] [CrossRef] [PubMed] [Green Version]
- WHO. Serum Ferritin Concentrations for the Assessment of Iron Status and Iron Deficiency in Populations. Vitamin and Mineral Nutrition Information System; World Health Organization: Geneva, Switzerland, 2011. [Google Scholar]
- Namaste, S.M.; Rohner, F.; Huang, J.; Bhushan, N.L.; Flores-Ayala, R.; Kupka, R.; Mei, Z.; Rawat, R.; Williams, A.M.; Raiten, D.J.; et al. Adjusting ferritin concentrations for inflammation: Biomarkers reflecting inflammation and nutritional determinants of anemia (brinda) project. Am. J. Clin. Nutr. 2017, 106, S359–S371. [Google Scholar]
- Leroy, J.L.; Ruel, M.; Habicht, J.-P.; Frongillo, E.A. Using height-for-age differences (had) instead of height-for-age z-scores (HAZ) for the meaningful measurement of population-level catch-up in linear growth in children less than 5 years of age. BMC Pediatr. 2015, 15, 145. [Google Scholar] [CrossRef] [PubMed]
- UNICEF/WHO. Core Questions and Indicators for Monitoring Wash in Schools in the Sustainable Development Goals; WHO; UNICEF: New York, NY, USA, 2016. [Google Scholar]
- WHO Multicentre Growth Reference Study Group. Who child growth standards based on length/height, weight and age. Acta Paediatr. 2006, 450, 76–85. [Google Scholar]
- Salam, R.A.; MacPhail, C.; Das, J.K.; Bhutta, Z.A. Effectiveness of micronutrient powders (MNP) in women and children. BMC Public Health 2013, 13, S22. [Google Scholar]
- Tumilowicz, A.; Schnefke, C.H.; Neufeld, L.M.; Pelto, G.H. Toward a better understanding of adherence to micronutrient powders: Generating theories to guide program design and evaluation based on a review of published results. Curr. Develop. Nutr. 2017, 1, e001123. [Google Scholar] [CrossRef] [PubMed]
- Verhoef, H.; Teshome, E.; Prentice, A.M. Micronutrient powders to combat anaemia in young children: Do they work? BMC Med. 2018, 16, 7. [Google Scholar] [CrossRef] [PubMed]
- Tielsch, J.M.; Khatry, S.K.; Stoltzfus, R.J.; Katz, J.; LeClerq, S.C.; Adhikari, R.; Mullany, L.C.; Shresta, S.; Black, R.E. Effect of routine prophylactic supplementation with iron and folic acid on preschool child mortality in southern nepal: Community-based, cluster-randomised, placebo-controlled trial. Lancet 2006, 367, 144–152. [Google Scholar] [CrossRef]
- Rah, J.H.; de Pee, S.; Kraemer, K.; Steiger, G.; Bloem, M.W.; Spiegel, P.; Wilkinson, C.; Bilukha, O. Program experience with micronutrient powders and current evidence. J. Nutr. 2012, 142, S191–S196. [Google Scholar] [CrossRef] [PubMed]
- Siekmans, K.; Begin, F.; Situma, R.; Kupka, R. The potential role of micronutrient powders to improve complementary feeding practices. Matern. Child. Nutr. 2017, 13, e12464. [Google Scholar] [CrossRef] [PubMed] [Green Version]
- Locks, L.M.; Reerink, I.; Tucker Brown, A.; Gnegne, S.; Ramalanjaona, N.; Nanama, S.; Duggan, C.P.; Garg, A. The impact of integrated infant and young child feeding and micronutrient powder intervention on feeding practices and anemia in children aged 6–23 months in Madagascar. Nutrients 2017, 9, 581. [Google Scholar] [CrossRef] [PubMed]
- EPHI. Ethiopia National Food Consumption Survey; EPHI: Addis Ababa, Ethiopia, 2013.
- Gibson, R.S.; Abebe, Y.; Stabler, S.; Allen, R.H.; Westcott, J.E.; Stoecker, B.J.; Krebs, N.F.; Hambidge, K.M. Zinc, gravida, infection, and iron, but not vitamin b-12 or folate status, predict hemoglobin during pregnancy in southern Ethiopia. J. Nutr. 2008, 138, 581–586. [Google Scholar] [CrossRef] [PubMed]


| Nutrient | Per 1 g |
|---|---|
| Vitamin A | 1332 IU/400 mcg |
| Vitamin D | 200 IU/5 mcg |
| Vitamin E | 5 mg TE |
| Vitamin B1 | 0.5 mg |
| Vitamin B2 | 0.5 mg |
| Vitamin B6 | 0.5 mg |
| Vitamin B12 | 0.9 mcg |
| Niacin amide | 6 mg |
| Folate | 150 mcg |
| Vitamin C | 30 mg |
| Iron | 6 mg |
| Zinc | 4.1 mg |
| Copper | 0.56 mg |
| Selenium | 17 mcg |
| Iodine | 90 mcg |
| Characteristics | Intervention n = 1172 | Non-Intervention n = 1137 | ||
|---|---|---|---|---|
| Region, Oromia (%) | 50.1 | 49.3 | ||
| Child characteristics | ||||
| Gender, Female (%) | 49.4 | 47.5 | ||
| Age (mo) | 7.9 | (1.8) | 8.1 | (1.9) * |
| Hb (g/L) 2 | 112.4 | (12.6) | 115.0 | (9.7) ** |
| SF (µg/L) 3 | 13.9 | (6.6,24.1) | 14.0 | (8.9,23.7) ** |
| sTfR (mg/L) 4 | 6.0 | (5.0,7.9) | 5.4 | (4.7,6.8) ** |
| AGP(g/L) 5 | 0.9 | (0.7,1.2) | 1.2 | (0.9,1.6) |
| CRP (mg/L) 5 | 1.5 | (0.6, 4.8) | 2.5 | (0.9,6.0) |
| Mother’s characteristics6 | ||||
| Mother age (y) | 25.3 | (5.8) | 25.7 | (5.7) |
| Education, Illiterate (%) | 49.9 | 44.8 | * | |
| Household characteristics | ||||
| Toilet facility—Pit latrine (%) | 95.7 | 90.1 | ** | |
| Access to safe drinking water (%) 7 | 93.2 | 92.3 | ||
| Land ownership 8 (%) | 90.8 | 91.1 |
| Intervention | Non-Intervention | β(SE) 2 | p-Value | ||||
|---|---|---|---|---|---|---|---|
| Hb (g/L) 3 | |||||||
| Baseline | 112.4 | (12.6) | 115.0 | (9.7) | |||
| End line | 114.8 | (10.5) | 114.2 | (8.7) | |||
| Change 4 | 2.4 | (1.17) | −0.8 | (1.17) | 3.17 | (1.65) | 0.056 |
| SF(ug/L) 5 | |||||||
| Baseline | 13.9 | (6.6,24.1) | 14.0 | (8.9,23.7) | |||
| End line | 11.1 | (5.8,22.6) | 19.1 | (11.0,35.6) | |||
| Change 4 | −2.11 | (1.6) | 6.4 | (1.5) | −8.53 | (2.14) | <0.0001 |
| sTfR (mg/L) 6 | |||||||
| Baseline | 6.0 | (5.0,7.9) | 5.4 | (4.7,6.8) | |||
| End line | 5.0 | (4.1,6.2) | 4.2 | (3.7,4.7) | |||
| Change 4 | −1.5 | (0.4) | −1.6 | (0.3) | 0.11 | (0.49) | 0.820 |
| Variable | Intervention (n = 1148) | Non-Intervention (n = 1125) | |
|---|---|---|---|
| Longitudinal Prevalence (%) 2 | β (95% CI) 1 | ||
| Diarrhoea | 2.7 (3.6) | 1.5 (3.2) | 1.01 (0.73,1.29) * |
| Common cold and flu | 5.4 (5.4) | 2.7 (3.7) | 2.44 (2.08,2.80) * |
| Fever | 0.1 (0.2) | 0.1 (0.3) | −0.01 (−0.03,0.01) |
| Incidence Rate (per child/ year) 4 | IRR (95% CI) 3 | ||
| Number of observation days | 204,456 | 210,686 | |
| Diarrhoea | 2.67 (1474) | 1.34 (786) | 2.31 (1.92,2.78) * |
| Common cold and flu | 3.77 (2178) | 1.90 (1109) | 1.43 (1.23,1.65) * |
| Clinic visits due to diarrhoea (per year) 5 | 0.41 (470) | 0.37 (415) | 1.23 (0.86,1.77) |
| Clinic visits due to common cold and flu (per year) 5 | 0.30 (349) | 0.38 (431) | 0.90 (0.62,1.32) |
| Intervention | Non-Intervention | β(SE) 2 | ||||
|---|---|---|---|---|---|---|
| Height, cm | ||||||
| Baseline | 68.4 | (3.8) | 67.9 | (4.0) | ||
| 1st Quarter | 73.6 | (3.6) | 72.7 | (3.9) | 0.55 | (0.09) ** |
| 2nd Quarter | 77.2 | (3.8) | 76.1 | (3.9) | 0.67 | (0.11) ** |
| End line | 80.0 | (3.9) | 78.8 | (4.0) | 0.77 | (0.13) ** |
| Weight, kg | ||||||
| Baseline | 7.8 | (1.1) | 7.6 | (1.1) | ||
| 1st Quarter | 8.9 | (1.2) | 8.6 | (1.2) | 0.15 | (0.03) ** |
| 2nd Quarter | 9.6 | (1.2) | 9.3 | (1.2) | 0.13 | (0.04) ** |
| End line | 10.2 | (1.3) | 9.9 | (1.3) | 0.08 | (0.04) * |
| HAZ | ||||||
| Baseline | −0.49 | (1.37) | −0.80 | (1.43) | ||
| 1st Quarter | −1.12 | (1.26) | −1.53 | (1.35) | 0.10 | (0.04) * |
| 2nd Quarter | −1.31 | (1.24) | −1.80 | (1.29) | 0.18 | (0.04) ** |
| End line | −1.43 | (1.22) | −1.91 | (1.27) | 0.18 | (0.05) ** |
| WHZ | ||||||
| Baseline | −0.27 | (1.08) | −0.42 | (1.13) | ||
| 1st Quarter | −0.22 | (1.06) | −0.43 | (1.14) | 0.04 | (0.04) |
| 2nd Quarter | −0.19 | (1.00) | −0.33 | (1.02) | −0.02 | (0,04) |
| End line | −0.24 | (1.03) | −0.31 | (1.14) | −0.09 | (0.05) |
| WAZ | ||||||
| Baseline | −0.54 | (1.27) | −0.83 | (1.15) | ||
| 1st Quarter | −0.70 | (1.11) | −1.08 | (1.15) | 0.07 | (0.03) * |
| 2nd Quarter | −0.76 | (1.06) | −1.11 | (1.06) | 0.06 | (0.04) |
| End line | −0.88 | (1.05) | −1.18 | (1.10) | 0.01 | (0.04) |
| HAD | ||||||
| Baseline | −1.11 | (3.13) | −1.81 | (3.28) | ||
| 1st Quarter | −2.84 | (3.22) | −3.89 | (3.42) | 0.33 | (0.09) ** |
| 2nd Quarter | −3.61 | (3.41) | −4.97 | (3.55) | 0.66 | (0.11) ** |
| End line | −4.20 | (3.61) | −5.65 | (3.71) | 0.78 | (0.12) ** |
© 2018 by the authors. Licensee MDPI, Basel, Switzerland. This article is an open access article distributed under the terms and conditions of the Creative Commons Attribution (CC BY) license (http://creativecommons.org/licenses/by/4.0/).
Share and Cite
Samuel, A.; Brouwer, I.D.; Feskens, E.J.M.; Adish, A.; Kebede, A.; De-Regil, L.M.; Osendarp, S.J.M. Effectiveness of a Program Intervention with Reduced-Iron Multiple Micronutrient Powders on Iron Status, Morbidity and Growth in Young Children in Ethiopia. Nutrients 2018, 10, 1508. https://doi.org/10.3390/nu10101508
Samuel A, Brouwer ID, Feskens EJM, Adish A, Kebede A, De-Regil LM, Osendarp SJM. Effectiveness of a Program Intervention with Reduced-Iron Multiple Micronutrient Powders on Iron Status, Morbidity and Growth in Young Children in Ethiopia. Nutrients. 2018; 10(10):1508. https://doi.org/10.3390/nu10101508
Chicago/Turabian StyleSamuel, Aregash, Inge D. Brouwer, Edith J. M. Feskens, Abdulaziz Adish, Amha Kebede, Luz Maria De-Regil, and Saskia J. M. Osendarp. 2018. "Effectiveness of a Program Intervention with Reduced-Iron Multiple Micronutrient Powders on Iron Status, Morbidity and Growth in Young Children in Ethiopia" Nutrients 10, no. 10: 1508. https://doi.org/10.3390/nu10101508