Article

Integrated Assessment of the EU’s Greening Reform and Feed Self-Sufficiency Scenarios on Dairy Farms in Piemonte, Italy

by
Stefano Gaudino
1,*,
Pytrik Reidsma
2,
Argyris Kanellopoulos
3,
Dario Sacco
1 and
Martin K. Van Ittersum
2
1
Department of Agriculture, Forest and Food Sciences, University of Turin, via L. Da Vinci 44, 10095 Grugliasco, Italy
2
Plant Production Systems Group, Wageningen University, P.O. Box 430, 6700 Wageningen, The Netherlands
3
Operations Research and Logistics Group, Wageningen University, Hollandseweg 1, 6708 Wageningen, The Netherlands
*
Author to whom correspondence should be addressed.
Agriculture 2018, 8(9), 137; https://doi.org/10.3390/agriculture8090137
Submission received: 31 July 2018 / Revised: 28 August 2018 / Accepted: 29 August 2018 / Published: 4 September 2018
(This article belongs to the Special Issue Agriculture Policies: Experiences and Challenges)

Abstract

:
Specialised dairy farms are challenged to be competitive and yet respect environmental constrains. A tighter integration of cropping and livestock systems, both in terms of feed and manure flows, can be beneficial for the farm economy and the environment. The greening of the direct payments, which was introduced in the European Union’s greening reform in 2013, is assumed to stimulate the transition towards more sustainable systems. The aim of this study was to quantitatively assess the impacts of greening policies on important economic and environmental indicators of sustainability, and explore potential further improvements in policies. The Farm System SIMulator (FSSIM) bioeconomic farm model was used to simulate the consequences of scenarios of policy change on three representative dairy farms in Piedmont, Italy, i.e., an ‘intensive’, an ‘extensive’, and an ‘organic’ dairy farm. Results showed that in general, there is a large potential to increase the current economic performance of all of the farms. The most profitable activity is milk production, resulting in the allocation of all of the available farm land to feed production. Imposing feed self-sufficiency targets results in a larger adaptation of current managerial practice than the adaptations that are required due to the greening policy scenario. It was shown that the cropping system is not always able to sustain the actual herd composition when 90% feed self-sufficiency is imposed. Regarding the greening policies, it is shown that extensive and organic farms already largely comply with the greening constrains, and the extra subsidy is therefore a bonus, while the intensive farm is likely to sacrifice the subsidy, as adapting the farm plan will substantially reduce profit. The introduction of nitrogen (N)-fixing crops in ecological focus areas was the easiest greening strategy to adopt, and led to an increase in the protein feed self-sufficiency. In conclusion, it is important to note that the greening policy in its current form does not lead to reduced environmental impacts. This implies that in order to improve environmental performance, regulations are needed rather than voluntary economic incentives.

1. Introduction

The main challenge of agricultural systems today is to increase production in order to feed the growing world population while reducing the pressure on the environment [1,2]. During the last decades, a progressive intensification has occurred in the agricultural lands of Western Europe that has increased crop and animal productivity, both per unit of labour and per unit of land. It was driven by the introduction of new technology, process specialisation, large-scale mechanisation, and the increased use of external inputs, such as feedstuffs, fertilisers, pesticides, and selected seeds [3,4]. As a consequence, the agricultural sector, and particularly the livestock sector, has been identified as the major contributor of nutrient losses to the environment [5,6,7] and air pollution through ammonia and greenhouse gas (GHG) emissions [8,9].
Economic sustainability is a challenge for intensive and specialised dairy farms. Milk price development has failed to keep pace with increasing production costs due to rising energy costs [7]. Dairy farms have also been exposed to volatile corn and soybean prices, which have led to concentrated cost uncertainty [10]. Although farm specialisation has often resulted in the division of crop and livestock operations into separate farms [11], this does not happen in dairy farms where the cropping (grain and forage) and livestock system are closely interrelated [12].
Closing the cycle between cropping and livestock systems, both in terms of feed and manure flows, could be a key form of ecological intensification and useful to future food security and environmental sustainability [11]. It is also one of the targets proposed by organic farming regulations [13,14].
Strengthening the relationship between crop and livestock systems could further reduce both vulnerability to price volatility and negative environmental impacts. As reported by Vayssières J. et al. [15], crop and livestock integration can heighten the productivity of both activities, by improving both nutrient cycling and soil fertility, while reducing environmental impact. Furthermore, increased feed self-sufficiency reduces non-renewable energy consumption and raises nutrient efficiency at the farm scale [16]. Technological innovations and alternative integrated agricultural activities can also enhance existing system efficiency while simultaneously yielding high economic outputs and environmental benefits. This change is facilitated by supportive agricultural and environmental policies [11,17,18,19].
The common agricultural policy (CAP) has strong effects on rural areas in the European Union (EU), agricultural markets, agricultural production, farm income, and the environment [20,21]. The CAP reform (2013) aims at strengthening its environmental objectives through targeted direct payments, as opposed to the main previous approach of coupled direct payments [22,23,24]. The European Commission introduced the first “greening” component into the first pillar of the post-2013 CAP. Greening direct payments are intended to ensure that all farms deliver environmental and climate benefits through permanent pastures (retention of soil carbon and grassland habitats), ecological focus areas (EFA) with water and habitat protection, and crop diversification (resilience of soil and ecosystems). An EFA represents an area cropped with plants where agricultural practices are beneficial for the climate and environment. According to European regulations, terraces, buffer strips, agroforestry, hedges, fallow land, cover crops, and nitrogen-fixing crops can be accounted as EFA surface.
Moreover, direct payments should undergird the ability of land and natural ecosystems to contribute to EU biodiversity and climate change adaptation objectives [23].
Although EFAs contribute to greening with different goals, considering the main environmental issues in dairy farms (nutrient losses to the environment and air pollution through ammonia and GHG emissions), in this case, EFA introduction should help close the cycle between cropping and livestock systems.
To evaluate the effectiveness of “greening” measures, different tools will be required at the farm and territorial scales, as reported by the European Commission [25]. Promoting sustainable development through agricultural and environmental policies requires an assessment of their strengths, weaknesses, and interaction with technological innovations prior to introduction through an ex-ante integrated assessment (IA) tool [26,27]. IA can be a powerful scientific tool to support the implementation of sustainable development in agricultural policy-making [28,29,30]. Rotmans J. et al. [31] have defined IA as “an interdisciplinary and participatory process combining, interpreting, and communicating knowledge from diverse scientific disciplines to allow a better understanding of complex phenomena”.
Integrated assessment and modelling (IAM) has increasingly been used by policy makers and technicians to assess the impacts of agricultural and environmental policies [32,33]. The European Commission (EC) has, for instance, introduced the impact assessment of its policies as an essential step in the development and introduction of new policies [34], to which IAM may play a supporting role. IAM has been developed, and many models are now available for agricultural assessment [26,33,35,36]. They often used a scenario analysis approach that can be descriptive, predictive, or explorative [37].
At the farm level, bioeconomic farm models have been developed to link models of farmers’ resource management decisions to models that describe current and alternative production possibilities in terms of the required inputs to achieve certain outputs and associated externalities [19,38]. Agro-environmental conditions and farm characteristics determine the feasibility of production activities, while the socio-economic environment influences the selection of most suitable production activities. In this study, the bioeconomic farm model FSSIM (Farm System SIMulator; [21,22,23,24,25,26,27,28,29,30,31,32,33,34,35,36,37,38,39]) was adapted and used to design new farm plans under the effects of CAP-greening policies, feed self-sufficiency, and gross margin maximisation scenarios on dairy farms in northwest Italy. We assessed the economic efficiency and environmental impacts of four different scenarios. The first scenario maximised the farm gross margin only considering the structural constrains of the farm, the second maximised the farm gross margin considering an increased feed self-sufficiency, the third maximised the farm gross margin considering CAP greening rules, and the fourth scenario combined the previous two. Using agro-environmental indicators, farm activity changes were examined for different dairy farms in Northern Italy, which were characterised by different levels of intensification, including one that adopts European organic regulations.

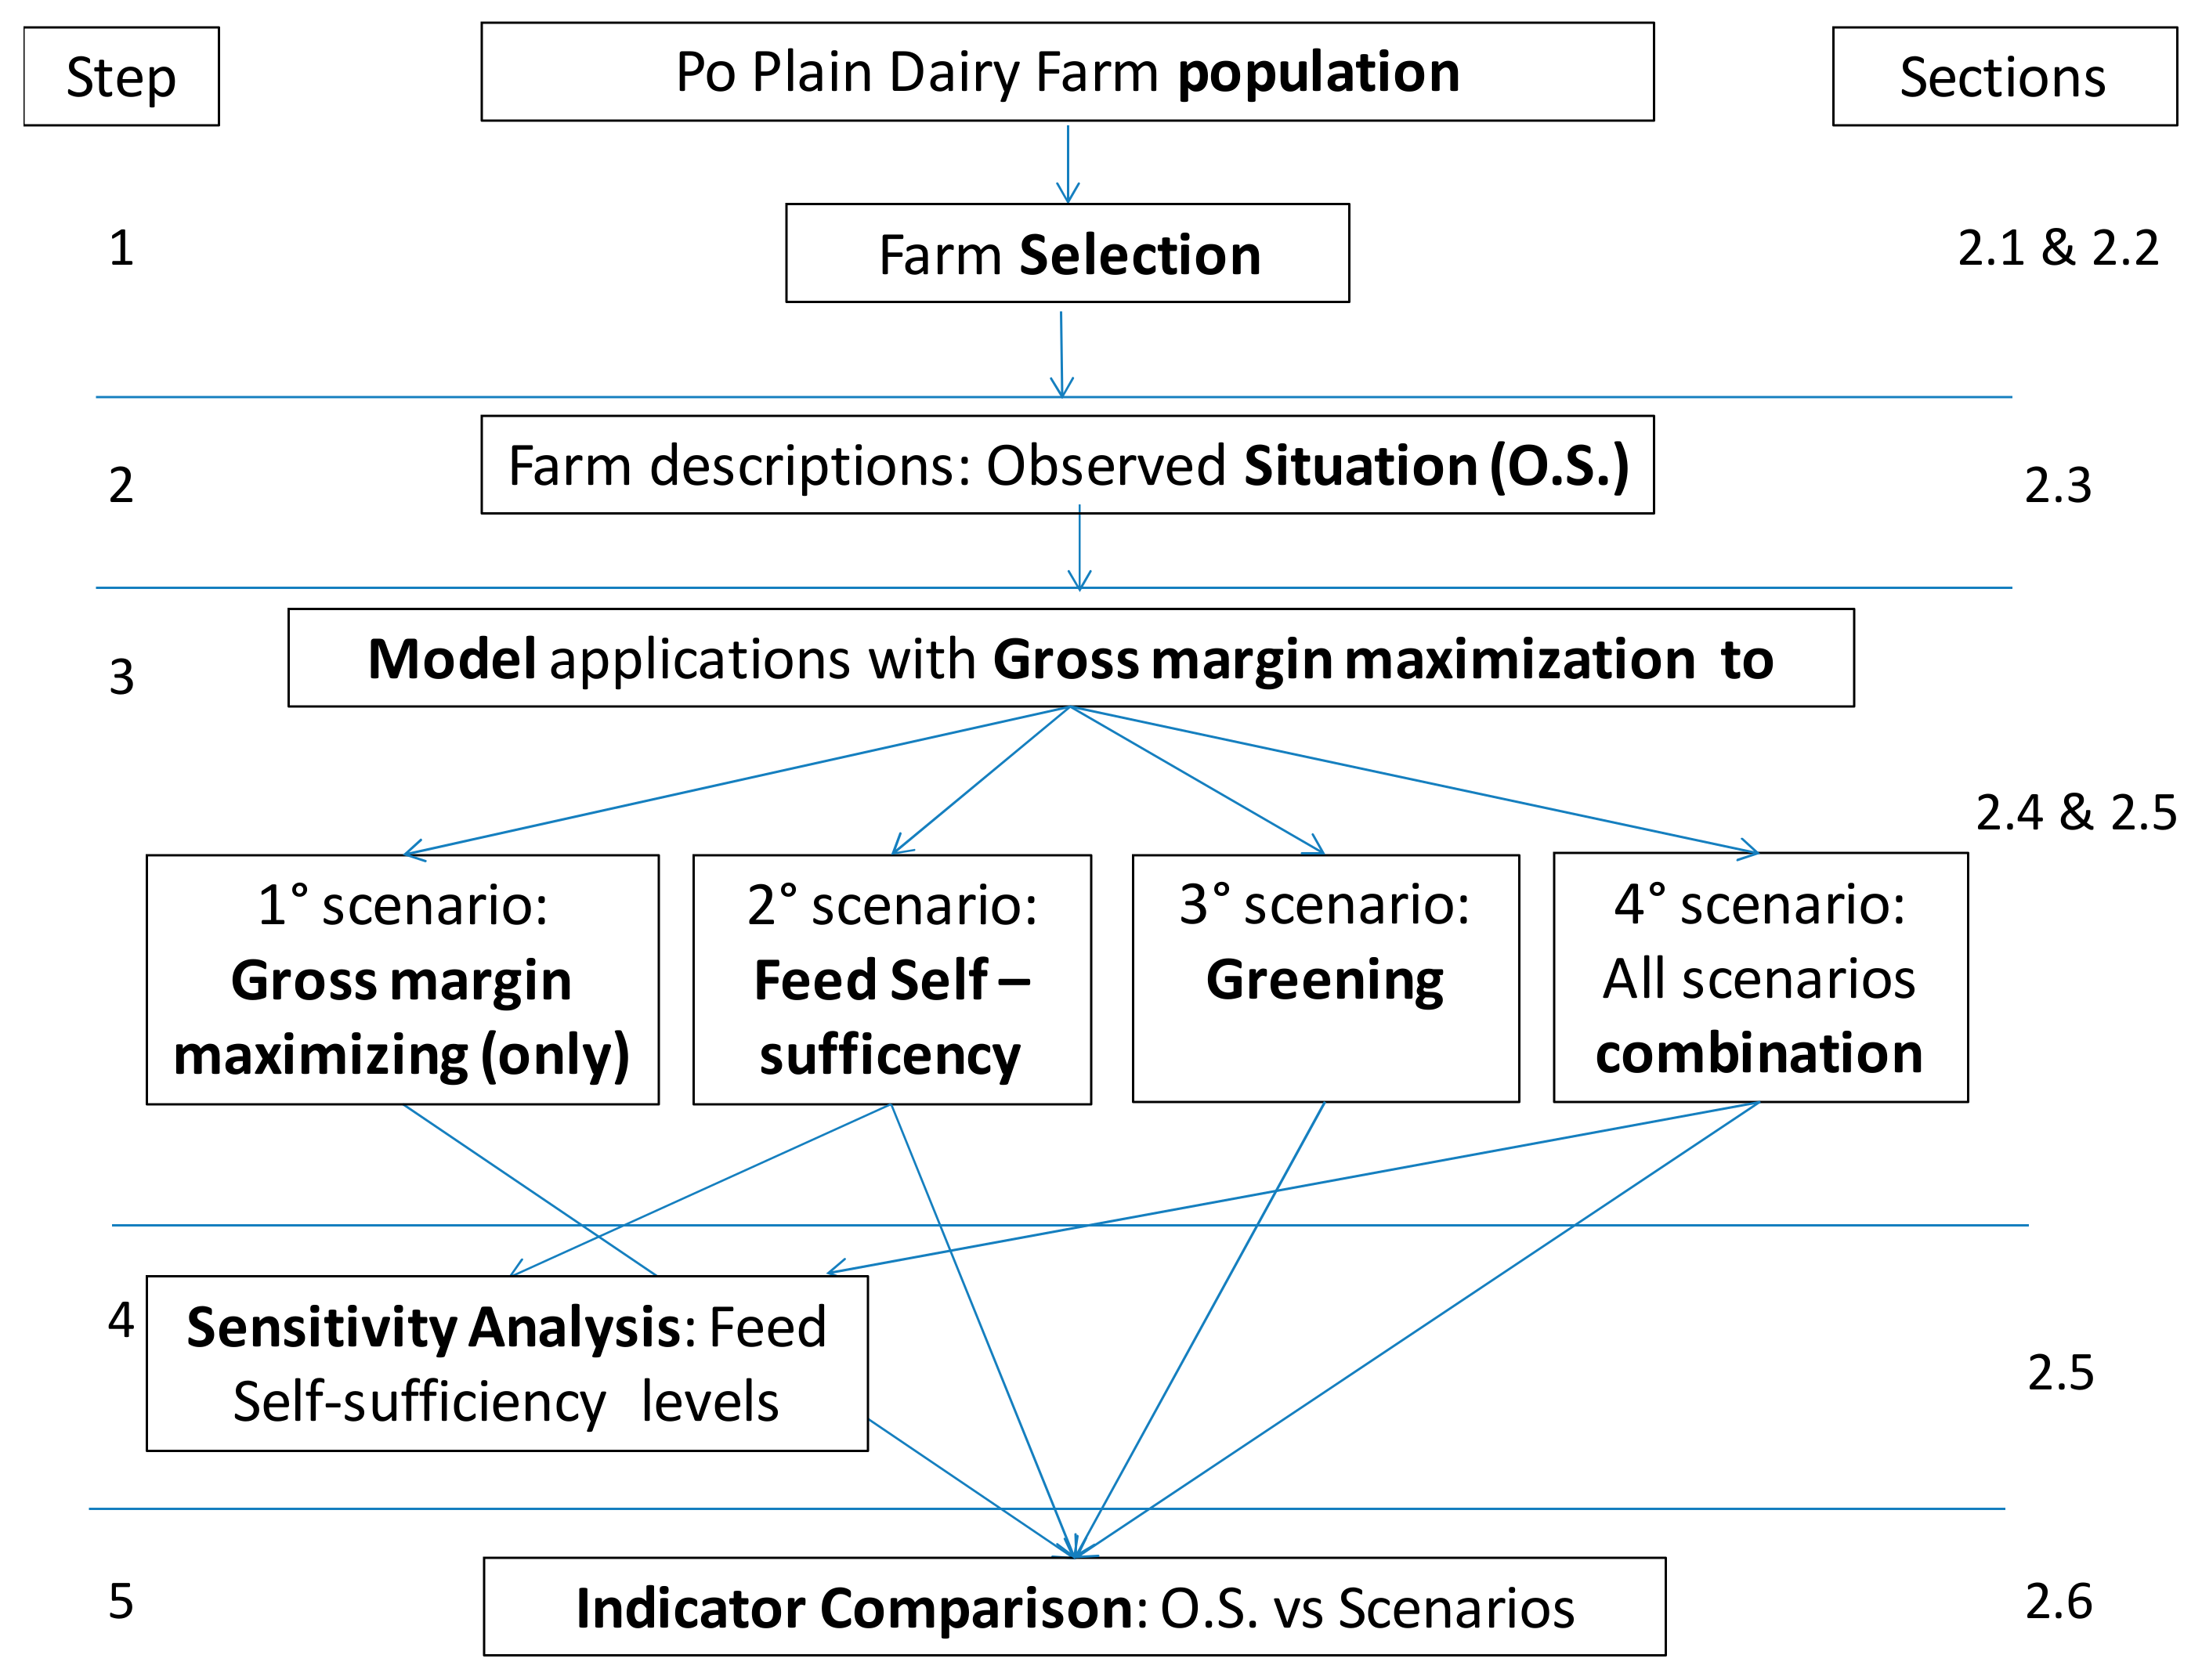
2. Materials and Methods

The assessment has been organised according to the framework presented in Figure 1. After selecting and describing the farms, we investigated gross margin maximising production plans on three representative farms to evaluate current allocative inefficiencies and potential economic improvement compared to the observed situation. Three other different scenarios were investigated to explore their effects on gross margin, cropping system organisation, livestock dimension, and ration composition. Agro-environmental indicators were used to evaluate and compare the economic and environmental performance of the different farms within the different scenarios.

2.1. Study Area and Dairy Farm Population

The study was carried out for the Piemonte Region in the western Po Plain (northwest Italy). The climate is temperate subcontinental, and is characterised by rainy periods in spring and autumn, an annual mean precipitation of 850 mm, and an annual mean temperature of 11.8 °C. The soil types are Inceptisols, Entisols, and Alfisols, and are principally of silt loam and silt textures with a normal or high content of both organic matter (2.24 ± 0.97%) and Olsen P (36.9 ± 30.4 ppm) [40]. The utilised agricultural area (UAA) is approximately 996,000 ha [41]. The primary crops are maize (188,000 ha), permanent and temporary grassland (at least five-year duration) (128,000 ha), rice (121,000 ha), and wheat (86,000 ha). Other secondary crops (in terms of regional extension) are soybean, forages, fruit trees, vineyards, and vegetables. Maize and meadows are usually irrigated. Fifty-six percent of the regional area has been defined as a Nitrate Vulnerable Zone, due to the high nitrate concentration in the groundwater.
The livestock sector includes 860,850 cattle, 991,450 pigs, and 8,487,263 poultry [42]. The total number of professional dairy farms in Piemonte that exclusively breed Holstein-Friesian cows is about 1300 [41]; 1% are organic, while 8% of them have adopted some agro-environmental measures of the rural development program to reduce environmental impact. Average crop yields and milk productions are high when compared to national averages. Maize (Zea mays L.) is the most frequently cultivated crop, with up to 50% of the farm area devoted to its cultivation. Maize is used for grain or silage production. It can also be cropped in combination with Italian ryegrass (Lolium multiflorum Lam.) during winter, if farm roughage is needed. Where maize is not a profitable crop, farms have grassland (cut for silage and/or hay) and winter cereals such as winter wheat (Triticum aestivum L.) and barley (Hordeum vulgare L.). Winter cereals are cultivated as cash crops and to produce litter [40].

2.2. Farm Selection

Based on a previous study in the Piemonte region [43], it was demonstrated that stocking rate is the determining indicator of a farm’s intensification level. Given this finding, the farms having the higher and lower stocking rates were selected from that study to be included in this analysis. Moreover, the organic farm from the cited study was also analysed.

2.3. Farms Description and Survey

Milk production is the main activity of each selected individual farm. Milk sales comprise the largest part of farm incomes. A small part of the income comes from cow and calf sales. Sales of cash crops represent 15% of the farm revenue for the extensive farm, while this value is less than 1% for the intensive and organic farms.
The extensive farm (Table 1) is characterised by a low stocking rate, low silage maize yield, large UAA, lowest grain maize yield, and diversified cropping system. Milk production was high due to the good management skills of the farmer (i.e., genetic selection, animal welfare, housing, with special attention to animal diet). A portion of the farm-produced grain maize and winter cereals (triticale (Triticosecale, Wittm.) winter wheat and barley) was sold, while other grain maize, silage maize, hay from mixed grassland, and lucerne (Medicago sativa L.) portions were used on the farm as livestock feed. Concentrates, cottonseed, and sorghum were purchased. Crude protein (c.p.) was supplied by three main feeds: concentrate at 30% of c.p., farm-grown silage maize, and farm-grown grain maize. The energy (UFL) (feed units for lactating dairy cows) supply was met through three main feeds: silage, grain maize, and farm-produced grass. The self-sufficiency of this farm is intermediate for c.p., while for energy, it does not vary so much among the three farms.
The intensive farm (Table 1) is characterised by a high stocking rate, and high crop and milk yields. Winter wheat was the only cash crop. All of the others crops were reused on farm to feed livestock: grain maize, silage maize, and hay from grassland. Concentrates, barley, and flour of soybean were purchased. The main feeds that supplied crude protein (c.p.) and supplied energy (UFL) were purchased soybean and maize produced on-farm. C.p. self-sufficiency in this case is the lowest, as expected.
The organic farm (Table 1) is characterised by a small UAA and high crop and milk yields. These high yields were achieved through a combination of good animal practices (milking robot use, high animal wellness, and optimal rationing) and a well-managed cropping system (small purchased fertiliser quantities and low gaseous emissions related to the amount of milk production), which were derived principally from double-cropping practices such as soybean plus grain pea or maize plus Italian ryegrass. The single cash crop was pea (Pisum sativum L). All of the other produced crops were used on the farm to feed livestock: grain maize, silage maize, hay from Italian ryegrass, and soybean (Glycine max (L.) Merr.). Concentrates and organic lucerne were bought on the market. Crude protein (c.p.) was supplied by three main feeds: purchased lucerne, farm-produced soybean, and silage maize produced on the farm. Supplied energy (UFL) came from two principal feeds: purchased lucerne and farm-produced maize. The c.p. self-sufficiency of this farm was the highest.
All of the data refer to the years 2009–2010, and were collected between 2010 and 2012 using structured questionnaires that were progressively completed during several face-to-face interviews with 105 farmers.
The milk quota elimination has induced uncertainty in milk production at the European level, which has also been a consequence of global developments, and the milk price decreased in the first years after quota abolition. Impacts on the dairy sector have been large, and the European Commission is planning action to improve the economic viability of the dairy sector [44]. Although these changes also influence the impacts of the greening reform, long-term effects are still uncertain, and we chose to analyse the dairy farms using the milk price before the milk quota elimination in order to evaluate a more stable economic situation.

2.4. Model Description and Application

2.4.1. FSSIM Model Structure

The bioeconomic farm model FSSIM was used to assess the consequences of greening measures contained in the CAP reform 2013 and the effects of increasing feed self-sufficiency on three different farms that reflect the main differences in Italian dairy farms. FSSIM is an optimisation model that is used to maximise farm gross margin subject to the existing resource and policy constrains [21,45,46]. FSSIM has four main components: (i) an objective function; (ii) a matrix of input–output coefficients based on data derived from a farm survey describing its agricultural activities; (iii) a vector of available resources representing farm resource endowments; and (iv) a set of the policy, economic, and agronomic constrains of specific farming systems [21].
The gross margin of a farm is calculated as the total revenues from agricultural products (milk, meat, and cash crops sold) minus the total variable costs due to crop and livestock production. Total variable costs include costs for seeds, fertilisers, irrigation, crop protection, fuel consumption, hired labour, animal feed, and veterinary services. Fixed compensatory payments (subsidies) were not included in the gross margin function of the model, since (as a constant) they will not affect the optimal activity levels. Moreover, as they depend on the history of the farm (average of CAP premium cashed during the three-year period 2000–2002), they lead to differences that do not depend on current management. In contrast, compensatory payments affected by farmer decisions (e.g., greening constrains adoptions) were included in the gross margin objective function.

2.4.2. Livestock and Crop Activities (Current and Alternative)

The following characteristics of farm activities, with their associated parameters and variables, were addressed for each farm: cropping pattern, agronomic technique, crop yields, variable production costs, human labour requirements, numbers of animals with specific herd demography, animal feed and bedding requirements, animal productivity, crop and animal product prices, and livestock management costs. Alternative crops that are already grown in other northern Italy dairy farms were added to the model in each farm where these common crops were not cultivated. The alternative crops considered were wheat, barley, lucerne, soybean, and the double crops silage maize plus Italian ryegrass.
The input–output coefficients for each agricultural activity (e.g., coefficient of “labour requirement” for activity “maize grain cultivation”) were determined from interviews with farmers regarding available resources (e.g., labour availability). Input–output coefficients of alternative crops were calculated as an average of the values among the farms that grew these crops [43]. It was assumed that farmers would continue to grow current crops according to the present management and apply alternative management only to alternative crops [46]. Other crop managements were not considered, as the production values related to the specific soil and climatic conditions of each farm were not available. The input–output coefficients of crops were based on the sum of all of the associated operations (tillage, fertilisation, soil preparation, sowing, harvesting, irrigation, and pest management). In the case of double crops in the same area, during the same year (e.g., silage maize and Italian ryegrass), input–output coefficients were summed and considered as a single activity.
In order to model livestock demographic replacement rates, we used a static approach based on the concept of a cow unit (CU). A CU represents an adult animal and its share of young animals, which are defined according to data collected in farm surveys [47]. CU composition is maintained equal to the current situation to account for farmer’s management skills and farm structure. The number of CUs selected by the model depends on milk price, milk quota, feed costs, animal costs, farm feed availability, and CU feed requirements.

2.4.3. Resource and Policy Constrains

The constrains are used to restrict the available farm resources or impose relevant agricultural and environmental policies. Agricultural activities are constrained by the available resources that are characterised by coefficients (quantity) that represent, for instance, the total available land, total applicable manure, and maximum crop ratio to comply with cross-compliance restrictions.
The sum of the activity levels (ha) was constrained by the total available arable land. Land purchases and sales are not considered in the model, as they represent long-term management decisions. In fact, in north Italy, land is scarce, highly priced, and in low supply. The labour constraint was used to calculate the number of hours of hired labour, given the activity-specific labour requirements and total available family labour. Hired labour was considered as an additional cost. The wage associated to hired labour was determined based on the average region-specific wage rate. Crop production can be sold to the market or used in the farm as livestock feed. Milk production was restricted by the farm-level available quota. Although the milk quota was abolished on 1 April 2015, this has not been considered in the study to keep the focus on the effects of greening and increased self-sufficiency on current farm structures. A variation in the stocking rate also implies a variation in farm structure, and consequently, fixed cost variations should also be accounted for. After the abolishment of the milk quota, many farms increased their herd, which caused problems with manure, nitrogen, and phosphorus. In contrast to nitrate, there is no European Directive or other regulation concerning phosphorus application in agriculture and phosphorus (P) losses from agricultural land. The Nitrates Directive states that eutrophication due to agriculture should be prevented, but phosphorus is not mentioned specifically in this directive. Nevertheless, several actions have been taken by European Member States by means of national legislation or voluntary regional (agro-environmental) action plans [48].
The geographic position determined the manure production constraint. Farms located in Nitrate Vulnerable Zones (NVZ) were limited to 170 kg N ha−1, while farms located in non-NVZs were limited to 340 kg N ha−1. Any excess manure had to be spread outside the farm, and represented a farm cost that was quantified following the market price of transport and spreading manure calculated per ton of N.

2.4.4. Feed Balancing Constraints

The energy and crude protein requirements of the herd were met by a combination of farm-produced roughage feed (fresh, hay, or silage), purchased feed (hay or silage), and purchased concentrates. Feed parameters were calculated per CU following the “French” feed evaluation and rationing system for protein and energy [49,50]. This system was selected as the most appropriate, because it has been widely tested and shown to generate reasonably accurate predictions of livestock performance in both the Mediterranean region and northern Europe [47]. Feed crops such as grass and fodder maize were grown either in rotation with other crops or as monocrop activities. The quantities of on-farm produced and purchased feed depend mainly on crop product prices (including feed) and input prices, logistics, and agronomic decisions. Constrains relating to feed availability and feed requirements were used to ensure that the total energy and protein requirements were met from either on-farm produced and/or purchased quantities of feed and concentrates.
The ratio between forage (maize silage, grass, and hay) and concentrate was constrained in the animals’ diets to prevent the diseases that come from high concentrate amounts. For this reason, the ratio of energy derived from concentrate feed has been constrained to a maximum of 46% of the total energy intake. This value represents the average percentage of concentrates utilised in rations of the specialised dairy farms on the Po Plain.

2.5. Definition of Scenarios

After the description and assessment of the observed situation, four alternative scenarios were developed: gross margin maximisation, feed self-sufficiency, greening, and a combination of the three.

2.5.1. Gross Margin Maximising Scenario

In the Gross Margin-Maximising scenario, optimal activity levels were defined in order to maximise the farm’s gross margin, considering only the resource and policy constrains described above. Risk aversion, which usually induces crop diversification, was not considered, as the aim of this model application was to identify resource use inefficiencies and propose more efficient alternative solutions, knowing that other cultural and social aspects drive farm decisions. This scenario provides information on the potential for improvement within the current biophysical, socio-economic, and institutional environments.

2.5.2. Feed Self-Sufficiency Scenario

According to Fumagalli et al. [51], the N content of purchased feed is the most important source of nitrogen in dairy farm, and farm gate N balance is one of the indicators that better informs about this. The feed self-sufficiency scenario targets at reduced purchased feed inputs, which consequently would increase the feed self-supply indicator and reduce the farm gate N balance. This is possible by adapting the cropping system and adjusting the stocking rate, according to the optimised cropping system capacity to feed the livestock.
Still based on gross margin maximisation, the scenario contained two additional constrains:
  • Maximum 10% purchased crude protein of livestock requirement.
  • Maximum 10% purchased energy (UFL) of livestock requirement.
The first constraint was determined by dividing the crude protein content of off-farm feed by the total amount contained in the animal diet. The same calculation was employed for energy. Crude protein and energy concentrations were obtained from farm analysis.

2.5.3. Greening Scenario

The impacts of greening measures—as proposed by the CAP reform 2013–2020—on dairy farms were explored. The greening scenario also considered gross margin maximisation as the main objective, accounting for the different policy constrains described according to EU regulation COM (2011) 625 final/2 [23]). The EU regulation includes the following three articles:
-
Crop diversification (Article 30). Simplifying, this requirement applies to farmers with over 10 ha of arable land. In farms up to 30 ha, farmers have to grow at least two crops, and the main crop cannot cover more than 75% of the land; in farms over 30 ha, farmers have to grow at least three crops, with the main crop covering at most 75% of the land, and the two main crops at most 95%.
-
Permanent grassland (Article 31). Simplifying, environmentally valuable grasslands cannot be ploughed or converted;
-
Ecological focus area (Article 32). Simplifying, farmers with arable areas exceeding 15 ha must ensure that at least 7% of such areas (excluding permanent grassland) is an “ecological focus area” that includes field margins, hedges, trees, fallow land, legumes, landscape features, biotopes, buffer strips, and/or forested areas.
When all the three constrains were met, a greening premium, calculated as a no-CAP penalty-based payment of 250 €/ha, was added to gross margin. The subsidy level of 250 €/ha was calculated based on historical common agricultural policy (CAP) payments of 200 dairy farms in Piemonte for the period 2000–2002. Following the EU directives, the greening premium was 30% of the total premiums received [23] with reference to the period 2000–2002 (Reg. CE 1782/2003) [52] divided by the land covered by the premium.
Further releases of the European Regulation [53,54,55] assigned a coefficient to calculate the EFA surface value to nitrogen-fixing crops equal to 70% of their effective surface, and included cover crops (EFA surface value coefficient equal to 30% of the effective surface), but maintained the share of EFA to 5% even after 2017, making greening application less restrictive. Moreover, administrative penalties were introduced by EU Regulation 640/2014 [53], based on the variable rates of greening constrains fulfilment. They have been specifically studied by other authors [56,57,58]. In the current situation (2017), the average national greening premium is about half that of the greening premium adopted in this study, but the penalty system introduces further reductions in gross margins, and future changes are still expected. In the context of this study, the more restrictive rules chosen in the initial proposal were adopted in order to analyse a scenario that was anticipated as being more environmental-friendly.
Additional alternative activities that can serve as an ecological focus area (EFA) were included in the model. We included nitrogen-fixing crops (ecological crops) that are currently quite common to the area such as lucerne (Medicago sativa L.), soybean [Glycine max (L.) Merr.], permanent grassland, and fallow, as they can all contribute to an increased connection between crop and livestock systems. Official statistics also show that they represent the main land uses adopted in Italy as EFA during the first application of the greening rules [59]. Field margins, hedges, trees, landscape features, biotopes, buffer strips, and forested areas were not included. Although they are valuable for increasing biodiversity, they are not aimed at solving nutrient imbalances and connected inefficiencies. Official statistics show that they were very little adopted in Italy. On the other hand, the advantage of nitrogen-fixing crops is that they can fix nitrogen and grow without nitrogen additions (mineral and organic) and pesticide application.
Yields, adopted agronomic techniques, and variable costs were derived from the Tetto Frati long-term experimental database [60,61].

2.5.4. Combination of Feed Self-Sufficiency and Greening Scenario

The combination of all the previous scenarios was also explored analysing the possible positive or negative interactions between the effects of the self-sufficiency restrictions and the related greening policies.

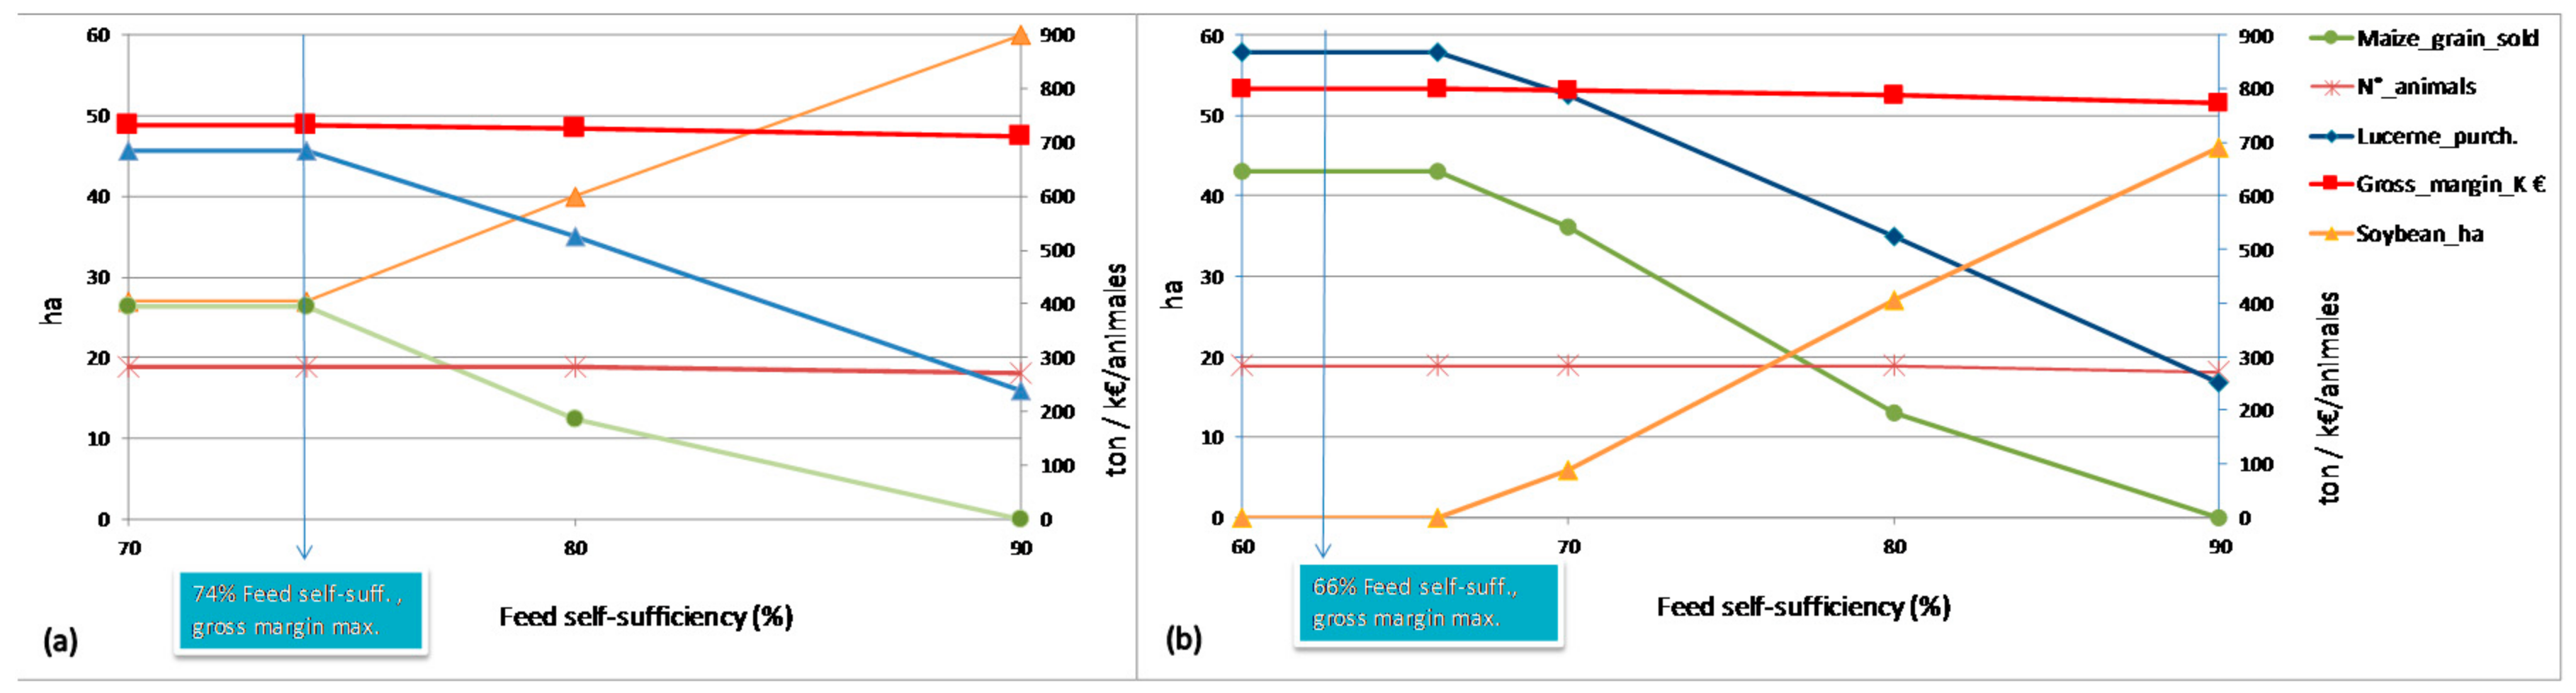
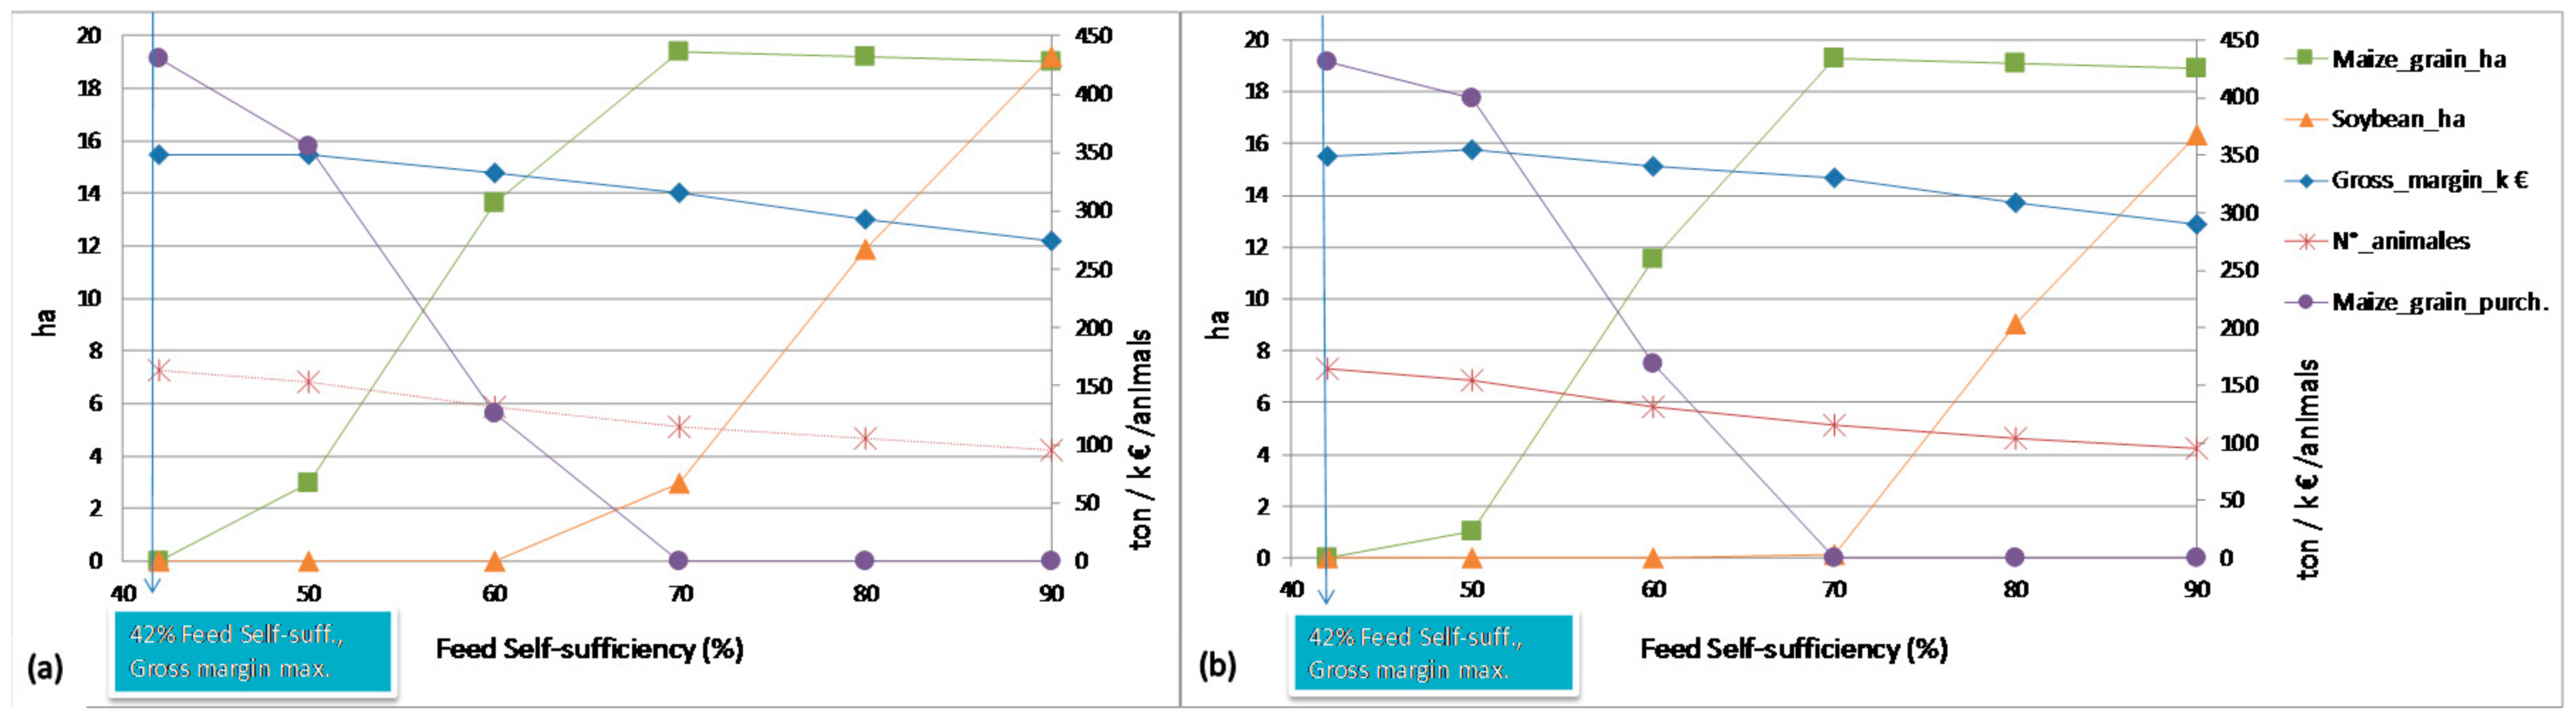
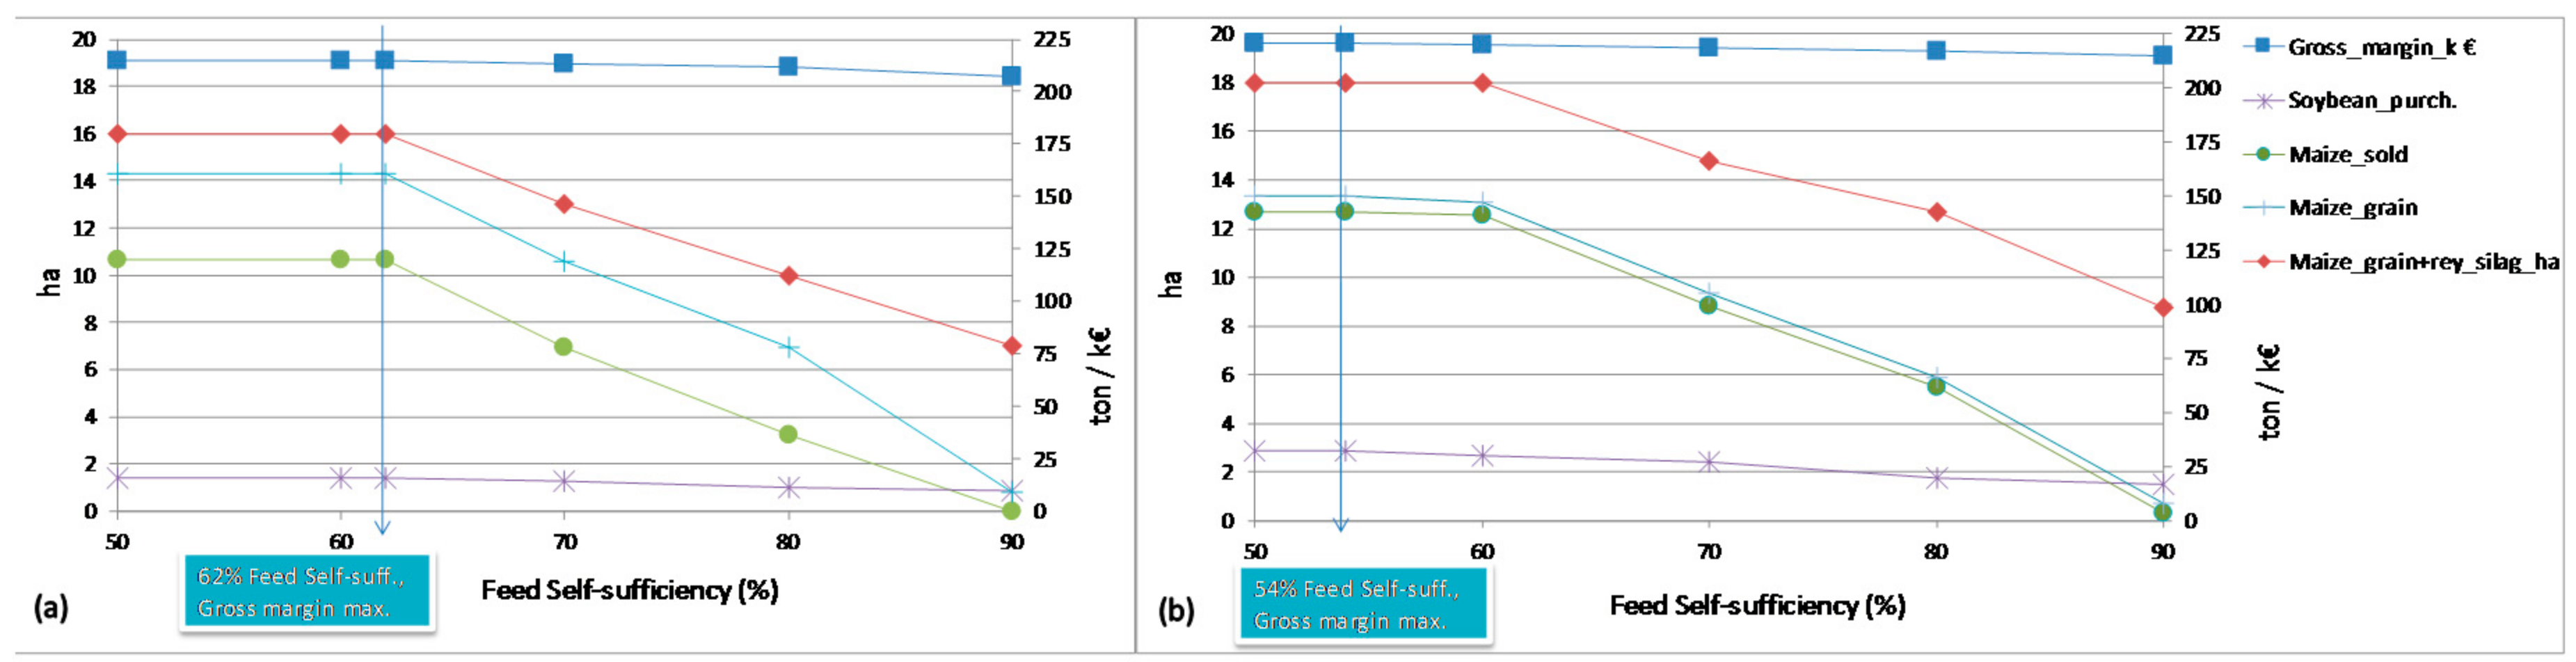
2.5.5. Sensitivity Analysis

A sensitivity analysis was carried out in order to explore the effect of different levels of feed self-sufficiency (FSS) of both crude protein and energy on a farm’s gross margin, cropping patterns, and ration composition. The two values of FSS were always kept equal in all of the simulations. We imposed different levels of self-sufficiency from the level achieved in the gross margin maximising scenario up to a maximum of 90%. Sensitivity analyses were done both accounting for greening constrains or not.

2.6. Scenario Comparison through Indicators

The economic and environmental performances of the three farms under the different scenarios were evaluated through indicators, and then compared to the observed farm situation. Eight indicators, which are related to the economic, environmental, and production efficiency aspects of the farm, were calculated at the farm scale.
All of the indicators were derived from recent literature [43,62], where they have been extensively described. We selected two economic indicators:
  • Cropping system production (€ ha−1), which was calculated as the per ha total revenues (yield per crop prices) hypothesising all of the products from cropping activities being sold;
  • Milk production (€ ha−1), which was calculated as revenues from milk production per ha.
Four environmental indicators were selected:
  • Farm gate nitrogen balance (FGNB, kg N ha−1)
  • Farm gate phosphorus balance (FGPB, kg P ha−1)
  • Ammonia emissions from farm (AE, kg NH3 ha−1)
  • Greenhouse gases emissions from farm (GHG, kg CO2 eq ha−1)
In addition, two eco-efficiency indicators were considered:
  • Nitrogen eco-efficiency (NEE, kg milk kg N surplus−1)
  • Gaseous emissions of milk production (GHGMP, kg milk kg CO2 eq−1)
Economic indicators were calculated directly by the FSSIM model. Environmental and production efficiency indicators were calculated using FSSIM output.

3. Results

3.1. Extensive Farm

3.1.1. Gross Margin and Farm Plans

The gross margin maximised by the model is always above that calculated in the observed situation (Table 2), which suggests a large potential to improve farm management, even though we know that the model represents a simplification of the reality. The highest gross margin (2647 € ha−1 excluding subsidies) was achieved in the gross margin maximising scenario by specialisation, which decreased the area of crops such as winter cereals, lucerne, and silage maize. Soybean was selected as an alternative crop. The levels of grain maize area and especially grassland were increased substantially.
Within the self-sufficiency scenario, all of the farm surface was devoted to livestock feeding to comply with the self-sufficiency target. However, the total feed production was not enough to cover the feed requirements of the current number of cows. For that reason, the number of cows decreased marginally (−5%). Analysis of the cropping pattern shows that the optimal level of permanent grassland was almost the same as that in the gross margin maximising scenario. At the same time, the grain maize surface was similar to the observed situation, and soybean area replaced the silage maize, lucerne, and cash crops surface in order to increase the protein source from within the farm. The 10% total crude protein requirements could be fully met with lucerne hay purchases. For energy requirements, some maize flour was purchased. Additional crude protein and energy requirements were met with soybean, grain maize, and grass produced on-farm. Moreover, lucerne, hay, and a very small quantity of maize flour was purchased. The self-sufficiency scenario resulted in the lowest gross margin (i.e., 3% lower than in the gross margin maximising scenario, but 11% higher than the observed situation).
The greening scenario did not introduce further limits to the number of bred cows, other than the milk quota constraint, which remained constant. The grassland area increased substantially, and the grain maize surface was doubled compared with the observed situation. The silage maize area decreased considerably. A portion of the produced grain maize was sold. Double cropping (silage maize plus Italian ryegrass) was selected in the greening scenario as an alternative crop to cover the energy requirements of the livestock. Greening constrains were considered appropriate, and the ratio of surface that was designated as the ecological focus area (EFA) was cropped as ecological lucerne (in both scenarios with greening measures). The crude protein and energy livestock requirements were derived from a combination of produced and purchased lucerne and grain maize, plus grass produced on-farm. Good economic results were obtained by the greening scenario (over 2600 € ha−1 + 250 € for greening premium).
The Self-sufficiency + Greening scenario was more constrained by the feed self-sufficiency constraint than it was with the introduction of ecological lucerne and maize for silage in combination with Italian ryegrass. Intermediate economic results were obtained by the combination of the two scenarios (2537 € ha−1 + 250 € ha−1 for greening premium).

3.1.2. Sensitivity to Feed-Self-Sufficiency Requirements

As far as the results of the sensitivity analysis are concerned (Figure 2), maximum gross margin was achieved with a feed self-sufficiency at 74%. As expected, imposing higher levels of feed self-sufficiency caused a reduction in gross margin. On average, every percent of feed self-sufficiency (from 74% to 90%) costs five € ha−1.
It was possible to maintain the number of animals until 80% of feed self-sufficiency. Therefore, the gross margin reduction in this range is only due to cropping system rearrangement and the lower sold quantities of grain maize. From 80% to 90%, a further gross margin reduction was provoked by less bred animals. A reduction in purchased lucerne, an increase in the surface area covered by soybean, and a further reduction in sold maize were other consequences.
Similar trends can be found with the greening constraint application, where the maximum gross margin was reached at 66% feed self-sufficiency. The number of animals again started to be reduced after 80% of feed self-sufficiency, while the “cost” for each percent of feed self-sufficiency was on average four € ha−1.

3.1.3. Impacts on Economic and Agro-Environmental Indicators

Economic and agro-environmental indicators were used to evaluate and compare the economic and environmental performance of the different scenarios for the different farm types (Table 3).
Cropping system production was, on average, higher in the different scenarios than in the observed situation. Farm management improvements derived mainly from the adoption of alternative crops or from the substitution of winter cereals with more profitable crops, such as grain maize, soybean, and lucerne. Milk production on the extensive farm showed only a 4% reduction in the Feed Self-Sufficiency scenarios. Greening constrains seemed not to affect milk production on the extensive farm.
Increased feed self-sufficiency decreased farm gate N and P balances due to the reductions in animal numbers, which indirectly caused the emissions indicators (greenhouse gases and ammonia emissions) to decrease. The extensive farm already manifested low nutrient balances in the Gross Margin-Maximising scenario (150 kg N ha−1; 19 kg P ha−1), but after increasing feed self-sufficiency, the model further reduced N and P surplus by 17% and 16%, respectively, due to reduced nutrient feed inputs. In the case of N, this reduction was mitigated by the rise of N that was biologically fixed by legumes. GHG emissions decreased by 6%, which was a similar value to the animal contraction, while ammonia emissions decreased by 14% due to minimal manure spreading.
In the Greening scenario, N balance and GHG emissions increased slightly. The N surplus was caused by the increased mixed grassland surface and the related N that was biologically fixed by the legume species. The increased GHG emissions were caused by an increased grain maize surface area, which emitted more CO2 than the other crops.
On the extensive farm, production efficiency in the alternative scenarios was similar to the observed situation. Milk production per ha, which was particularly low in the observed situation, was further reduced under the Self-Sufficiency scenario. N surplus and GHG emissions were already low, so the scenarios did not improve the N eco-efficiency or carbon credit.

3.2. Intensive Farm

3.2.1. Gross Margins and Farm Plans

In general, the results of this farm were quite different compared to those of the extensive farm (Table 4). The farm plan of the intensive dairy farm is close to optimal in the observed situation in terms of gross margin. Notwithstanding, the farm under the observed situation exceeded feeding requirements, and the model consequently proposed to change the cropping system to better fit with animal rations: grassland area and silage maize + ryegrass area were increased, maize for grain and silage as a single crop were reduced, and the cash crop area was entirely eliminated. Under this scenario, the animal number was kept constant, but the feeding strategy that was proposed was based on the new cropping system and buying more maize flour, but no concentrates.
The self-sufficiency constrains reduced gross margin by 21%, which was much more than that of the extensive farm. All of the available land was allocated to livestock feed to meet the self-sufficiency target. However, the total production was not sufficient to feed the current number of cows, and consequently, the number of cows was reduced substantially (−43%). Analysis of the cropping system showed that the grassland area increased compared to the observed situation; the grain maize area strongly increased to meet livestock energy supply needs. The area of silage maize was reduced both as single and double-crop activity. In order to increase the protein sources within the farm, soybean was introduced as an alternative crop. This implied that the crude proteins and the energy required by livestock were derived from soybean, grain maize, and grass, plus a very small quota of silage maize produced on the farm. As the amount of soybean produced on the farm was insufficient to feed the animals, the allowed purchased quota was used for soybean.
The greening option was considered to be not economically viable on this farm, so it was not selected for the Greening scenario; the results of this analysis were equal to the results of the Gross Margin-Maximising scenario. This means that the costs of changing the farm plan were higher than the benefits of the greening premium of 250 € ha−1.
The combination of the two scenarios made greening an interesting proposition, as the number of animals was largely reduced, and the farm became less intensive. In fact, the cropping system became very similar to that selected in the Self-Sufficiency scenario. The surface designated as the EFA was cropped with ecological lucerne, which reduced the soybean area. Consequently, the crude protein supplied through soybean was decreased and replaced by the lucerne quota. From an economic point of view, when subsidies are excluded, the combination scenario resulted in a slightly lower gross margin compared to the Self-Sufficiency scenario: 3827 € ha−1 (4077 € ha−1−250 € ha−1 of subsidies) vs. 3858 € ha−1; the difference (31 € ha−1) has been largely filled by subsidies.

3.2.2. Sensitivity to Feed Self-Sufficiency Requirements

In the intensive farm, the level of feed self-sufficiency corresponding to the Gross Margin-Maximising scenario was 42% (Figure 3). The increase in feed self-sufficiency caused a much larger reduction in gross margin than in the extensive farm, i.e., 22 € ha−1 on average for every percent of feed self-sufficiency (from 42% to 90%). However, this reduction was lower from 42% to 70%, and higher from 70% to 90%. The reduction in gross margin is highly correlated to the reduction in the number of animals (Pearson correlation’s: 0.96). With an imposed feed self-sufficiency of 50%, 60%, 70%, 80%, and 90%, respectively, the number of animals reduced to 94%, 80%, 71%, 64%, and 58% compared to a feed self-sufficiency of 42%.
In the range of 42% to 60%, feed self-sufficiency was achieved by reducing the surface of self-produced silage maize and increasing the surface invested in grain maize, thus reducing the purchased feed. Beyond 60%, further feed self-sufficiency could be achieved by self-producing soybean. This underlines again the low economic farm interest to produce crude protein on-farm instead of buying it on the market.
In case of the Greening scenario, greening constrains were not selected, as it was most convenient to optimise the cropping system without including an EFA. Nevertheless, when imposing a feed self-sufficiency equal to 50% or higher, greening became economically viable when choosing ecological lucerne. Most of the observed trends were similar to the scenario without greening, but, as some crude protein became available on farm from ecological lucerne, soybean production became necessary only when feed self-sufficiency needed to be larger than 70%.

3.2.3. Impacts on Economic and Agro-Environmental Indicators

On the intensive farm, cropping system production was on average higher in the different scenarios than in the observed situation (Table 3). As expected, the strong limitation to purchase feed for livestock reduced the livestock number, and then the animal density, with an important consequence for milk production. This occurred most on the intensive farm, where it was more difficult to adapt already efficient cropping systems to livestock system requirements.
The scenarios had large impacts on both the economic and agro-environmental indicators. In the Feed Self-Sufficiency scenario, N and P surplus decreased by 65% and 75%, respectively, for several reasons: a large animal number reduction (43%) decreased purchased feed inputs, and the cropping pattern changed. Gaseous emissions strongly decreased. Ammonia emissions were affected not only by the lower number of animals (less manure), but also by less urea spread due to a reduction of maize surface and increased grassland and soybean areas. The trend of GHG emissions trended with the decreased animal count, but it also followed from reduced N2O emissions from the new cropping patterns comprised of more grassland, soybean, and ecological lucerne.
The intensive farm showed intermediate values for N eco-efficiency; it combined high milk production with high N surplus. The value obtained for this indicator equalled 80 kg of milk per kg of N surplus−1, which was identified as the target for conventional dairy farming systems by De Simone et al. [63]. The carbon credit indicator of the intensive farm performed best among all of the farm types. Although the farm showed high GHG emissions, the values were compensated by very high milk production.

3.3. Organic Farm

3.3.1. Gross Margins and Farm Plans

The Self-Sufficiency scenario was the most limiting from an economic perspective, whereas the Greening scenario led to a gross margin that was just 1% lower than the Gross Margin-Maximising scenario not counting subsidies, and 27% more than the observed situation (Table 5).
The observed situation of the organic farm was characterised by a high quantity of feed supply, in comparison to the estimated livestock requirement. In the Gross Margin-Maximising scenario, the four double-crop activities were reduced to two: grain maize + silage ryegrass and grain pea + soybean remained, while soybean after ryegrass and silage maize after ryegrass were not selected.
The self-sufficiency constrains caused no limits in animal numbers and no substantial changes in the feed composition. Double cropping with silage maize + ryegrass and grain maize + silage ryegrass was maintained very similar to the observed situation. Some crops were removed from the animals’ diets as they exceeded feed requirements, and more economically favourable crops were grown to increase gross margin. Grain pea was maintained as a cash crop. Concentrates were also removed from the animals’ diets as they exceeded crude protein requirements, and purchased lucerne was substituted with two hectares of grown lucerne. Some additional feedstuffs were bought to capitalise on the allowed quota of purchased feed and maximise sold grain pea.
In the Greening scenario, the grain maize + silage ryegrass area was increased, while silage maize after ryegrass were not selected. The farm complied to the greening measures by ecological lucerne cultivation, similar to the other farms. About 50% of grain maize and 100% of pea grain and lucerne hay were sold. Most of the crude protein and energy required for the livestock came from maize grain, ryegrass silage, purchased silage maize, and both purchased and self-produced soybean.
The combination of the two scenarios approached the Self-Sufficiency scenario, but required the inclusion of the two ecological crops represented by lucerne and soybean. Feed requirements were very similar to those in the Self-Sufficiency scenario, with an increased quota of purchased soybean and no purchased maize flour.

3.3.2. Sensitivity to Feed Self-Sufficiency Requirements

The feed self-sufficiency level in the Gross Margin-Maximising scenario was 62%, and with greening, it was 54%. As far as the results of the sensitivity analysis are concerned (Figure 4), increasing levels of feed sufficiency implied slight reductions in gross margin that reached −4% in the Gross Margin-Maximising scenario and −3% with the greening constraint, when 90% of feed self-sufficiency was imposed. Although the stocking rate was higher than on the extensive farm, the organic farm was able to maintain the number of animals due to the higher productivity of the different crops. The reduction in farm gross margin was only due to a rearrangement in cropping systems and a reduction in sold grain maize. Consequently, this farm seems to be more resilient to the increase in self-sufficiency than the other two. The greening constrains did not change the general effect of the feed self-sufficiency on the system.

3.3.3. Impacts on Economic and Agro-Environmental Indicators

In the organic farm, results related to the agro-environmental and economic indicators were completely different compared with the other two farms (Table 3); both greening constrains and feed self-sufficiency targets reduced cropping system production. The Feed Self-Sufficiency scenario limited cropping system production in organic farms more than greening did.
Greening constrains seemed to not affect milk production on the organic farms. Milk production, expressed as € ha−1, was also influenced by milk prices. Organic milk production benefited from a special price.
On the organic farm, only the N balance decreased in both scenarios. These results were attributed to cropping system changes (N-fixing crops) that were associated with decreased purchased feed inputs and increased crop sales. Gaseous emission indicators generally were not influenced by the scenarios. Only in the combined scenario of Feed Self-Sufficiency + Greening did ecological crops reduce CO2 emission equivalents slightly, due to the reduced use of mechanisation.
The organic farm reached very high values for N eco-efficiency in all of the scenarios due to its high milk production and very low N surplus. In contrast, the carbon credit indicator was relatively low for the organic farm due to its higher GHG emissions.

4. Discussion

4.1. Using Bioeconomic Farm Models for IA of Policies

In this study, the bioeconomic farm model (BEFM) FSSIM was adapted and used for policy assessment. BEFMs are widely used tools to assess the impacts of future scenarios on a diversity of farms [64,65,66]. Although farmers have multiple objectives, assuming gross margin maximisation under a normative approach is most common [38,67]. The main reasons are as follows. (i) Inintensive agricultural regions in Europe, gross margin maximisation is in general the most important objective of the farmer e.g., [39,68]. (ii) We focus on evaluating drastic policy changes, and consequently, a positive mathematical programming (PMP) calibration approach that uses historical information to improve the predictive capacity of the model and make short-term predictions of farm responses can be questionable and less transparent than a normative approach. Moreover, parameterising a PMP model appropriately requires data and specific assumptions on model parameters that are not easy to obtain [69], especially parameters related to new or alternative technologies. (iii) In order to include multiple objectives, interviews with farmers are needed, while at the same time, objectives differ per farmer, and farmers do not always do what they say [68].
Therefore, we chose to consider gross margin maximisation as the objective function, and reveal and discuss what the implications of this objective are for the scenarios regarding feed self-sufficiency requirements and greening policies. We are confident that the results provide relevant insights on the impacts of these scenarios.

4.2. Gross Margin-Maximising Scenario

In the Gross Margin-Maximising scenario, the gross margin of the organic farm increased more than the extensive and intensive farm (i.e., 38% compared to 16% and 0.2%, respectively).
For all of the farms, the optimal strategy in the Gross Margin-Maximising scenario was crop specialisation, including decreasing the area of cash crops in order to increase the feed self-sufficiency and decrease the cost of animal feeding. Sensitivity analyses on the level of self-sufficiency indicated that complete self-sufficiency is not an optimal strategy from an economic point of view, because it is not possible to fulfil the potential protein and energy requirements of a large number of cows with on-farm production. Determining factors for the optimal level of self-sufficiency were feed prices, crop yields, the maximum stocking rate determined by milk quota and cow production, the cow feed requirements, and the policy constrains (crops rotation, N derogation).
Comparing the results achieved by the Gross Margin-Maximising scenario with the observed situation, on the extensive farm, the self-sufficiency increased. On the intensive farm, the self-sufficiency decreased in term of energy, while it was kept quite equal in terms of crude protein. On the organic farm, the self-sufficiency decreased in terms of energy requirements, while it increased in terms of crude protein.
Moreover, the surface covered by silage maize was generally decreased and cropped with grain maize, soybean, and grassland to replace purchased concentrates and satisfy animal energy and protein requirements. Currently, dairy farmers in the Po Plain usually decide to cover a large share of the animal feed requirements with silage maize. This is because of several reasons, including: (i) the high biomass production level; (ii) the well-understood silage technique; (iii) the easy storage; and (iv) the high nutritional value. Furthermore, silage maize must be produced on-farm, as exchanges among farmers—especially in intensive dairy regions—are very limited because it is not economically sustainable to transport this product over long distances, given its weight and price. Only biogas plants are able to promote silage maize markets, because they are willing to pay a higher price, knowing that most of them will receive subsidies per unit of energy produced (0.28 € kWh). Currently, farmers prefer to buy concentrates, because this gives them more freedom to choose the nutritional composition of the diet for their animals, and plan their cropping systems (species and number of crops, rotation, and date of sowing/harvest). Nonetheless, recent maize and soybean price volatility has caused increased uncertainty about concentrates and crop costs. This phenomenon has reached the point where maize silage-based diets that are highly dependent on additional purchased concentrates to meet protein demand no longer constitute the most economically attractive solution [10]. The FSSIM model does not take into account the farmers’ reluctance to switch to another feed strategy; it considers only the profitability of the solution. For this reason, farmers never select purchased concentrates, because they have a high cost per unit of protein, and choose crop maize for grain, legumes, and grassland.
Most of the economic, environmental, and efficiency indicators were similar or better in the Gross Margin-Maximising scenario compared with the observed situation due to an improved management of the cropping system. This shows that the maximisation of income can lead to a more efficient use of resources, resulting in a positive impact in environmental terms. While there are often trade-offs between economic and environmental results, becoming more efficient in terms of inputs and outputs can often lead to synergies. Other examples of coupled positive results are reported in relation to conservation tillage [70], integrated farm management [71], and crop rotation [72]. Also, precision farming is based on the idea that increased environmental and economic sustainability could be reached through fertiliser, pesticides, and water input reduction [73,74], while maintaining high crop productivity.

4.3. Self-Sufficiency Scenario

The Self-Sufficiency scenario aimed to increase the recycling of on-farm produced feed up to 90% for both energy and crude protein. This scenario represented a quite important challenge in terms of farm organisation and feed strategy.
Current values of FSS varied among farms mainly for crude protein. Generally, the FSS scenario here analysed led to: (i) an increase of the productivity of the cropping system; (ii) a reduction of produced milk; and (iii) an improvement of all of the environmental and eco-efficiency indicators, resulting in greater sustainability. The intensive farm was most affected by this improvement, and the extensive farm was the second most affected, while effects on the organic one were not always positive. The increase in self-sufficiency that was needed to reach the 90% target perfectly described the increasing environmental improvement obtained by the different farms.
Although this scenario is interesting from an environmental point of view, it is economically the worst due to a reduction in the stocking rate and substitution of cash crops by fodder crops (or fodder use) and by crops with higher crude protein content. On the extensive farm, the stocking rate, which was already low in the observed situation and in the Gross Margin-Maximising scenario, was further reduced due to the absence of very productive crops. The presence of highly productive and efficient crops is essential to be able to reach high values of feed self-sufficiency. In the observed situation, extensive farm land is less productive than the other types of farms, because extensive farms are not able to achieve high yields on a large area. Furthermore, various factors can influence the relation between feed self-sufficiency and stocking rate, including: soil quality, crops yields, farm logistics capabilities (e.g., percentage of double crops), the structure of the animal module (cow unit), and the requirements of animals related to milk and meat production. Compared to the observed situation, this scenario also implied a generally strong cash crop reduction. This reduction derives from the need to expand grain maize, grassland, and soybean area, so that it is easier to comply with animal feed requirements.
On the intensive farm, the stocking rate was high, and feed self-sufficiency requirements led to a strong reduction in the number of cows. Maize for grain and soybean are the two crops that are more efficient in providing crude protein and energy to the herd, and therefore, their areas were largely increased to provide the feed, while no products were sold under this scenario.
On the organic farm, the optimisation of the cropping system enabled the maintenance of the same number of cows, thanks to the large part of the crude protein requirement already produced on-farm, given its particular cropping management. The reduction of concentrates with high protein content contributed to the reduced farm N gate balance (see also [40,75,76,77,78]), and consequently improved the ammonia emission indicator.
In contrast to aiming for feed self-sufficiency, a net separation between cropping and livestock systems can lead to intensive landscapes of cereal production without livestock on the one hand, and a high concentration of livestock production on the other hand, such as in Brittany (France) [11]. The distance between two such agro-ecoregions could also be as wide as between the arable land in South America (soybean production) and the European intensive livestock system. The modification of dairy farm cropping patterns and the inclusion of alternative protein crops would be necessary, although not possible on all of the farms, to comply with the Self-Sufficiency constraint without reducing the number of cows. In addition, the replacement of winter cereals with legumes and grain maize has also increased the cropping system production indicator.
With the abolishment of the milk quota in 2015, the number of cows per farm has been slightly increased [79]. It is clear that with a higher number of cows, it is more difficult to achieve a high level of self-sufficiency, so if this is to be supported, additional policies may be needed.

4.4. CAP 2013 Reform, Greening Application

The only crops introduced as EFA were N-fixing crops. The actual greening policy requires 5% of EFA, but N-fixing crops have a corresponding value in terms of area that is only 70%. The combination of the two coefficients leads to a final request of EFA area that is very close to the simulated value of 7%.
Actual European regulations make greening applications less economically interesting, but easier to be applied than what was simulated here. Farmers are more pushed to adopt them based on greater penalties applied to non-compliance. The results presented for this scenario are based on stronger constrains, as specified in the “Material and Methods” section, than those that are actually applied.
The extensive farm easily adopted the greening constrains: it already has a low stocking rate, large surface, and an inclination for grassland cultivation, which was promoted in the greening strategies in the Greening and Greening + Self-Sufficiency scenarios. The greening policy will thus not lead to a change in this type of system. Income will only increase due to the extra subsidies.
Organic farms do not need to respect greening constrains, because they automatically benefit from the payments [54]. The Commission Regulation suggests that organic farmers contribute, in terms of environmental public good, an amount that is equal to what would be provided through compliance with the three green measures [80]. In this study, greening constrains were also applied to organic farms to test their response. Despite the high crop and animal yields, the organic farm considered the adoption of greening measures economically sustainable.
When maximising the gross margin, the organic farm became more profitable, simplifying the cropping pattern to only two crops. In the Greening scenario, ecological lucerne was introduced in order to meet the two greening constrains related to crop diversification and EFA. This implied a further increase in gross margin.
Intensive farms need additional farm management changes to respect greening constrains that imply the introduction of a third crop and of the EFAs. Both greening options are less profitable than silage maize or silage maize + ryegrass, even with the additional greening premium. The second greening constraint—the maintenance of permanent grassland—was not limiting for the intensive farm.
Administrative penalties have been introduced starting from 2017, which are proportional to the share of non-compliance of the greening constrains, with a maximum share of 125% of the greening premium. Considering that the area needed as EFA is higher than that needed as the third crop (7% against 5%), and in this farm equals 2.59 ha, we can suppose that the intensive farm would choose an intermediate solution where EFA is adopted, but in a lower share than that required to fulfil greening constrains completely, or alternatively, other types of EFA would be chosen. However, as reported by Solazzo et al. [57], a share of the intensive farms in Italian regions, which are characterised by similar cropping systems to those studied here, do not comply with greening constrains, even under the penalties regime. When the “intensity” of the farm was already reduced due to self-sufficiency constrains, greening constrains were selected. This means that environmental measures, such as the greening policy, are easier to be applied by medium and extensive farms, but when voluntary, they will not be applied by intensive farms. At the same time, on the farms that do adopt environmental measures, the positive environmental impacts are relatively smaller than the positive economic impacts due to the extra subsidies. Similar results are reported by other studies related to the low application of agro-environmental measures of the Rural Development Programme in Europe and Italy [81,82]. Contrary to the actual situation, environmental-driven subsidies should be more convenient than intensification; otherwise, it will not be selected by the most intensive farmers.

5. Conclusions

In the present situation, the animal diet on dairy farms in the Piemonte region is based mostly on “on-farm” produced silage maize and purchased concentrates. All of the scenarios assessed in this paper demonstrated that this is not the most profitable solution. On-farm protein production with grain maize and hay from mixed grassland seems to offer a more profitable and environmentally friendly solution, also when feed self-sufficiency is not required.
The most profitable activity in the farm is milk production, and therefore, gross margin maximisation can be obtained by reducing or excluding cash crop production and investing all of the farm area in feed production.
Analysis of the different scenarios showed that targeting feed self-sufficiency induces more farm organisational change than the Greening policy scenario. Furthermore, it was shown that the cropping system is not always able to sustain the actual herd composition when feed self-sufficiency is required. Maximum gross margins are reached with 42%, 74%, and 62% for the intensive, extensive, and organic farm, respectively. On average, every % increase in feed self- sufficiency leads to a loss of 22 € ha−1, 5 € ha−1, and 7 € ha−1 on the same farms. When either the number of animals is too high, or the crop yield is too low, a high level of feed self-sufficiency is difficult to achieve.
Of the three regulations (taken into account as additional constrains) in the Greening scenario, crop diversification and the introduction of an ecological focus area were the most limiting factors that led to the rejection of the greening rules. The constraint on the compulsory area of grassland was less restrictive, as it was always accomplished, even when the other greening constrains were not selected. It seems that introduction of N-fixing crops to ecological focus areas was the most profitable greening strategy to adopt, and led to an increase in the share of protein produced on-farm. The more complex cropping systems of organic dairy farms made the adoption of greening constrains easier, since organic farms were already compliant with more restrictive regulations. For this reason, the exclusion of these farms from the greening rules seems to be a justifiable choice. However, it is important that the greening policy in the form here analysed does not lead to reduced environmental impacts. The intensive farm did not adopt the environmental measures, because the subsidy is less than the reduced gross margin. However, the new release of the European regulation makes the greening rules easier to be applied. On the other hand, the extensive and organic farms accept the subsidy, but do not need to change much. This implies that in order to improve environmental conditions, regulations are needed, rather than voluntary economic incentives.

Author Contributions

All authors have contributed to design of the research and preparing the manuscript; in particular: conceptualisation, analysing data and preparing the manuscript, S.G.; methodology and writing-review & editing, P.R.; software and model validation, A.K.; investigation, data curation and analysing data, D.S.; supervision and revisions of earlier versions of the manuscript, M.K.v.I.

Funding

These results are part of the work conducted in the framework of MITANET Project (Intensive Monitoring Network on Agronomic Techniques and Agricultural Soils), founded by Rural Development Programme of the European Union.

Acknowledgments

The authors want to thank Carlo Grignani and the reviewers for their helpful comments on the results of the paper.

Conflicts of Interest

The authors declare no conflict of interest.

References

  1. Steinfeld, H.; Mooney, H.; Schneider, F.; Neville, L. Livestock in a Changing Landscape: Drivers, Consequences and Responses; Island Press: Washington, DC, USA, 2010. [Google Scholar]
  2. Acosta-Alba, I.; Lopéz-Ridaura, S.; van der Werf, H.M.G.; Leterme, P.; Corson, M.S. Exploring sustainable farming scenarios at a regional scale: An application to dairy farms in Brittany. J. Clean. Prod. 2012, 28, 160–167. [Google Scholar] [CrossRef]
  3. Bieleman, J. Landbouw en milieu. Een eeuwig spanningsveld? In De Relatie Tussen Economie en Ecologie: Gisteren, Vandaag en Morgen; Castryck, G., Decaluwe, M., Eds.; Academia Press: Gent, Belgium, 1998. [Google Scholar]
  4. Thomassen, M.A.; de Boer, I.J.M. Evaluation of indicators to assess the environmental impact of dairy production systems. Agric. Ecosyst. Environ. 2005, 111, 185–199. [Google Scholar] [CrossRef]
  5. Cartwright, N.; Clark, L.; Bird, P. The impact of agriculture on water quality. Outlook Agric. 1991, 20, 145–152. [Google Scholar] [CrossRef]
  6. Moriondo, M.; Pacini, C.; Trombi, G.; Vazzana, C.; Bindi, M. Sustainability of dairy farming system in Tuscany in a changing climate. Eur. J. Agron. 2010, 32, 80–90. [Google Scholar] [CrossRef]
  7. Oenema, J.; van Keulen, H.; Schils, R.L.M.; Aarts, H.F.M. Participatory farm management adaptations to reduce environmental impact on commercial pilot dairy farms in the Netherlands. NJAS-Wageningen J. Life Sci. 2011, 58, 39–48. [Google Scholar] [CrossRef]
  8. Bertora, C.; Alluvione, F.; Zavattaro, L.; Grignani, C. Regulations Concerning Agriculture and Air Pollution. Ital. J. Agron. 2010, 5, 79–101. [Google Scholar] [CrossRef]
  9. ISPRA (Istituto Superiore per la Protezione e la Ricerca Ambientale). Italia Greenhouse Gas Inventory 1990–2009; National Inventory Report; ISPRA: Roma, Italy, 2011. [Google Scholar]
  10. Borreani, G.; Coppa, M.; Revello-Chion, A.; Comino, L.; Giaccone, D.; Ferlay, A.; Tabacco, E. Effect of different feeding strategies in intensive dairy farming systems on milk fatty acid profiles, and implications on feeding costs in Italy. J. Dairy Sci. 2013, 96, 6840–6855. [Google Scholar] [CrossRef] [PubMed]
  11. Lemaire, G.; Franzluebbersb, A.; de Faccio Carvalho, P.C.; Dedieu, B. Integrated crop–livestock systems: Strategies to achieve synergy between agricultural production and environmental quality. Agric. Ecosyst. Environ. 2013, 190, 4–8. [Google Scholar] [CrossRef]
  12. Van Calker, K.J.; Berentsen, P.B.M.; Giesen, G.W.J.; Huirne, R.B.M. Identifying and ranking attributes that determine sustainability in Dutch dairy farming. Agric. Hum. Values 2005, 22, 53–63. [Google Scholar] [CrossRef] [Green Version]
  13. Council of the European Union. Council Regulation (EC) No 834/2007 of 28 June 2007 on 761 Organic Production and Labelling of Organic Products and Repealing Regulation (EEC) No 762 2092/91; Council of the European Union: Brussels, Belgium, 2007. [Google Scholar]
  14. EC (European Commission). Commission Regulation (EC) No 889/2008 of 5 765 September 2008 Laying Down Detailed Rules for the Implementation of Council Regulation 766 (EC) No 834/2007 on Organic Production and Labelling of Organic Products with Regard to 767 Organic Production, Labelling and Control; European Commission: Brussels, Belgium, 2008. [Google Scholar]
  15. Vayssières, J.; Vigne, M.; Alary, V.; Lecomte, P. Integrated participatory modelling of actual farms to support policy making on sustainable intensification. Agric. Syst. 2001, 104, 146–161. [Google Scholar] [CrossRef]
  16. Havet, A.; Coquil, X.; Fiorelli, J.L.; Gibon, A.; Martel, G.; Roche, B.; Ryschawy, J.; Schaller, N.; Dedieu, B. Review of livestock farmer adaptations to increase foragesin crop rotations in western France. Agric. Ecosyst. Environ. 2014, 190, 120–127. [Google Scholar] [CrossRef]
  17. Olesen, J.E.; Bindi, M. Consequences of climate change for European agricultural productivity, land use and policy. Eur. J. Agron. 2002, 16, 239–262. [Google Scholar] [CrossRef]
  18. Sulc, R.M.; Tracy, B.F. Integrated crop–livestock systems in the US Corn Belt. Agron. J. 2007, 99, 335–345. [Google Scholar] [CrossRef]
  19. Kanellopoulos, A.; Berentsen, P.B.M.; van Ittersum, M.K.; Oude Lansink, A.G.J.M. A method to select alternative agricultural activities for future-oriented land use studies. Eur. J. Agron. 2012, 40, 75–85. [Google Scholar] [CrossRef]
  20. Mosnier, C.; Ridier, A.; Képhaliacos, C.; Carpy-Goulard, F. Economic and environmental impact of the CAP mid-term review on arable crop farming in South-western France. Ecol. Econ. 2009, 68, 1408–1416. [Google Scholar] [CrossRef]
  21. Louhichi, K.; Kanellopoulos, A.; Janssen, S.; Flichman, G.; Blanco, M.; Hengsdijk, H.; Heckelei, T.; Berentsen, P.; Lansink, A.O.; Van Ittersum, M. FSSIM, a bioeconomic farm model for simulating the response of EU farming systems to agricultural and environmental policies. Agric. Syst. 2010, 103, 585–597. [Google Scholar] [CrossRef] [Green Version]
  22. EC (European Commission). Communication from the Commission to the Council, the European Parliament, the European Economic and Social Committee and the Committee of the Regions. The CAP towards 2020: Meeting the Food Natural Resources and Territorial Challenges of the Future; European Commission: Brussels, Belgium, 2010. [Google Scholar]
  23. EC (European Commission). Proposal for a Regulation of the European Parliament and of the Council Establishing Rules for Direct Payments to Farmers under Support Schemes within the Framework of the Common Agricultural Policy; COM (2011) 625 Final/2; European Commission: Brussels, Belgium, 2011. [Google Scholar]
  24. Gomez y Palomaa, S.; Ciaiana, P.; Cristoiu, A.; Sammetha, F. The future of agriculture. Prospective scenarios and modelling approaches for policy analysis. Land Use Policy 2013, 31, 102–113. [Google Scholar] [CrossRef]
  25. EC (European Commission). Commission Staff Working Paper Impact Assessment. Common Agricultural Policy towards 2020. Annex 2: Greening the CAP; SEC (2011) 1153 Final/2; European Commission: Brussels, Belgium, 2011. [Google Scholar]
  26. Van Ittersum, M.K.; Ewert, F.; Heckelei, T.; Wery, J.; Alkan Olsson, J.; Andersen, E.; Bezlepkina, I.; Brouwer, F.; Donatelli, M.; Flichman, G.; et al. Integrated assessment of agricultural systems—A component based framework for the European Union (SEAMLESS). Agric. Syst. 2008, 96, 150–165. [Google Scholar] [CrossRef]
  27. Reidsma, P.; Janssen, S.; Jansen, J.; Van Ittersum, M.K. On the development and use of farm models for policy impact assessment in the European Union—A review. Agric. Syst. 2018, 159, 111–125. [Google Scholar] [CrossRef]
  28. Abaza, H.; Bisset, R.; Sadler, B. Environmental Impact Assessment and Strategic Environmental Assessment: towards an Integrated Approach; UNEP: Geneva, Switzerland, 2004; ISBN 92-807-2429-0. [Google Scholar]
  29. Bezlepkina, I.; Reidsma, P.; Sieber, S.; Helming, K. Integrated assessment of sustainability of agricultural systems and land use: Methods, tools and applications. Agric. Syst. 2011, 104, 105–109. [Google Scholar] [CrossRef]
  30. Vuorinen, F.; Pescadinha, B.C.; Hildén, M.; Jansen, J. Impact Assessments at International Organisations. An Overview of Strategies and Processes; LIAISE Linking Impact Assessment Instruments to Sustainability Expertise—European Commission’s Seventh Framework Programme) Deliverable D 7.2; Innovation Report 7–8; LIAISE: Wageningen, The Netherland, 2014. [Google Scholar]
  31. Rotmans, J.; van Asselt, M.B.A. Integrated assessment: Growing child on its way to maturity. An editorial essay. Clim. Chang. 1996, 34, 327–336. [Google Scholar] [CrossRef]
  32. Janssen, S.; Ewert, F.; Li, H.; Athanasiadis, I.N.; Wien, J.J.F.; Thérond, O.; Knapen, M.J.R.; Bezlepkina, I.; Alkan-Olsson, J.; Rizzoli, A.E.; et al. Defining assessment projects and scenarios for policy support: Use of ontology in Integrated Assessment and Modelling. Environ. Model. Softw. 2009, 24, 1491–1500. [Google Scholar] [CrossRef]
  33. Ewert, F.; van Ittersum, M.K.; Bezlepkina, I.; Therond, O.; Andersen, E.; Belhouchette, H.; Bockstaller, C.; Brouwer, F.; Heckelei, T.; Janssen, S.; et al. A methodology for integrated assessment in agriculture. Environ. Sci. Policy 2009, 12, 546–561. [Google Scholar] [CrossRef]
  34. EC (European Commission). Impact Assessment Guidelines. SEC (2005) 791; European Commission: Brussels, Belgium, 2005. [Google Scholar]
  35. Podhora, A.; Helming, K.; Adenauer, L.; Heckelei, T.; Kautto, P.; Reidsma, P.; Rennings, K.; Turnpenny, J.; Jansen, J. The policy-relevancy of impact assessment tools: Evaluating nine years of European research funding. Environ. Sci. Policy 2013, 31, 85–95. [Google Scholar] [CrossRef]
  36. Antle, J.M.; Jones, J.W.; Rosenzweig, C.E. Next generation agricultural system data, models and knowledge products: Introduction. Agric. Syst. 2017, 155, 186–190. [Google Scholar] [CrossRef] [PubMed]
  37. Van Ittersum, M.K.; Rabbinge, R.; Van Latesteijn, H.C. Exploratory land use studies and their role in strategic policy making. Agric. Syst. 1998, 58, 309–330. [Google Scholar] [CrossRef]
  38. Janssen, S.; Van Ittersum, M.K. Assessing farm innovations and responses to policies: A review of bio-economic farm models. Agric. Syst. 2007, 94, 622–636. [Google Scholar] [CrossRef]
  39. Kanellopoulos, A.; Reidsma, P.; Wolf, J.; van Ittersum, M.K. Assessing climate change and associated socio-economic scenarios for arable farming in the Netherlands: An application of benchmarking and bio-economic farm modelling. Eur. J. Agron. 2014, 52, 69–80. [Google Scholar] [CrossRef]
  40. Bassanino, M.; Grignani, C.; Sacco, D.; Allisiardi, E. Nitrogen balances at the crop and farm-gate scale in livestock farms in Italy. Agric. Ecosyst. Environ. 2007, 122, 282–294. [Google Scholar] [CrossRef]
  41. Regione Piemonte. Anagrafe Agricola Unica del Piemonte. Available online: http://www.ruparpiemonte.it/cms/servizi-rupar/servizio/12-anagrafe-agricola-unica-delpiemonte-.html (accessed on 11 December 2013).
  42. ISTAT (Istituto Nazionale di Statistica). Number of Farms and Heads. Available online: http://dati.istat.it/Index.aspx?lang=en (accessed on 12 December 2015).
  43. Gaudino, S.; Goia, I.; Grignani, C.; Monaco, S.; Sacco, D. Assessing agro-environmental performance of dairy farms in northwest Italy based on aggregated results from indicators. J. Environ. Manag. 2014, 140, 120–134. [Google Scholar] [CrossRef] [PubMed]
  44. European Parliament. Milk Price Crisis: MEPs Demand Further Action to Rescue Dairy Farmers. Planary Sessions. 26 May 2016. Available online: http://www.europarl.europa.eu/news/en/news-room/20160524IPR28827/milk-price-crisis-meps-demand-further-action-to-rescue-dairy-farmers (accessed on 24 September 2016).
  45. Louhichi, K.; Flichman, G.; Blanco, M. A Generic Template for FSSIM, SEAMLESS Report No. 3; Technical Report for SEAMLESS Integrated Project, EU 6th Framework Programme, Contract No. 010036-2; SEAMLESS: Wageningen, The Netherlands, 2009; 80p, ISBN 978-90-8585-125-7. [Google Scholar]
  46. Belhouchette, H.; Louhichi, K.; Therond, O.; Mouratiadou, I.; Wery, J.; Van Ittersum, M.; Flichman, G. Assessing the impact of the Nitrate Directive on farming systems using a bio-economic modelling chain. Agric. Syst. 2011, 104, 135–145. [Google Scholar] [CrossRef]
  47. Thorne, P.J.; Hengsdijk, H.; Janssen, S.; Louhichi, K.; Van Keulen, H.; Thornton, P.K. Modelling Livestock Component in FSSIM, SEAMLESS Report No. 35; Technical Report for SEAMLESS Integrated Project, EU 6th Framework Programme, Contract no. 010036-2; SEAMLESS: Wageningen, The Netherlands, 2009; 73p, ISBN 90-8585-123-8; 978-90-8585-123-3. [Google Scholar]
  48. Amery, F.; Schoumans, O.F. Agricultural Phosphorus Legislation in Europe; ILVO: Merelbeke, Belgium, 2014; 45p. [Google Scholar]
  49. Jarrige, R. Alimentation des Bovins, Ovins et Caprins; INRA: Paris, France, 1988; 476p. [Google Scholar]
  50. Jarrige, R. Ruminant Nutrition. Recommended Allowances and Feeding Tables; INRA: Paris, France, 1989; 389p. [Google Scholar]
  51. Fumagalli, M.; Acutis, M.; Mazzetto, F.; Vidotto, F.; Sali, G.; Bechini, L. An analysis of agricultural sustainability of cropping systems in arable and dairy farms in an intensively cultivated plain. Eur. J. Agron. 2011, 34, 71–82. [Google Scholar] [CrossRef]
  52. Council Regulation (Council of the European Union). Council Regulation (EC) No 1782/2003 of 29 September 2003 Establishing Common Rules for Direct Support Schemes under the Common Agricultural Policy and Establishing Certain Support Schemes for Farmers and Amending Regulations (EEC) No 2019/93, (EC) No 1452/2001, (EC) No 1453/2001, (EC) No 1454/2001, (EC) 1868/94, (EC) No 1251/1999, (EC) No 1254/1999, (EC) No 1673/2000, (EEC) No 2358/71 and (EC) No 2529/2001; Council Regulation: Brussels, Belgium, 2003. [Google Scholar]
  53. EC (European Commission). Delegated Regulation No 640/2014 of 11 March 2014. Supplementing Regulation (EU) No 1306/2013 of the European Parliament and of the Council with Regard to the Integrated Administration and Control System and Conditions for Refusal or Withdrawal of Payments and Administrative Penalties Applicable to Direct Payments, Rural Development Support and Cross Compliance; European Commission: Brussels, Belgium, 2014. [Google Scholar]
  54. EC (European Commission). Regulation (Eu) No 1307/2013 of the European Parliament and of the Council of 17 December 2013 Establishing Rules for Direct Payments to Farmers under Support Schemes within the Framework of the Common Agricultural Policy and Repealing Council Regulation (EC) No 637/2008 and Council Regulation (EC) No 73/2009; European Commission: Brussels, Belgium, 2013. [Google Scholar]
  55. EC (European Commission). Commission Delegated Regulation (EU) No 639/2014 of 11 March 2014 Supplementing Regulation (EU) No 1307/2013 of the European Parliament and of the Council Establishing Rules for Direct Payments to Farmers under Support Schemes within the Framework of the Common Agricultural Policy and Amending Annex X to That Regulation; European Commission: Brussels, Belgium, 2014. [Google Scholar]
  56. Louhichi, K.; Ciaian, P.; Espinosa, M.; Colen, L.; Perni, A.; Gomez y Paloma, S. An EU-Wide Individual Farm Model for Common Agricultural Policy Analysis (IFM-CAP); First Application to Crop Diversification Policy; Technical Report; Publications Office of the European Union: Luxembourg, 2015. [Google Scholar]
  57. Solazzo, R.; Pierangeli, F. How does greening affect farm behaviour? Trade-off between commitments and sanctions in the Northern Italy. Agric. Syst. 2016, 149, 88–98. [Google Scholar] [CrossRef]
  58. Cortignani, R.; Severini, S.; Dono, G. Complying with greening practices in the new CAP direct payments: An application on Italian specialized arable farms. Land Use Policy 2017, 61, 265–275. [Google Scholar] [CrossRef]
  59. EC (European Commission). Commission Staff Working Document Accompanying the Document Report from the Commission to the European Parliament and the Council on the Implementation of the Ecological Focus Area Obligation under the Direct Payment Scheme; COM (2017) 152 Final; European Commission: Brussels, Belgium, 2017. [Google Scholar]
  60. Grignani, C.; Zavattaro, L.; Sacco, D.; Monaco, S. Production, nitrogen and carbon balance of maize-based forage systems. Eur. J. Agron. 2007, 26, 442–453. [Google Scholar] [CrossRef]
  61. Sacco, D.; Zavattaro, L.; Grignani, C. Bilancio dell’azoto in prati monofiti di erba media e di erba mazzolina. Ital. J. Agron. 2003, 37, 69–74. [Google Scholar]
  62. Gaudino, S.; Goia, I.; Borreani, G.; Tabacco, E.; Sacco, D. Cropping system intensification grading using an agro-environmental indicator set in northern Italy. Ecol. Indic. 2014, 40, 76–89. [Google Scholar] [CrossRef] [Green Version]
  63. DeSimone, L.D.; Popoff, F. Eco-Efficiency. The Business Link to Sustainable Development; Massachusetts Institute of Technology Press: Cambridge, UK, 1997; p. 280. [Google Scholar]
  64. Cortignani, R.; Dono, G. Simulation of the impact of greening measures in an agricultural area of the southern Italy. Land Use Policy 2015, 48, 525–533. [Google Scholar] [CrossRef]
  65. Vosough Ahmadi, B.; Shrestha, S.; Thomson, S.G.; Barnes, A.P.; Stott, A.W. Impacts of greening measures and flat rate regional payments of the Common Agricultural Policy on Scottish beef and sheep farms. J. Agric. Sci. 2015, 153, 676–688. [Google Scholar] [CrossRef]
  66. Manos, B.; Bournaris, T.; Chatzinikolaou, P.; Berbel, J.; Nikolov, D. Effects of CAP policy on farm household behaviour and social sustainability. Land Use Policy 2015, 31, 166–181. [Google Scholar] [CrossRef]
  67. Galán-Martín, A.; Pozo, C.; Guillén-Gosálbez, G.; Antón Vallejo, A.; Jiménez Esteller, L. Multi-stage linear programming model for optimizing cropping plan decisions under the new Common Agricultural Policy. Land Use Policy 2015, 48, 515–524. [Google Scholar] [CrossRef]
  68. Mandryk, M.; Reidsma, P.; Kanellopoulos, A.; Groot, J.; van Ittersum, M.K. The role of farmers’ objectives in current farm practices and adaptation preferences: A case study in Flevoland, the Netherlands. Reg. Environ. Chang. 2014, 14, 1463–1478. [Google Scholar] [CrossRef]
  69. Kanellopoulos, A.; Berentsen, P.B.M.; Heckelei, T.; van Ittersum, M.K.; Oude Lansink, A.G.J.M. Assessing the forecasting performance of a generic bio-economic farm model calibrated with two different PMP variants. J. Agric. Econ. 2010, 61, 274–294. [Google Scholar] [CrossRef]
  70. Huggins, D.R.; Reganold, J.P. No-Till: The Quiet Revolution. Sci. Am. 2008, 299, 70–77. [Google Scholar] [CrossRef] [PubMed]
  71. Vasileiadis, V.P.; Sattin, M.; Otto, S.; Veres, A.; Pálinkás, Z.; Ban, R.; Pons, X.; Kudsk, P.; van der Weide, R.; Czembor, E.; et al. Crop protection in European maize-based cropping systems: Current practices and recommendations for innovative Integrated Pest Management. Agric. Syst. 2011, 104, 533–540. [Google Scholar] [CrossRef]
  72. Katsvario, T.W.; Cox, W.T. Economics of cropping systems featuring different rotations, tillage and management. Agron. J. 2000, 92, 485–493. [Google Scholar] [CrossRef]
  73. Batte, M.T. Factors influencing the profitability of precision farming systems. J. Soil Water Conserv. 2000, 55, 12–18. [Google Scholar]
  74. Khosla, R.; Inman, D.; Westfall, D.G.; Reich, R.M.; Frasier, M.; Mzuku, M.; Koch, B.; Hornung, A. A synthesis of multi-disciplinary research in precision agriculture: Site-specific management zones in the semi-arid western Great Plains of the USA. Precis. Agric. 2008, 9, 85–100. [Google Scholar] [CrossRef]
  75. Børsting, C.F.; Kristensen, T.; Misciattelli, L.; Hvelplund, T.; Weisbjerg, M.R. Reducing nitrogen surplus from dairy farms. Effects of feeding and management. Livest. Prod. Sci. 2003, 83, 165–178. [Google Scholar] [CrossRef]
  76. Fumagalli, M. Indicator-Based and Modelling Approaches for the Integrated Evaluation and Improvement of Agronomic, Economic and Environmental Performances of Farming and Cropping Systems in Northern Italy. Ph.D. Thesis, University of Milano, Milan, Italy, 2009. [Google Scholar]
  77. CRPA (Centro Ricerche Produzioni Animali). Gestione dell’Azoto e Altre Sperimentazioni per l’Agricoltura Sostenibile; Veneto Agricoltura–Azienda Regionale per i Settori Agricolo, Forestale ed Agroalimentare: Legnaro, Italy, 2011. [Google Scholar]
  78. Beukes, P.C.; Scarsbrook, M.R.; Gregorini, P.; Romera, A.J.; Clark, D.A.; Catto, W. The relationship between milk production and farm-gate nitrogen surplus for the Waikato region, New Zealand. J. Environ. Manag. 2012, 93, 44–51. [Google Scholar] [CrossRef] [PubMed]
  79. EC (European Commission). Milk Market Situation; European Commission: Bruxelles, Belgium, 2016; Available online: http://ec.europa.eu/agriculture/market-observatory/milk/pdf/market-situation-slides_en.pdf (accessed on 25 August 2016).
  80. Matthews, A. Greening the CAP: The way forward. New challenges for EU agricultural sector and rural areas which role for public policy? In Proceedings of the 126th EAAE Seminar, Capri, Italy, 27–29 June 2012. [Google Scholar]
  81. Uthes, S.; Piorr, A.; Zander, P.; Bieńkowski, J.; Ungaro, F.; Dalgaard, T.; Stolze, M.; Moschitz, H.; Schader, C.; Happe, K.; et al. Regional impacts of abolishing direct payments: An integrated analysis in four European regions. Agric. Syst. 2011, 104, 110–121. [Google Scholar] [CrossRef]
  82. Regione Piemonte. Sistema Piemonte. 2014. Available online: http://www.sistemapiemonte.it/psr2011/elenco.jsp (accessed on 12 June 2014).
Figure 1. Framework of the analyses.
Agriculture 08 00137 g001
Figure 2. Sensitivity analyses with different feed self-sufficiency levels applied for both crude protein and energy on the extensive farm, without (a) and with (b) greening constrains.
Agriculture 08 00137 g002
Figure 3. Sensitivity analyses with different feed self-sufficiency levels applied for both crude protein and energy on the intensive farm, without (a) and with (b) greening constrains.
Agriculture 08 00137 g003
Figure 4. Sensitivity analyses with different feed self-sufficiency levels applied for both crude protein and energy on the organic farm, without (a) and with (b) greening constrains.
Agriculture 08 00137 g004
Table 1. Main characteristics of the different farms.
FarmsExtensiveIntensiveOrganic
UAA (ha) a2777130
Number of dairy cows (n)28416460
Stocking rate (LSU ha−1)1.53.73.3
Cows production: t milk ha−1102218
Cows production: kg milk cow−1960095688816
Cropping patterns:
  t DM maize grain ha−110.513.912.6
  t DM maize silage ha−116.522.819.5
  % maize of UAA426760
  t DM winter cereals grain ha−14.76.1
  % winter cereals of UAA183
  t DM soy grain ha−1 4.3
  % soy of UAA 40
  t DM hay ha−17.37.6
  t DM hay silage ha−1
  % grassland of UAA4029
Secondary crops RyegrassPea and ryegrass
Specific characteristicsReduced tillage Organic cultivation
Feed self-sufficiency (% c.p.) b575068
Feed self-sufficiency (% energy)717572
DM, dry matter. a UAA: Utilisable Agricultural Area; b c.p.: Crude protein.
Table 2. Characteristics of extensive farm.
Farm ActivityUnit of MeasureCurrent SituationGross Margin Maximizing ScenarioSelf-Sufficiency ScenarioGreening ScenarioSelf-Sufficiency Plus Greening Scenario
Adoption of greening rules ---YesYes
Gross margin€ ha−122902647256728882787
Number of animals284284271284271
Cropping patterns:
  Grassland areaha52136137124123
  Grain maize areaha671148113282
  Silage maize areaha500025
  Ryegrass areaha400000
  Triticale areaha270000
  Winter wheat areaha80000
  Barley areaha140000
  Lucerne areaha190000
  Ecological lucerne areaha0001616
  Alternative crop silage maize + rye. areaha00025
  Alternative crop soybeen areaha02760046
Crops sold:
  Triticaleha (ton) *27 (138)0000
  Winter wheatha (ton) *8 (45)0000
  Barleyha (ton) *14 (84)0000
  Maizeha (ton) *38 (556)28 (396)046 (646)0
* Total crop production.
Table 3. Indicator results of the different farm types.
FarmsScenariosCropping System Production (€ ha−1)Milk Production (€ ha−1)Gross N Balance (kg N ha−1)Gross P Balance (kg P ha−1)GHG TOTAL (kg CO2eq ha−1)NH3 TOTAL (kg CO2eq ha−1)Eco efficiency (kg milk kg N surplus−1)Carbon Credit milk (kg GHG−1)
ExtensiveCurrent Situation1708393715126784691651.25
Gross Margin2063393715019808286661.25
FSS1867376012416721478761.30
Greening2174393716721813489591.21
Combi1890376413316738079711.28
IntensiveCurrent Situation157588402752516,176185801.37
Gross Margin170188402053015,8891731081.39
FSS216051379479575841371.34
Greening170188402053015,8891731081.39
Combi214551109969589951291.33
OrganicCurrent Situation43558287164915,2631841071.16
Gross Margin40908287291215,169177-1.16
FSS36748287201615,4031778671.14
Greening40848287122115,212177-1.16
Combi37598287231615,0981777761.17
Table 4. Characteristics of the intensive farm.
Farm ActivityUnit of MeasureCurrent SituationGross Margin Maximizing ScenarioSelf-Sufficiency ScenarioGreening ScenarioSelf-Sufficiency Plus Greening Scenario
Adoption of greening rules ---NoYes
Gross margin€ ha−149014910385849104077
Number of animals1641649516495
Cropping patterns:
  Grassland areaha2134273426
  Grain maize areaha8019019
  Silage maize areaha28183183
  Silage maize + rye. areaha12193193
  Winter wheat areaha20000
  Alternative crop soybeen areaha0019016
  Ecological lucerne areaha00004
Crops sold:
  winter wheatHa (ton) *2 (13)0000
* Total crop production.
Table 5. Characteristics of organic farm.
Farm ActivityUnit of MeasureCurrent SituationGross Margin Maximizing ScenarioSelf-Sufficiency ScenarioGreening ScenarioSelf-Sufficiency Plus Greening Scenario
Adoption of greening rules ---YesYes
Gross margin€ ha-151767157690073327170
Number of animals6060606060
Cropping patterns:
  Grain maize + Silage Rye. areaha7167189
  Silage maize +Ryegrassha1101009
  Grain pea + soybeanha714121010
  Soybean + ryegrassha50000
  Ecological soybeanha00001
  Ecological lucerneha00022
  Alternative crop lucerneha00200
Crops sold:
  Lucerneha (ton) *0002 (20)0
  Maizeha (ton) *09 (120)010 (143)0 (3)
  Peaha (ton) *7 (36)14 (73)12 (63)10 (53)10 (53)
* Total crop production.

