Local Agroforestry Practices for Food and Nutrition Security of Smallholder Farm Households in Southwestern Ethiopia


1
Centre for Development research (ZEF), University of Bonn, Genscheralle 3, 53113 Bonn, Germany
2
World Agroforestry Centre (ICRAF), Southeast Asia Regional Programme, P.O. Box 161, Bogor 16001, Indonesia
3
Plant Production Systems Group, Wageningen University, P.O. Box 430, 6700 AK Wageningen, The Netherlands
*
Author to whom correspondence should be addressed.
Sustainability 2018, 10(8), 2722; https://doi.org/10.3390/su10082722
Submission received: 20 June 2018
/
Revised: 26 July 2018
/
Accepted: 27 July 2018
/
Published: 2 August 2018
(This article belongs to the Special Issue Advances in Food and Non-Food Biomass Production, Processing and Use in Sub-Saharan Africa: Towards a Basis for a Regional Bioeconomy)
Abstract
:Food and nutrition security (FNS) rests on five pillars: availability, access, utilization, stability, and sovereignty. We assessed the potentials of local agroforestry practices (AFPs) for enabling FNS for smallholders in the Yayu Biosphere Reserve (southwestern Ethiopia). Data was collected from 300 households in a stratified random sampling scheme through semi-structured interviews and farm inventory. Utility, edibility, and marketability value were the key parameters used to determine the potential of plants in the AFPs. Descriptive statistics, ANOVA, and correlation analysis were employed to determine the form, variation, and association of local AFP attributes. Homegarden, multistorey-coffee-system, and multipurpose-trees-on-farmlands are the predominant AFPs in Yayu. Multipurpose-trees-on-farmlands are used mainly for food production, multistorey-coffee-system for income-generation, and homegarden for both. The 127 useful plant species identified represent 10 major plant utility groups, with seven (food, fodder, fuel, coffee-shade, timber, non-timber-forest-products, and medicinal uses) found in all three AFPs. In total, 80 edible species were identified across all AFPs, with 55 being primarily cultivated for household food supply. Generally, household income emanates from four major sources, multistorey-coffee-system (60%), homegarden (18%), multipurpose-trees-on-farmlands (13%), and off-farm activities (11%). Given this variation in form, purpose, and extracted benefits, existing AFPs in Yayu support the FNS of smallholders in multiple ways.
1. Introduction
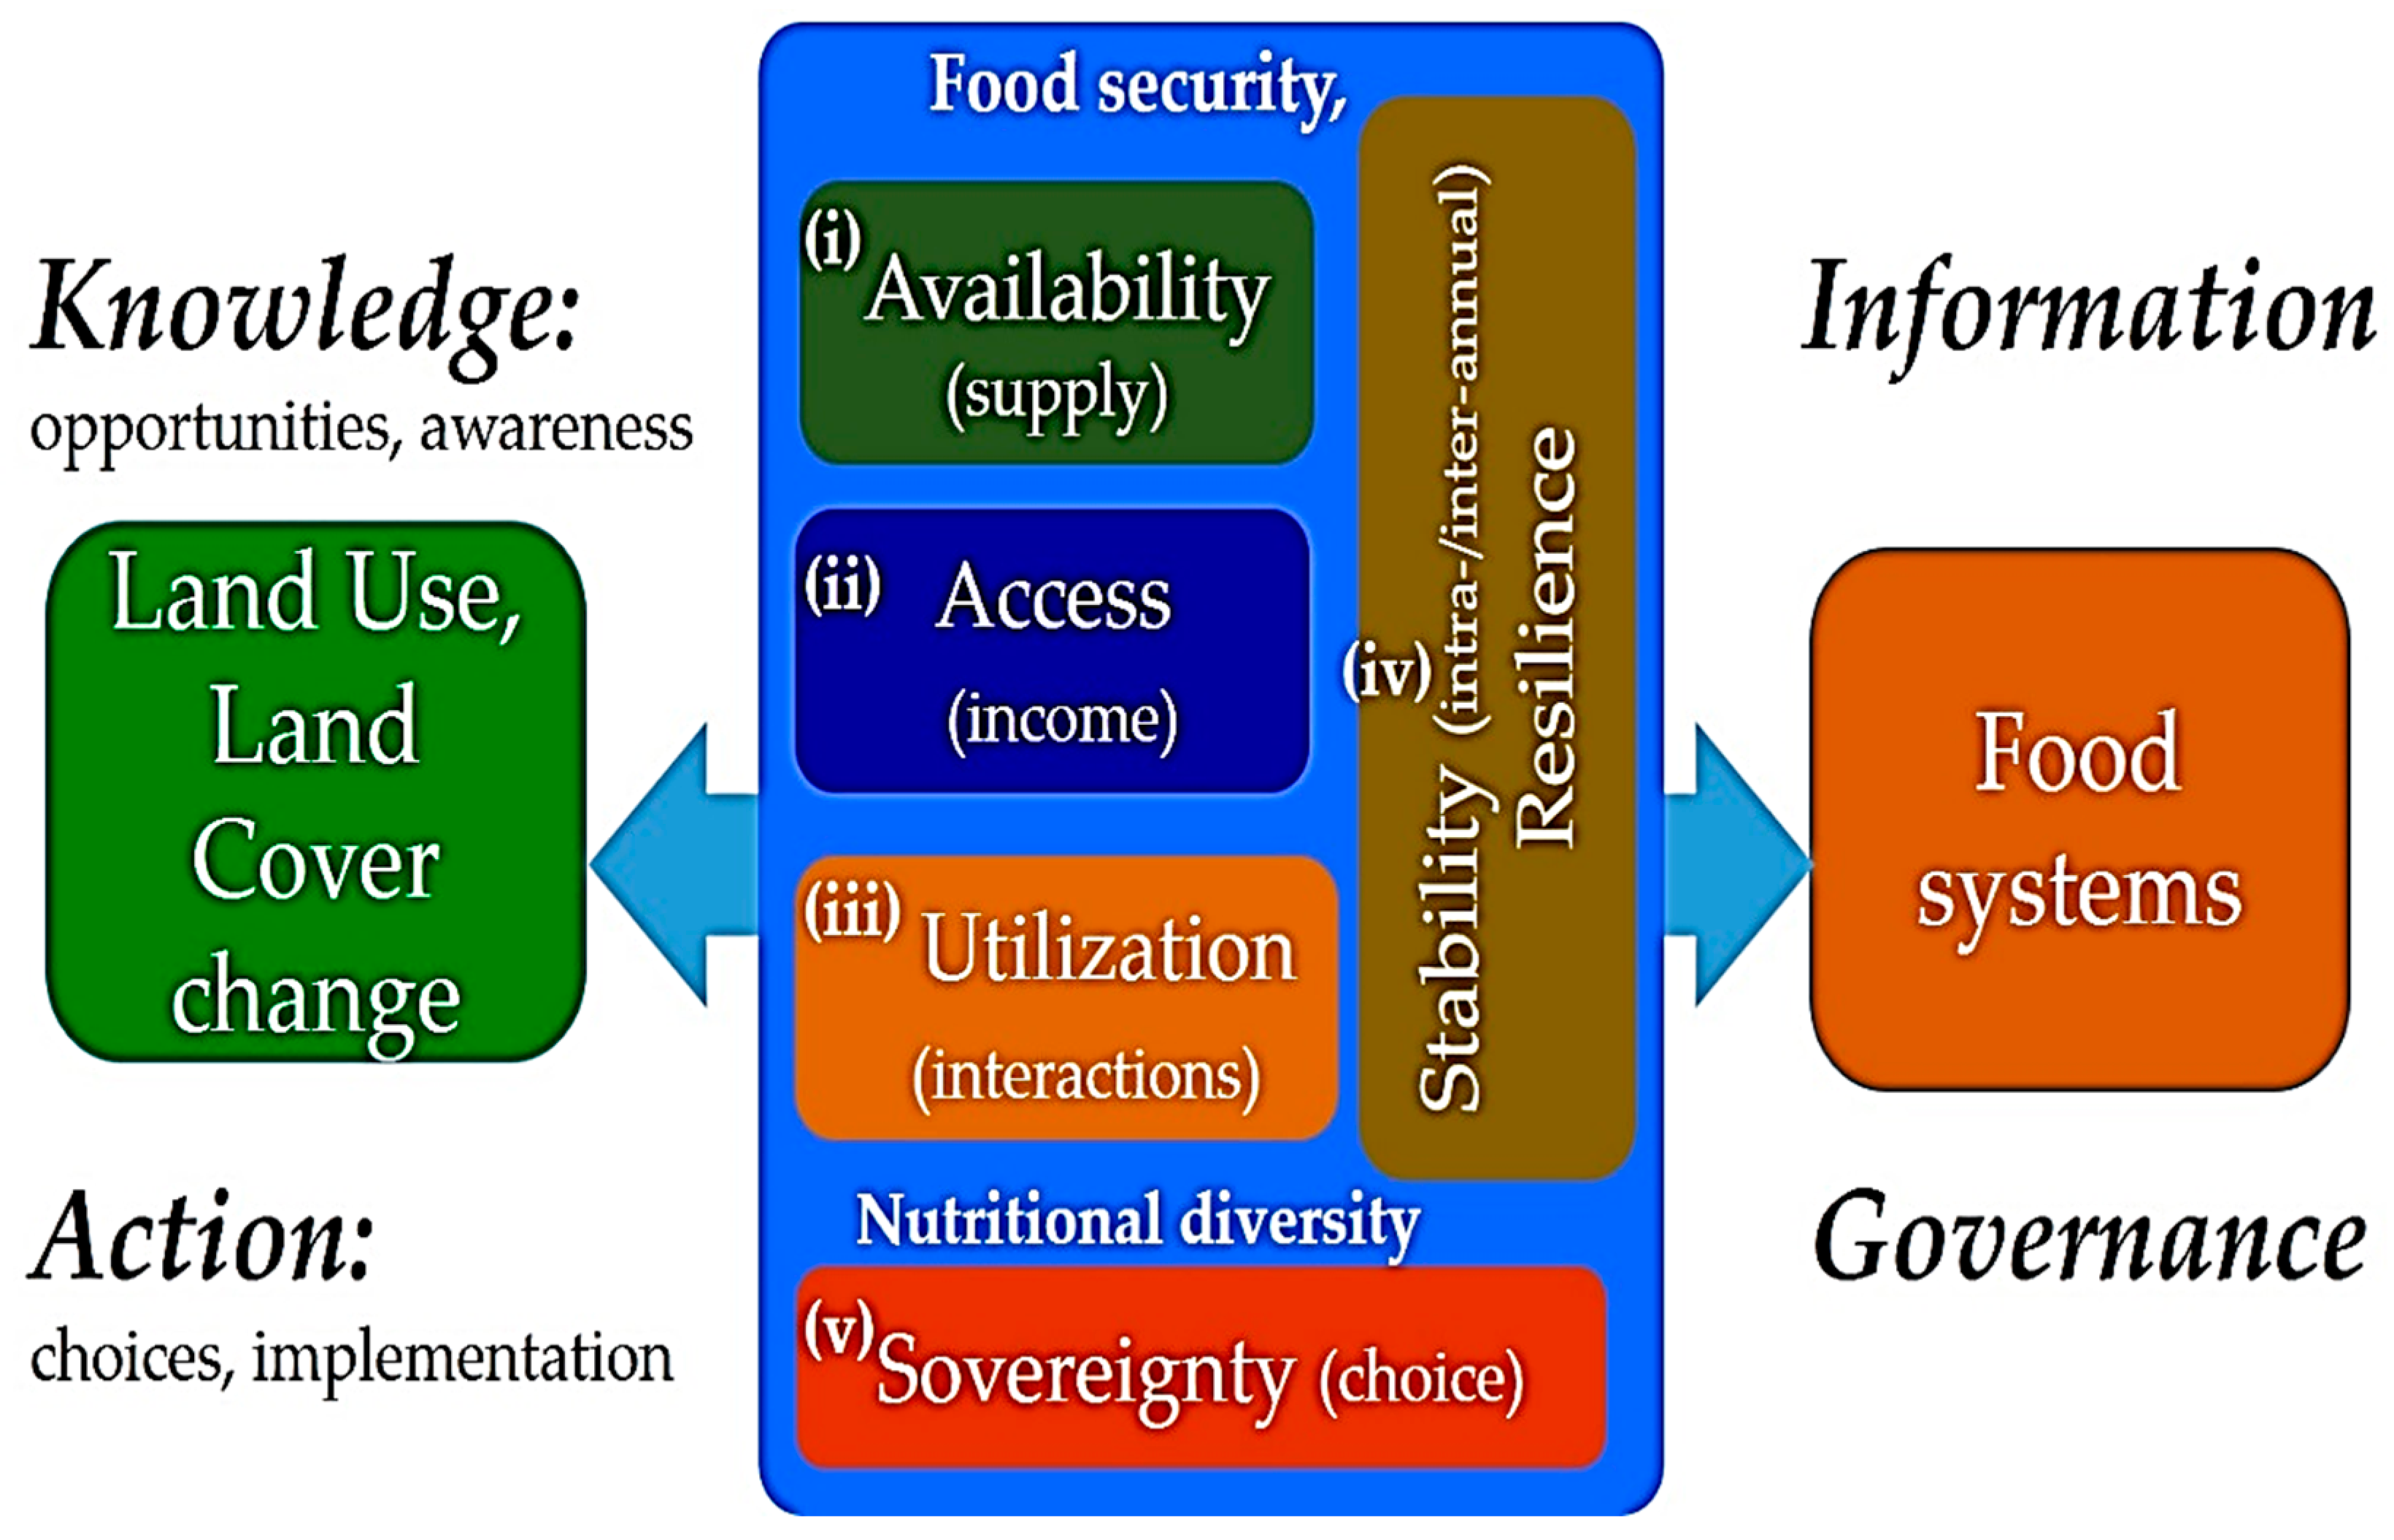
In the last four decades, agroforestry has been promoted as an option to address poverty and food insecurity, as well as to enhance the adaptability of small-scale farmers to social-ecological hazards [1,2,3,4,5]. For the former, its potential relies on its contribution to the strengthening of the five pillars of food and nutrition security (FNS): availability, access, utilization, stability, and sovereignty (Figure 1). Examples in local contexts are: (i) the presence of perennial staple food species in the system, like Ensete ventricosum, Musa spp., Moringa stenopetala, or Manihot esculenta, which ensure the availability of food [6,7,8,9]; (ii) the presence of species that secure cash to farming households, which directly enhance their access to market-based foods, as is the case of Coffea arabica or Theobroma cacao [10,11]; (iii) the utilization of dimension often enhanced via a diversity of species that offer scarce nutrients, e.g., fruit, leaves, or nuts, as well as the availability of fuel for cooking [11,12]; (iv) an increase in the resilience to and reduction in household social-ecological vulnerability, by the diversity of constituting species and their interactions [5,10,11]; and (v) providing options and choices in the means to grow and/or purchase foods items according to the household’s needs in all seasons [9,13,14].
Agroforestry practices (AFPs) vary in their composition, structure, and function, depending on the biophysical, ecological, social, economic, and cultural conditions under which they occur. Hence, taking into account this site-specificity is key before attempting any upscaling. Mbow et al. [5] emphasized that although agroforestry has a considerable potential to improve food security, ‘’…not all agroforestry options are viable everywhere”. Therefore, before recommending or promoting any agroforestry practice for a certain place or community, it is crucial to characterize and recognize its features, attributes, and performance in view of intra- and inter-year variability.
In Ethiopia, a wide variety of local/traditional AFPs exist, with potential to contribute to the FNS security of the practitioner communities. Different forms of homegardens are reported across the country [15,16,17,18]. Croplands with scattered trees of Faidherbia albida are the oldest form of indigenous agroforestry parklands, omnipresent in central and eastern Ethiopia [4,19,20]. The Enset-Coffee gardens, Coffea arabica planted intermingled with Enset ventricosum, practiced by the Gedeo people, are well-known to support millions of livelihoods in the most densely populated areas of the country [15,21]. The traditional coffee system dominated AFPs in southwestern Ethiopia are a further example of a well-established traditional AFP [22]. In Yayu, 60 to 80% of rural households rely on these AFPs as the main source of their livelihood [23]; the area was considered food secure in the last 15 years, despite an increasing human population [24,25,26,27,28,29]. In spite of the potential of the local AFPs to contribute toward FNS, empirical data on this topic are scarce.
For instance, during the last two decades, almost all studies conducted in Yayu mostly focused on the ecology, biodiversity, and conservation of traditional coffee systems [30,31,32,33,34,35,36], giving lesser attention to their potential for food and nutrient provision to local communities. Therefore, this study aimed to explore the potential of local AFPs of Yayu to contribute to the FNS of rural households. Specific objectives of the study were: (1) the identification of predominant AFPs and their purpose; (2) the plant species composition of each practice; (3) the ethnobotanical knowledge of uses of the various species encountered; and (4) their respective potential for food provision and cash acquisition, as steps towards (5) an appraisal of the five pillars of food security.
2. Materials and Methods
2.1. Study Area
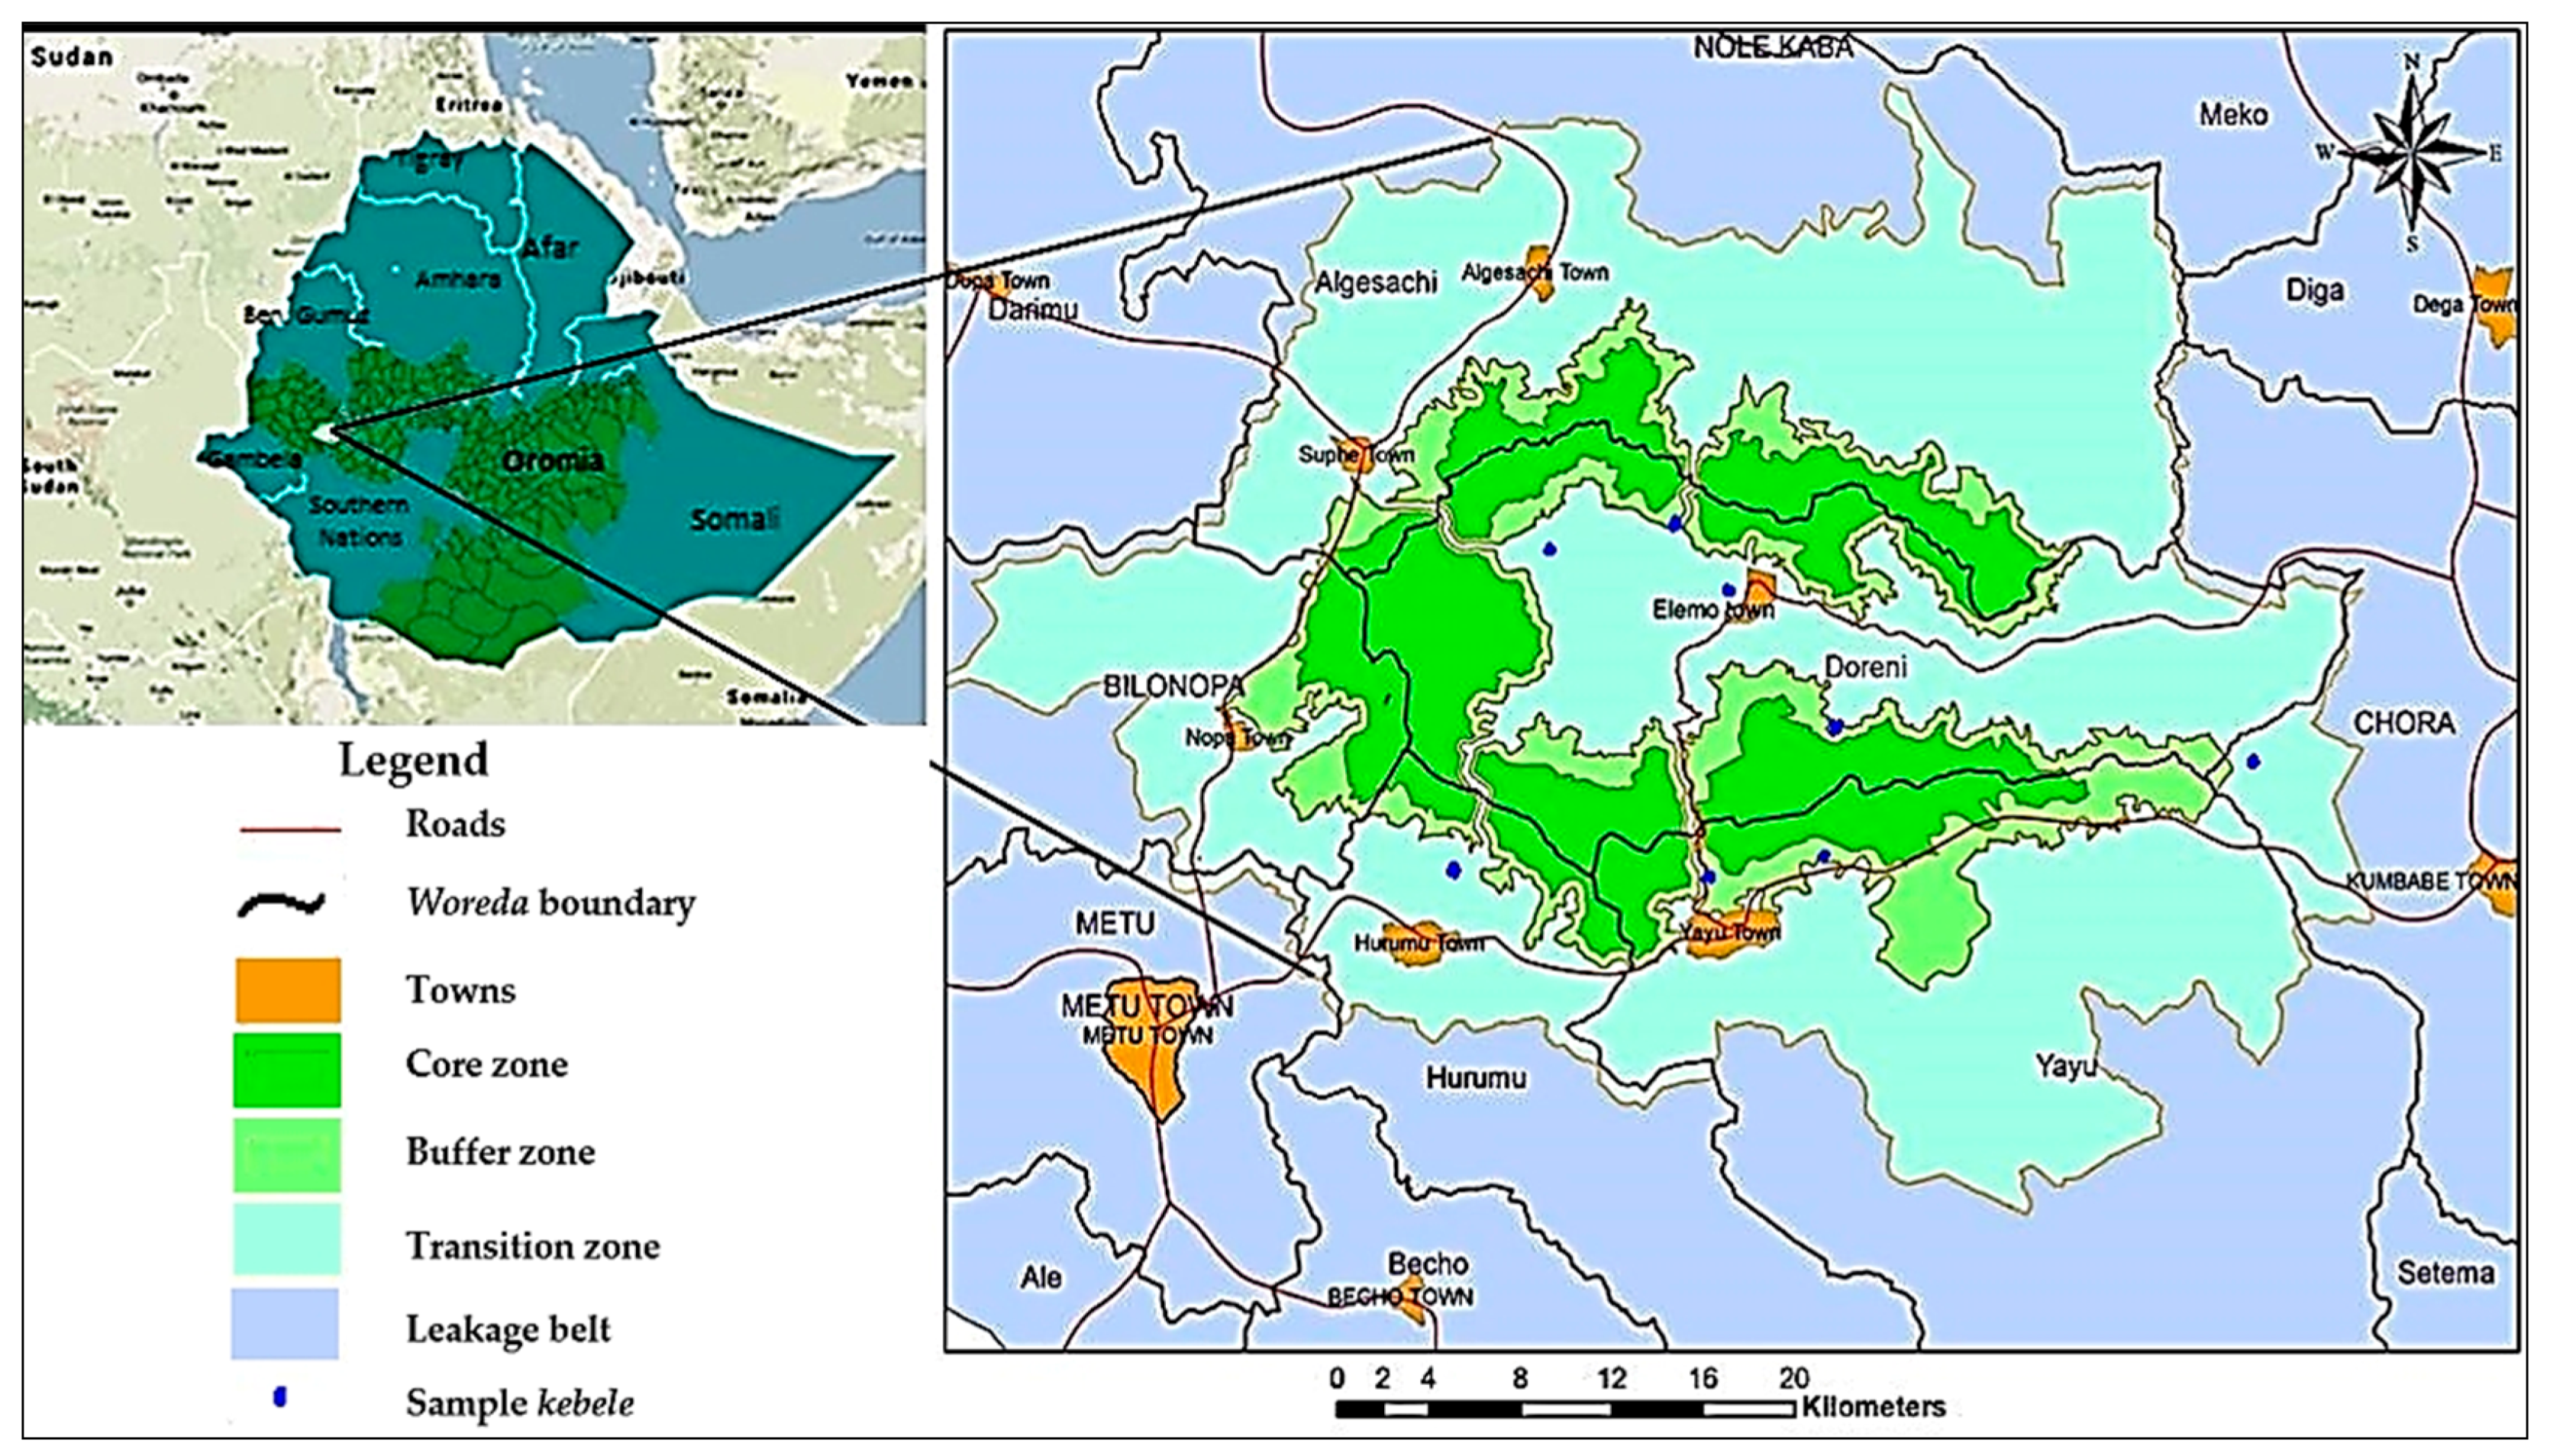
Yayu is located in the Illubabor zone of the Oromiya state, southwestern Ethiopia, between 8°10′–8°39′ N and 35°30′–36°4′ E (Figure 2). The area was registered by UNESCO in 2010 as a biosphere reserve for the in situ conservation of wild Coffea arabica. The Yayu Coffee Forest Biosphere Reserve comprises three concentric zones, i.e., the core area as well as buffer and transition zones, covering about 28,000, 22,000, and 118,000 ha, respectively [22] (Figure 1). The climate is hot and humid; the mean annual temperature is 20.5 °C, with average monthly values between 18.46 and 21.25 °C [35]. The area exhibits a unimodal rainfall pattern with a mean annual precipitation of 2100 mm [32]. Dominant soil groups include nitosols, acrisols, vertisols, and cambisols [37].
The vegetation cover of the area is relatively well conserved, comprising large areas of forests intermingled with wild coffee plants. The adequate integration of human utilization and environmental conservation makes the system one of the best performing traditional agroforestry systems of Ethiopia [38,39]. However, these coexist with other farming systems, such as annual crop fields, farmlands with scattered trees, homegardens, woodlots, grazing lands, and fallows [22,40]. Land uses exhibit a mosaic arrangement, within which forests, agricultural lands, wetlands, and grazing lands as the most prominent. The major forest uses are undisturbed natural forest, semi-forest coffee systems, fully managed forest for coffee production, and old secondary forests [22,40]. Farming is carried out in both around the farmer homestead and away from it [22,40].
2.2. Sampling Strategy
Prior to sample site selection, potential sources of errors were listed to control their effect on the results of the study. Mainly, the relative distances of farming households to the forest core zone and to market facilities were assumed to be the most influential factors [8]. Thus, the sample stratification was based on these factors. A kebele is the smallest administrative unit in Ethiopia, similar to a ward, a neighborhood, or a localized and delimited group of households. Kebele including a forest (core zone) in its jurisdiction were considered to be ‘near to forest’, while others were ’far from forest’. Similarly, those kebele located near a road were assumed to have better access to markets, and were considered as ’near market’, while others were ’far from market’. By using these levels of the two factors, four proximity categories were constructed to which all kebele of the reserve were assigned, and then two kebele from each category were selected randomly. Thus, a total of eight sample kebele were used for data collection (Table 1). Based on the local administration office data, about 4300 (N) households dwell in eight sample kebele, so 300 (n) households were assigned for the total sample [41]. Sampling intensity was proportionally allocated to each sample kebele based on population size. Finally, sample households were randomly selected for data collection.
2.3. Data Collection and Methodology
Data were collected from December 2014 to February 2015. First, key informant interviews substantiated by field observation were applied to understand the rationale of local farming and to identify the predominant AFPs. Based on this result, the household survey was designed, including a separate dataset for each of the identified AFPs. The household head was questioned on the socioeconomic and biophysical attributes of the household and agroforestry plots. The characterization of the AFP included the location, size, and spatial arrangements of the components, the identification of tree species and obtained products, and the uses and marketability of these. Field observation complemented data gathering.
Plant species identification was supported by a local taxonomist and specialized literature [42,43,44,45]. Plant uses and services were obtained from each system and grouped in accordance with the functional groups set by Mendez [46] and Abebe [8]. The food edibility potential was evaluated in two steps. Species were identified as edible and non-edible by comparing first-hand observation with secondary resources [39,44,45,47]. The ‘edible’ category was further subdivided into ’potentially-edible’ and ’active-food’ species. The former refers to edible plant species not primarily used as food, while the latter refers to species primarily cultivated for food. ‘Active-food’ was further re-classified into 10 plant food groups according to the United Nations Food and Agriculture Organization (FAO) [48]: ‘cereals’, ‘white root and tubers’, ‘vitamin-A-rich vegetables and tubers’, ‘dark green leafy vegetables’, ‘other vegetables’, ‘vitamin-A-rich fruits’, ‘other fruits’, ‘legumes, nuts, and seeds’, ‘sweets’, and ‘spices, condiments, stimulants, beverages, and additives’.
The potential of each agroforestry practice to generate income was assessed in two steps. First, we estimated the amount and major sources of annual income of the household, both on farm and off farm, establishing the relationship with the species and products of each AFP. Second, we listed all species and their actual marketability status, classified into three classes: (i) actively-marketed species, either cited as cash crops by at least one respondent and/or observed in local markets; (ii) passively-marketed species, mentioned by key informants or in the literature, but occasionally cited by farmers and rarely observed in markets; and (iii) non-marketed species, which included all species not belonging to the previous two classes [39,44,45,47].
The species richness of each category, i.e., food group, utility, edibility, and marketability, was calculated using Menhinick’s index Equation (1) [49].
where D = Menhinick’s index, S = number of species of a given use type/food group of a given plot, and N = total species per plot.
D = S/√N
Statistical analyses included the calculation of descriptive statistics for relevant biophysical and socioeconomic variables, and were conducted as a post-hoc analyses for subsequent testing, such as one-way ANOVA, Tukey’s test, and Pearson correlation analysis. The variability in different categories of each practice was tested separately across households. The tests were implemented using Minitab 17.0 software [50].
3. Results
3.1. Household Socioeconomic Profile
Males headed the majority of Yayu households (84%), where 44% of the households were within the medium wealth class, 17% in the rich class, and 39% in the poor class. Average family size was about five individuals, ranging between four and six. The average age of the respondents was 44.3 years. Ethnically, 75.6% of the households belonged to the Oromo ethnic group, followed by Amhara (19.3%) and Tigreway (4.6%). The majority of the respondents were native to the area, and 23.7% (mostly the two latter ethnic groups) were settlers. The illiteracy rate was 41.4%; 36.8% had attended primary school, and 18.3% had attended school to grade six or beyond. The average landholding size was 4.1 ± 3.2 ha per household (Figure 3).
3.2. Agroforestry Practices and Purposes
The collected information revealed that almost all of the farming activities of the area involve deliberately perennial woody species, in three distinct types of niches, i.e., homestead, coffee plot, and farmland, which locally identified as guwaro, laffa bunna, and laffa qonna, respectively. By adopting the classification scheme of Nair [51], the locally recognized farming practices were identified as homegarden (HG), multistorey-coffee-system (MCS), and multipurpose-trees-on-farmland (MTF). An HG is a complex multispecies production system practiced around the homestead, locally named guwaro. MCS is locally named laffa bunna, literally translated as coffee land. Although coffee cultivation is present in most land-use systems, MCS is distinguished by involving naturally grown and/or planted coffee with mostly native shade trees, resembling a multi-strata forest. The third type, MTF, locally known as laffa qonna, literally farmland, refers to lands designated for the production of annual crops that deliberately integrate perennial woody species to increase or optimize plot output.
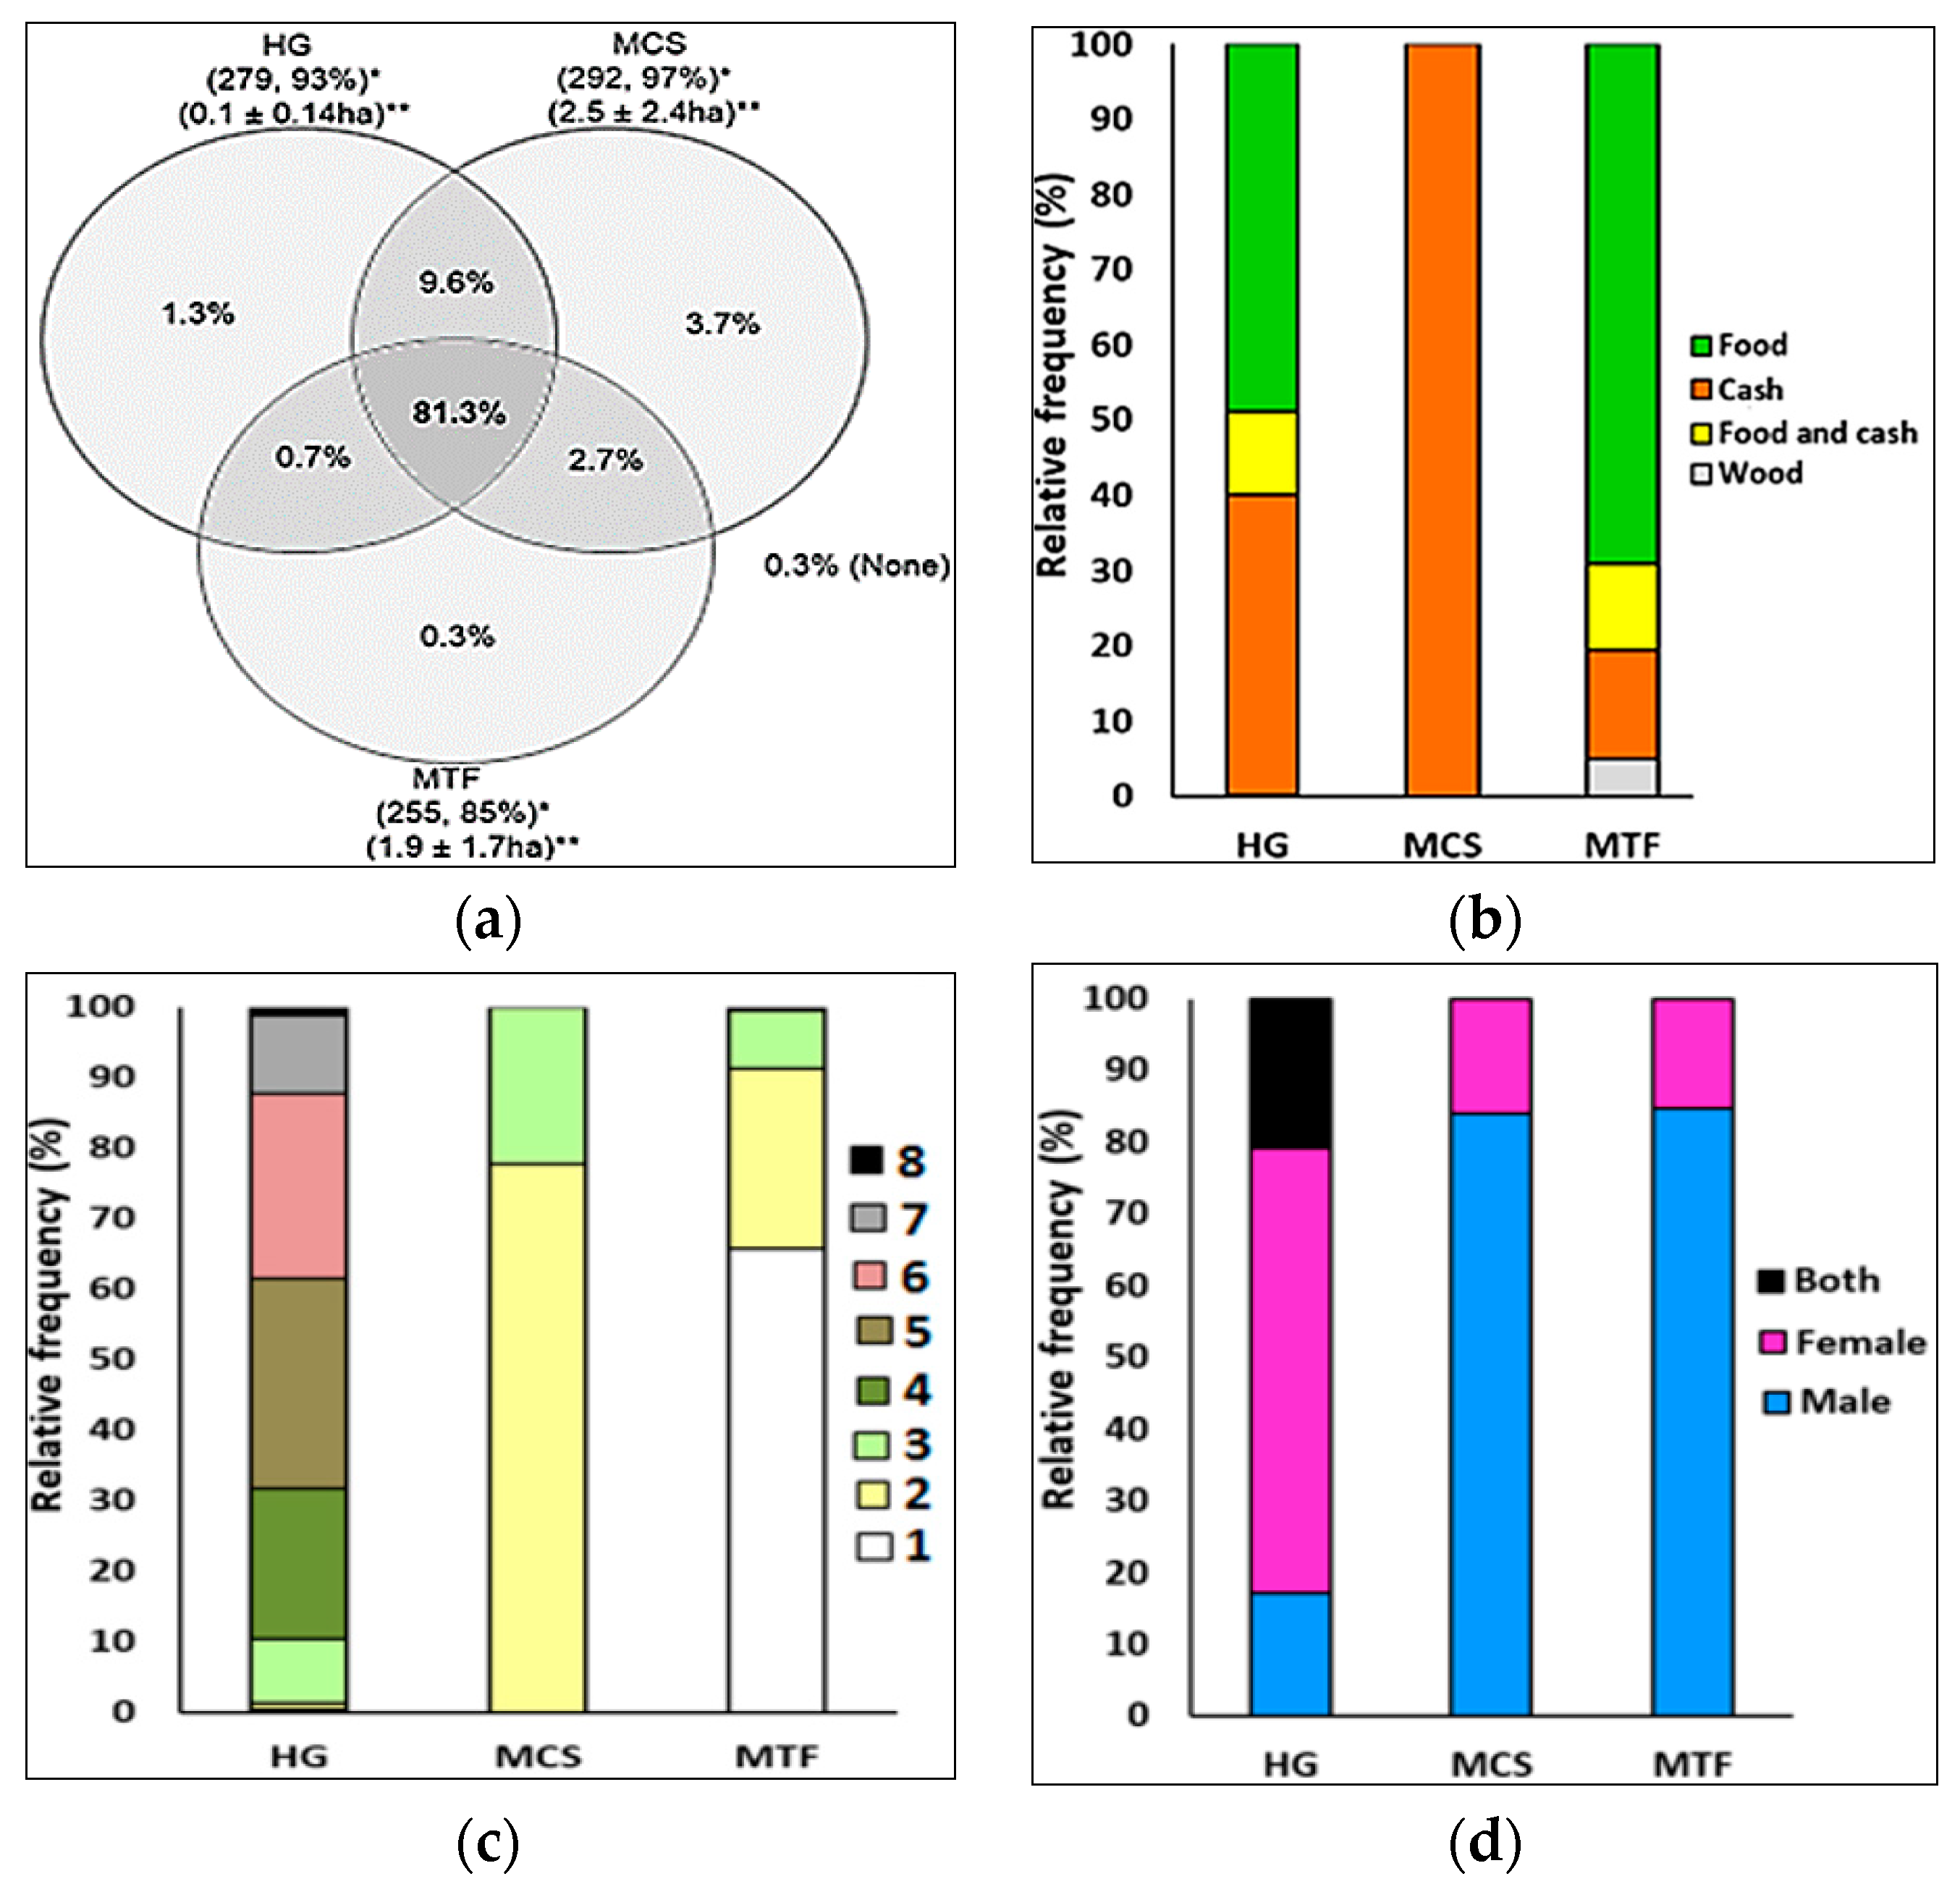
About 81% of the respondents involve in all three practices. MCS alone is practiced by 97% of the households, HG by 93%, and MTF by 85%. HG covers the smallest area (average 0.08 ha), and MCS the largest (2.6 ha) (Figure 4a). Concerning the primary purpose, MCS is used entirely for income generation, 66% of MTF is devoted to food production, in some cases also to wood and cash crop cultivation, and HG focuses on food (40%) and cash crop production (40%) (Figure 4b). Regarding the number of specific purposes/benefits per practice (annual crop production, fruit production, cash crop production, vegetable production, etc.), the highest was in HG (max. eight) per household, and in more than 90% of the households at least three specific outputs were generated. In contrast, the lowest value was found in MCS (max. three) per household (Figure 4c). The main users or decision makers of MCS and MTF are dominantly males (>83%). Females dominated in HG (62%) (Figure 4d).
3.3. Floristic Composition
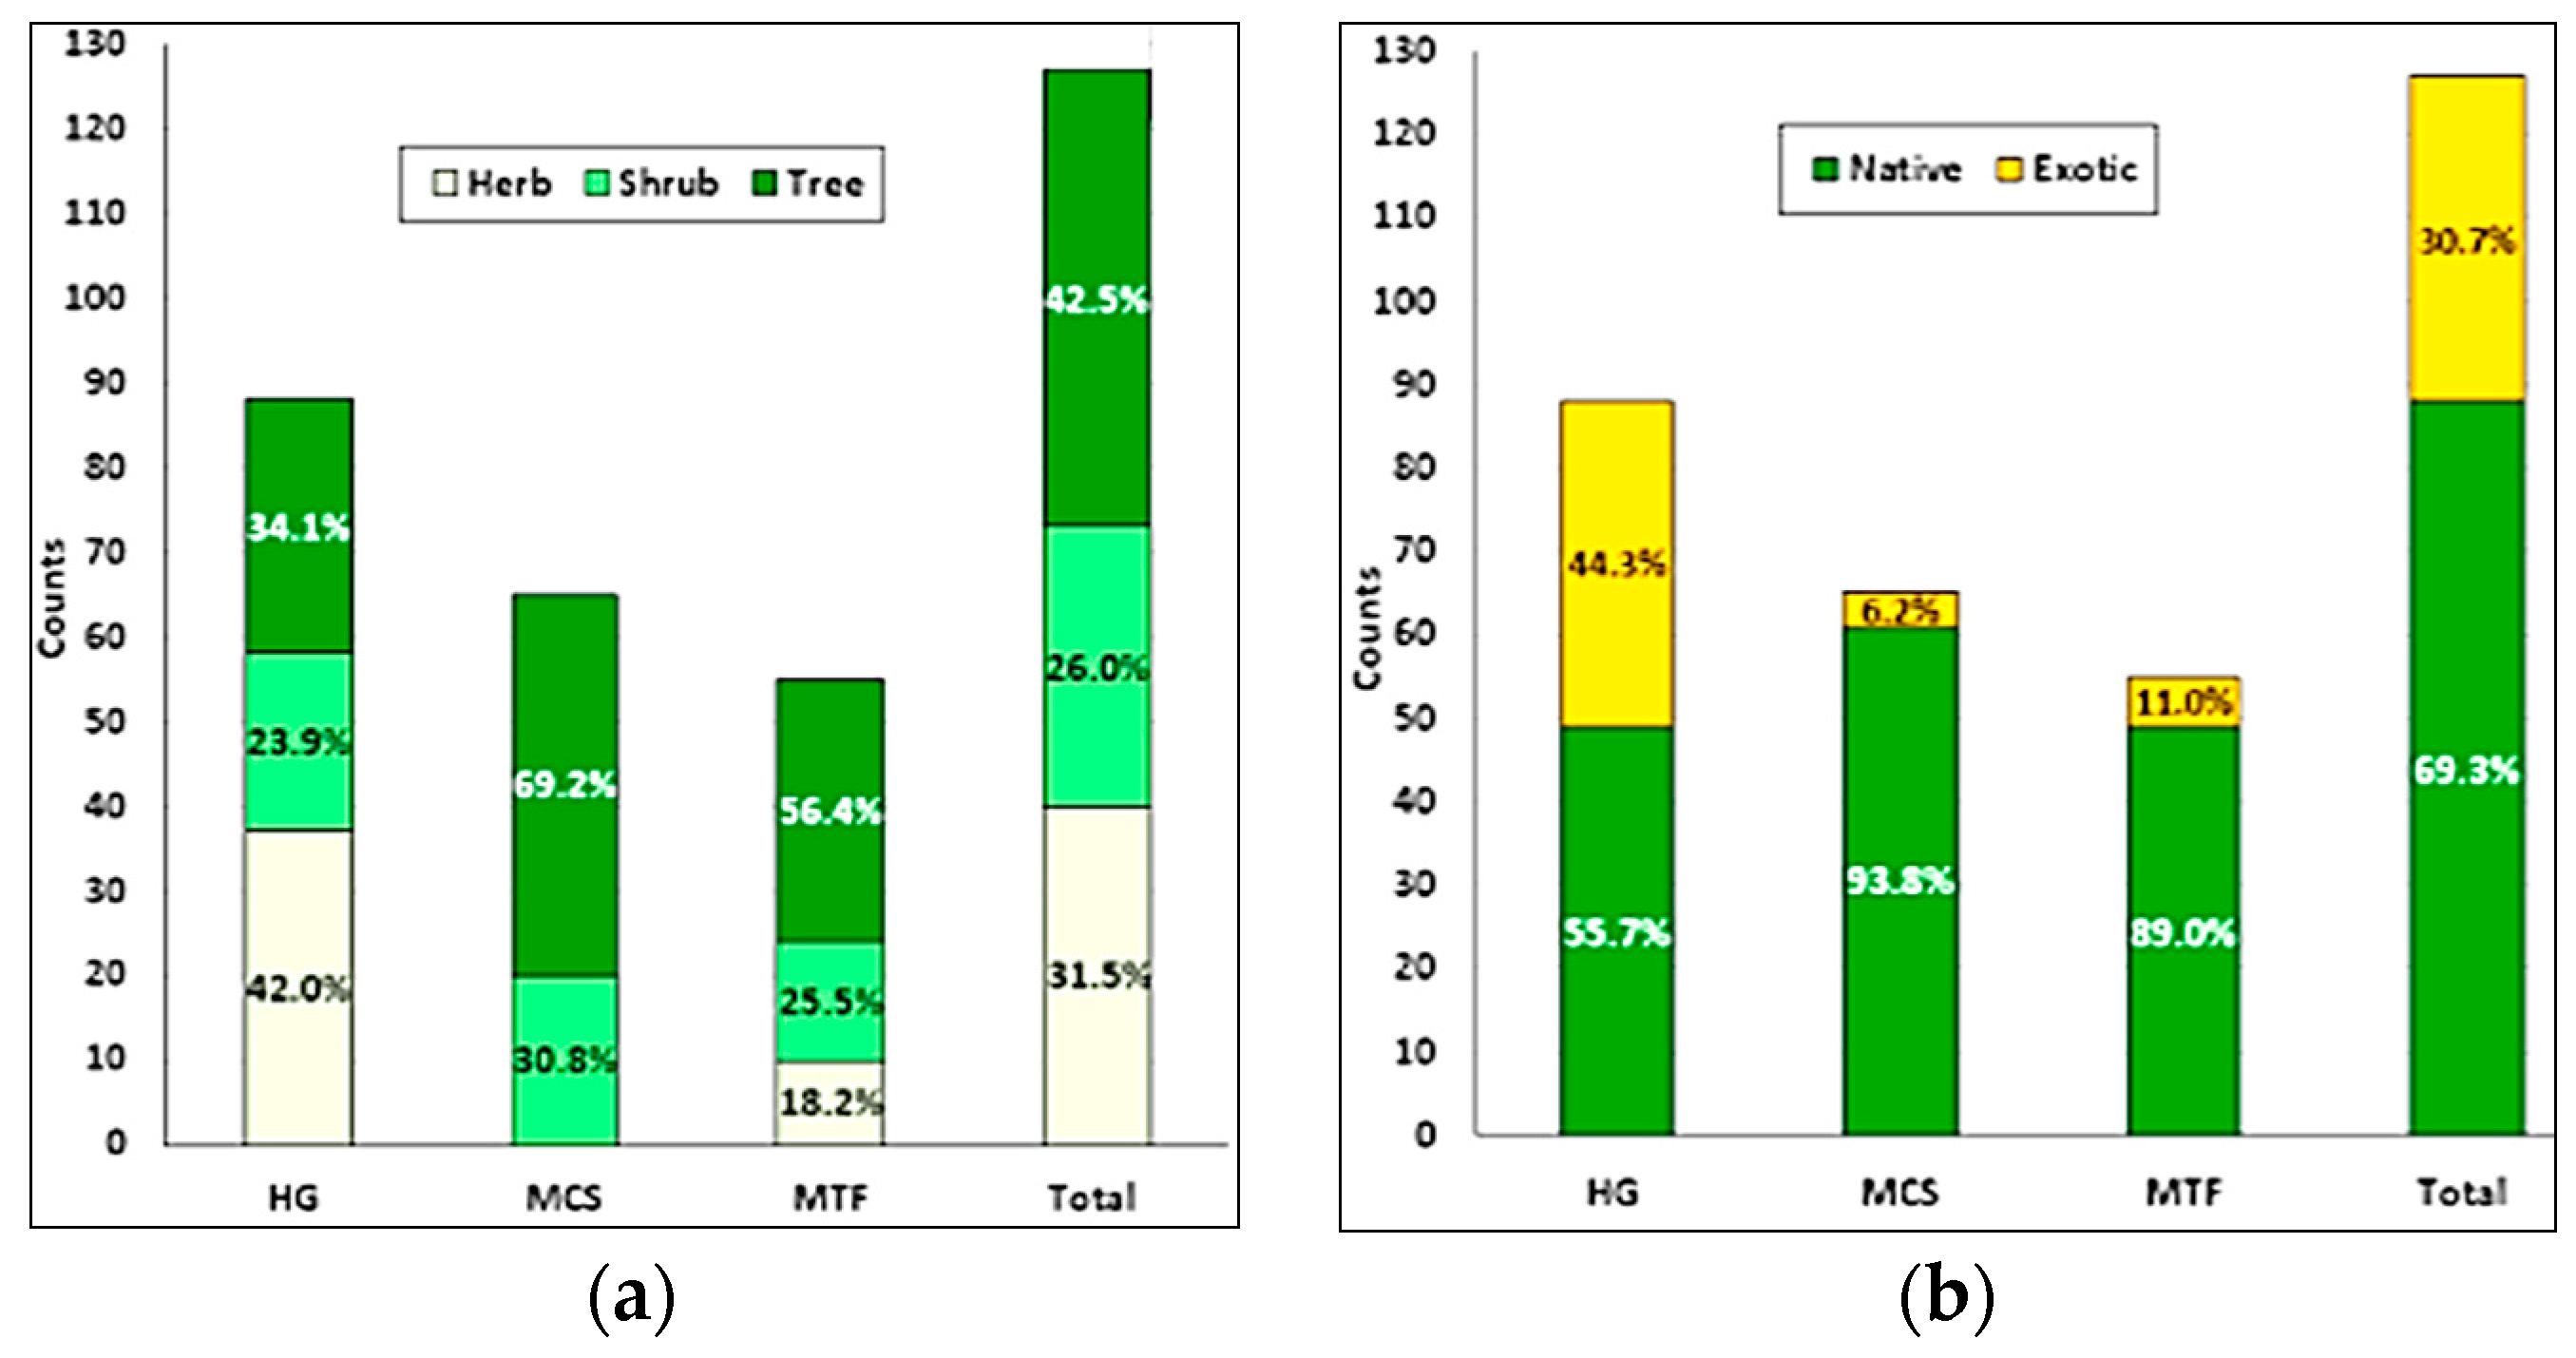
One hundred and twenty-seven plant species from 47 families were identified in all three AFPs. The highest number was found in HG (88), followed by MCS (65) and MTF (55) (Figure 5a). About 68.5% were perennial (tree and shrubs); herbs were absent in MCS; 69% of the species were native to the Yayu area (Figure 5b); and most herbs and exotic species existed in HG. A full list of species identification and characterization is available on demand.
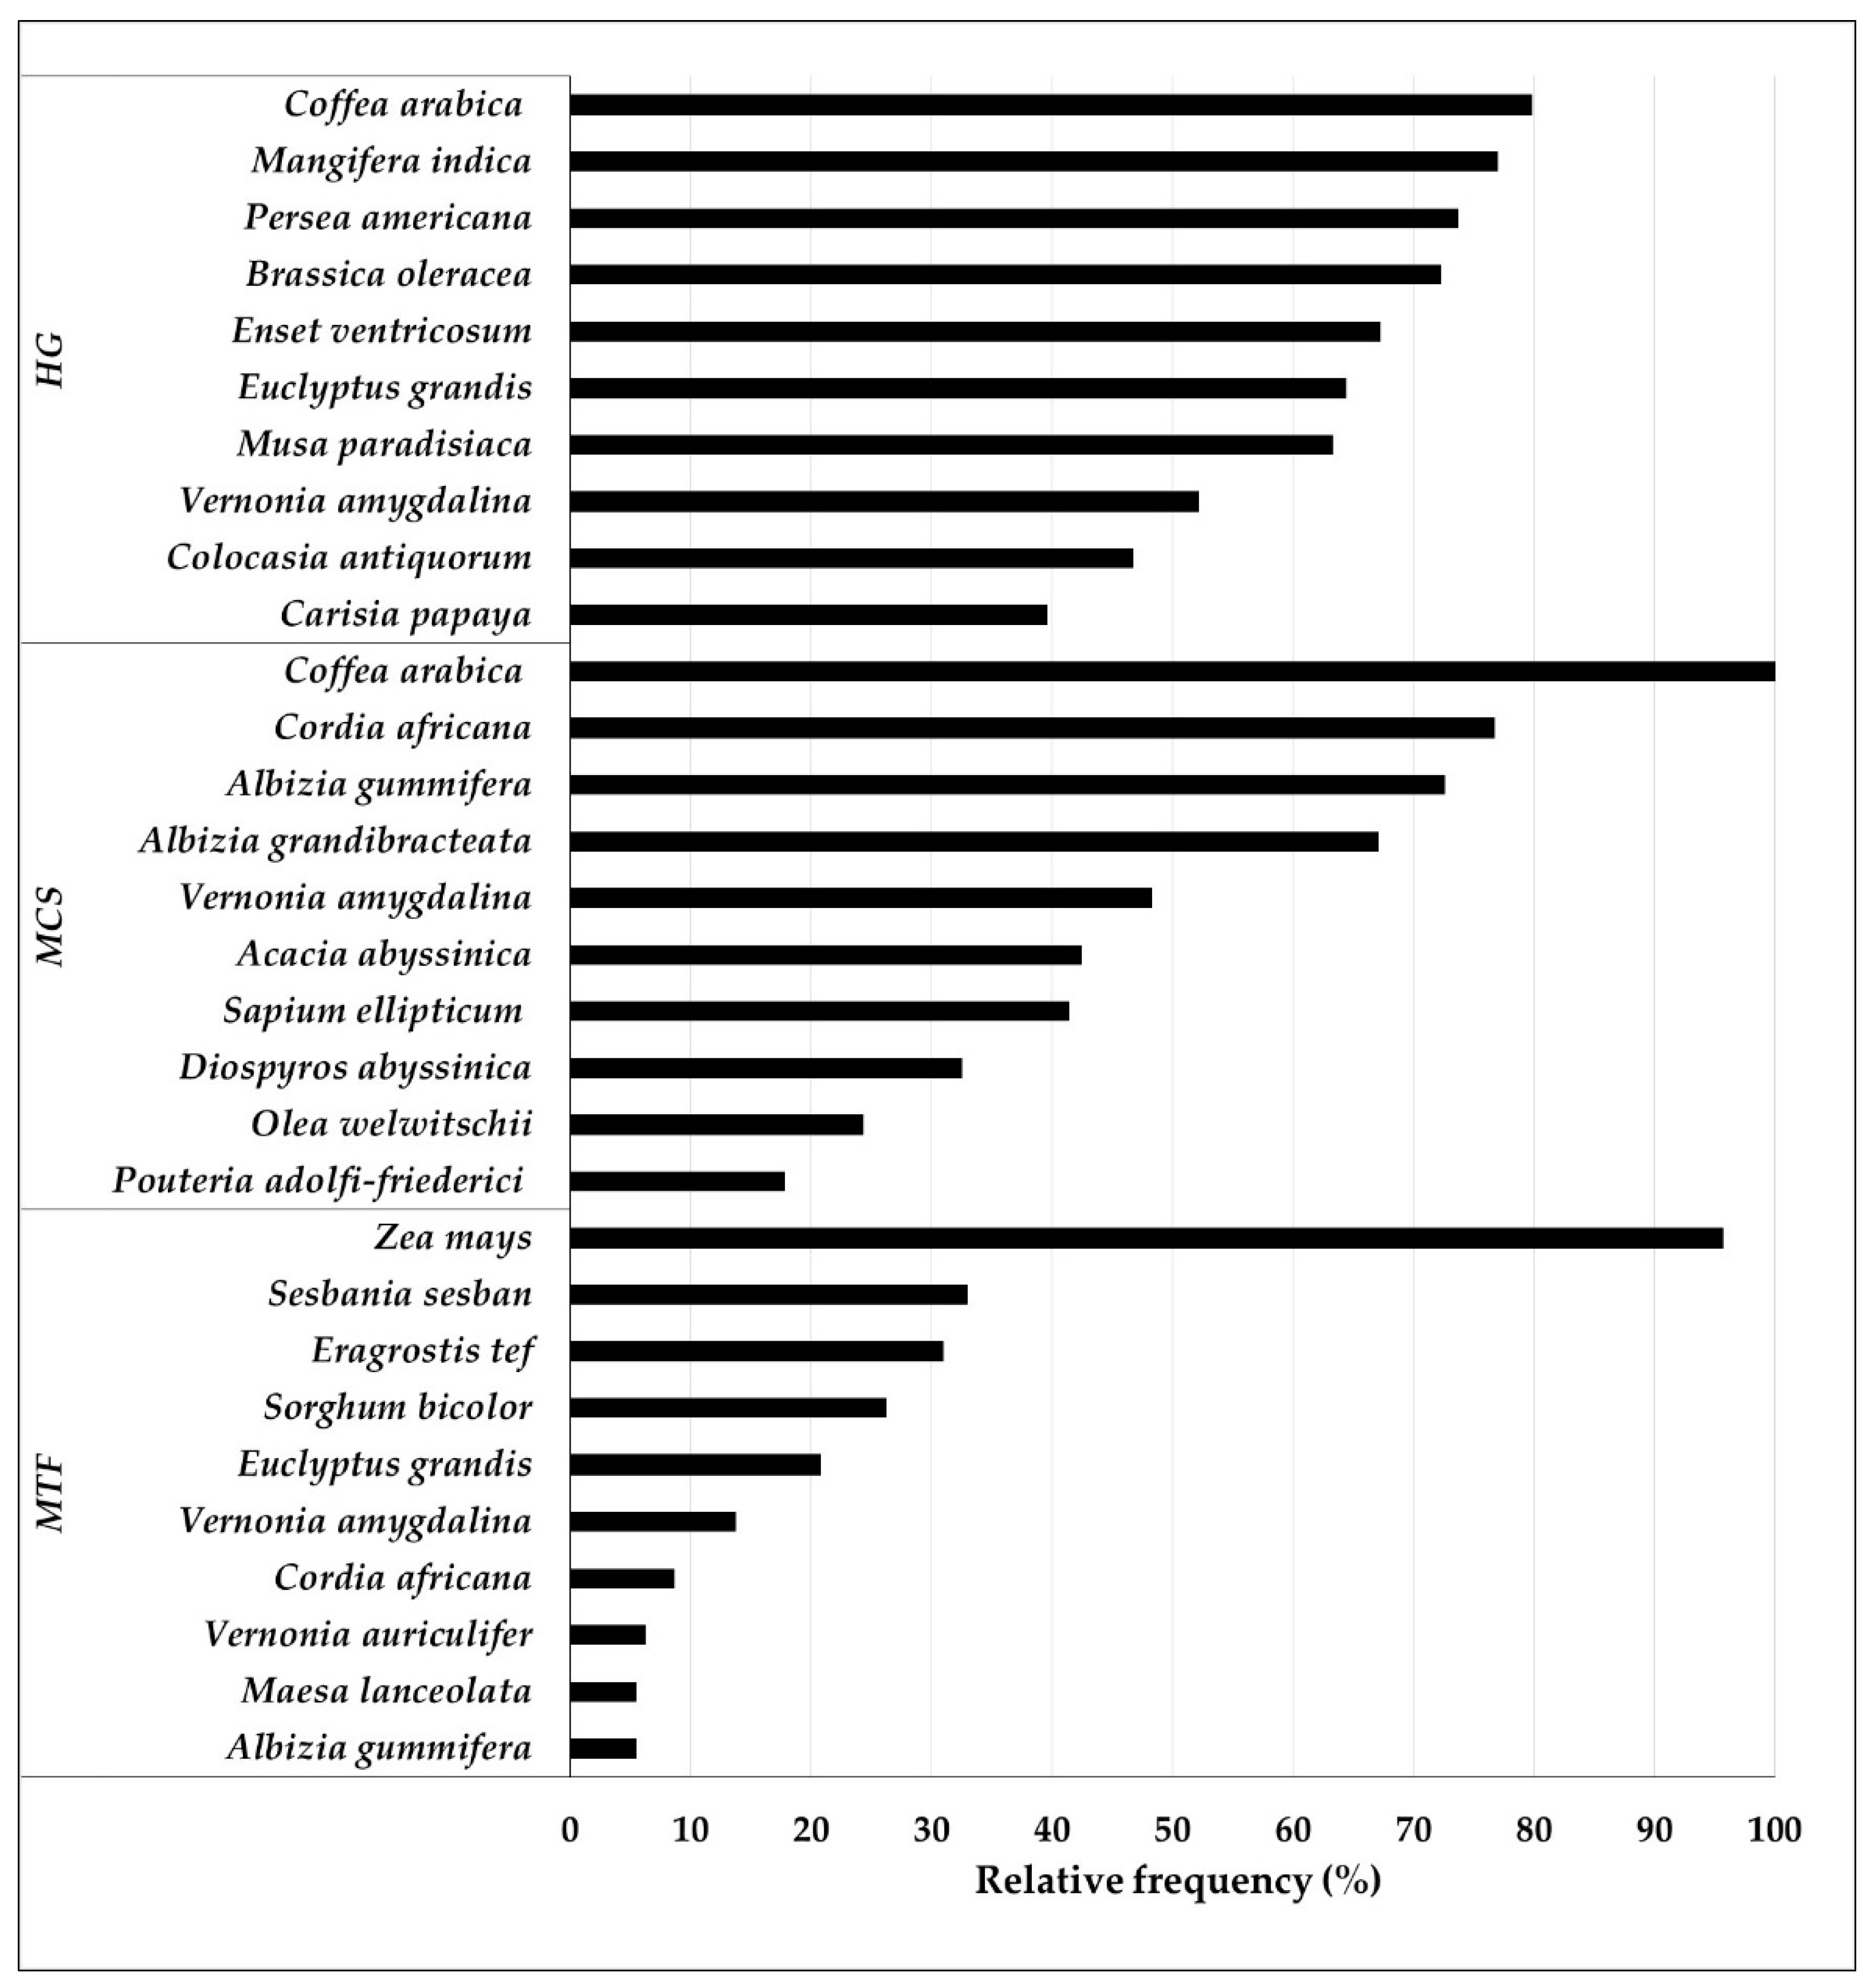
Concerning the frequency of occurrence of species, Coffea arabica, Mangifera indica, Persea americana, and Brassica oleracea were dominant in more than 70% HG. Besides coffee, present in all MCS, shade tree species like Cordia africana and Albizia gummifera were present in more than 70% of MCS. In contrast, MTF was dominated by Zea mays (more than 95%), followed by Sesbania sesban (33%), Eragrostis tef (31%), Sorghum bicolor (26.3%), and Eucalyptus grandis (20.8%). The multipurpose tree species Vernonia amygdalina was the only species found in all three practices (Figure 6).
3.4. Plant Uses and Services
The existing 10 different types of plant uses and services [46] were observed in the three AFPs, i.e., food; spices, condiments, and other food and beverage additives; stimulants; fodder; fuel; timber; non-timber tree products; shade trees for coffee; other services, e.g., live fences, windbreaks, demarcation, recreation, and ornamental; and medicine.
Almost all uses were observed in all three practices. Only ‘food’ in MCS, ‘shade trees for coffee’ in MTF, and ‘spices, condiments, and other foods and beverage additives’ were missing in both practices. Regarding the species count for each use, ‘stimulants’ (2) and ‘fuel’ (52) were the two extremes. Overall, ‘food’ scored significantly high (p < 0.01), with 7.8 species per plot in HG, whereas ‘fuel’ was the highest in MCS (7.1). Species richness per plot and count showed similar trends in all uses and service categories (Table 2).
3.4.1. Food Production Potential
Out of the 127 species identified in all three practices, 80 were edible, while 55 were managed as ‘active-food’. Except three of the ‘active-food’ species, the rest were observed in HG, with an average of nine species. The highest number of ‘potentially-edible’ species was found in MCS (21), and the highest number of ‘active-food’ species was found in HG (52) (Table 2). The ratio between ‘potential’ and ‘active-food’ reveals the untapped value of edible species. In MCS, both in total and at the plot level, the ratio reached 21:1 and 1.7:1, respectively (Table 3).
The ‘active-food’ category was subdivided into 10 different food groups. As expected, HG exhibited the largest variety of species of all food groups. The food group ‘other fruits’ scored the highest in all AFPs, whereas ‘spices, condiments, and beverages’ and ‘cereals’ showed higher species richness in MCS and MTF. The average species number and richness per household showed a significant variation in HG and MTF (p < 0.01) (Table 4).
3.4.2. Income Generation Potential
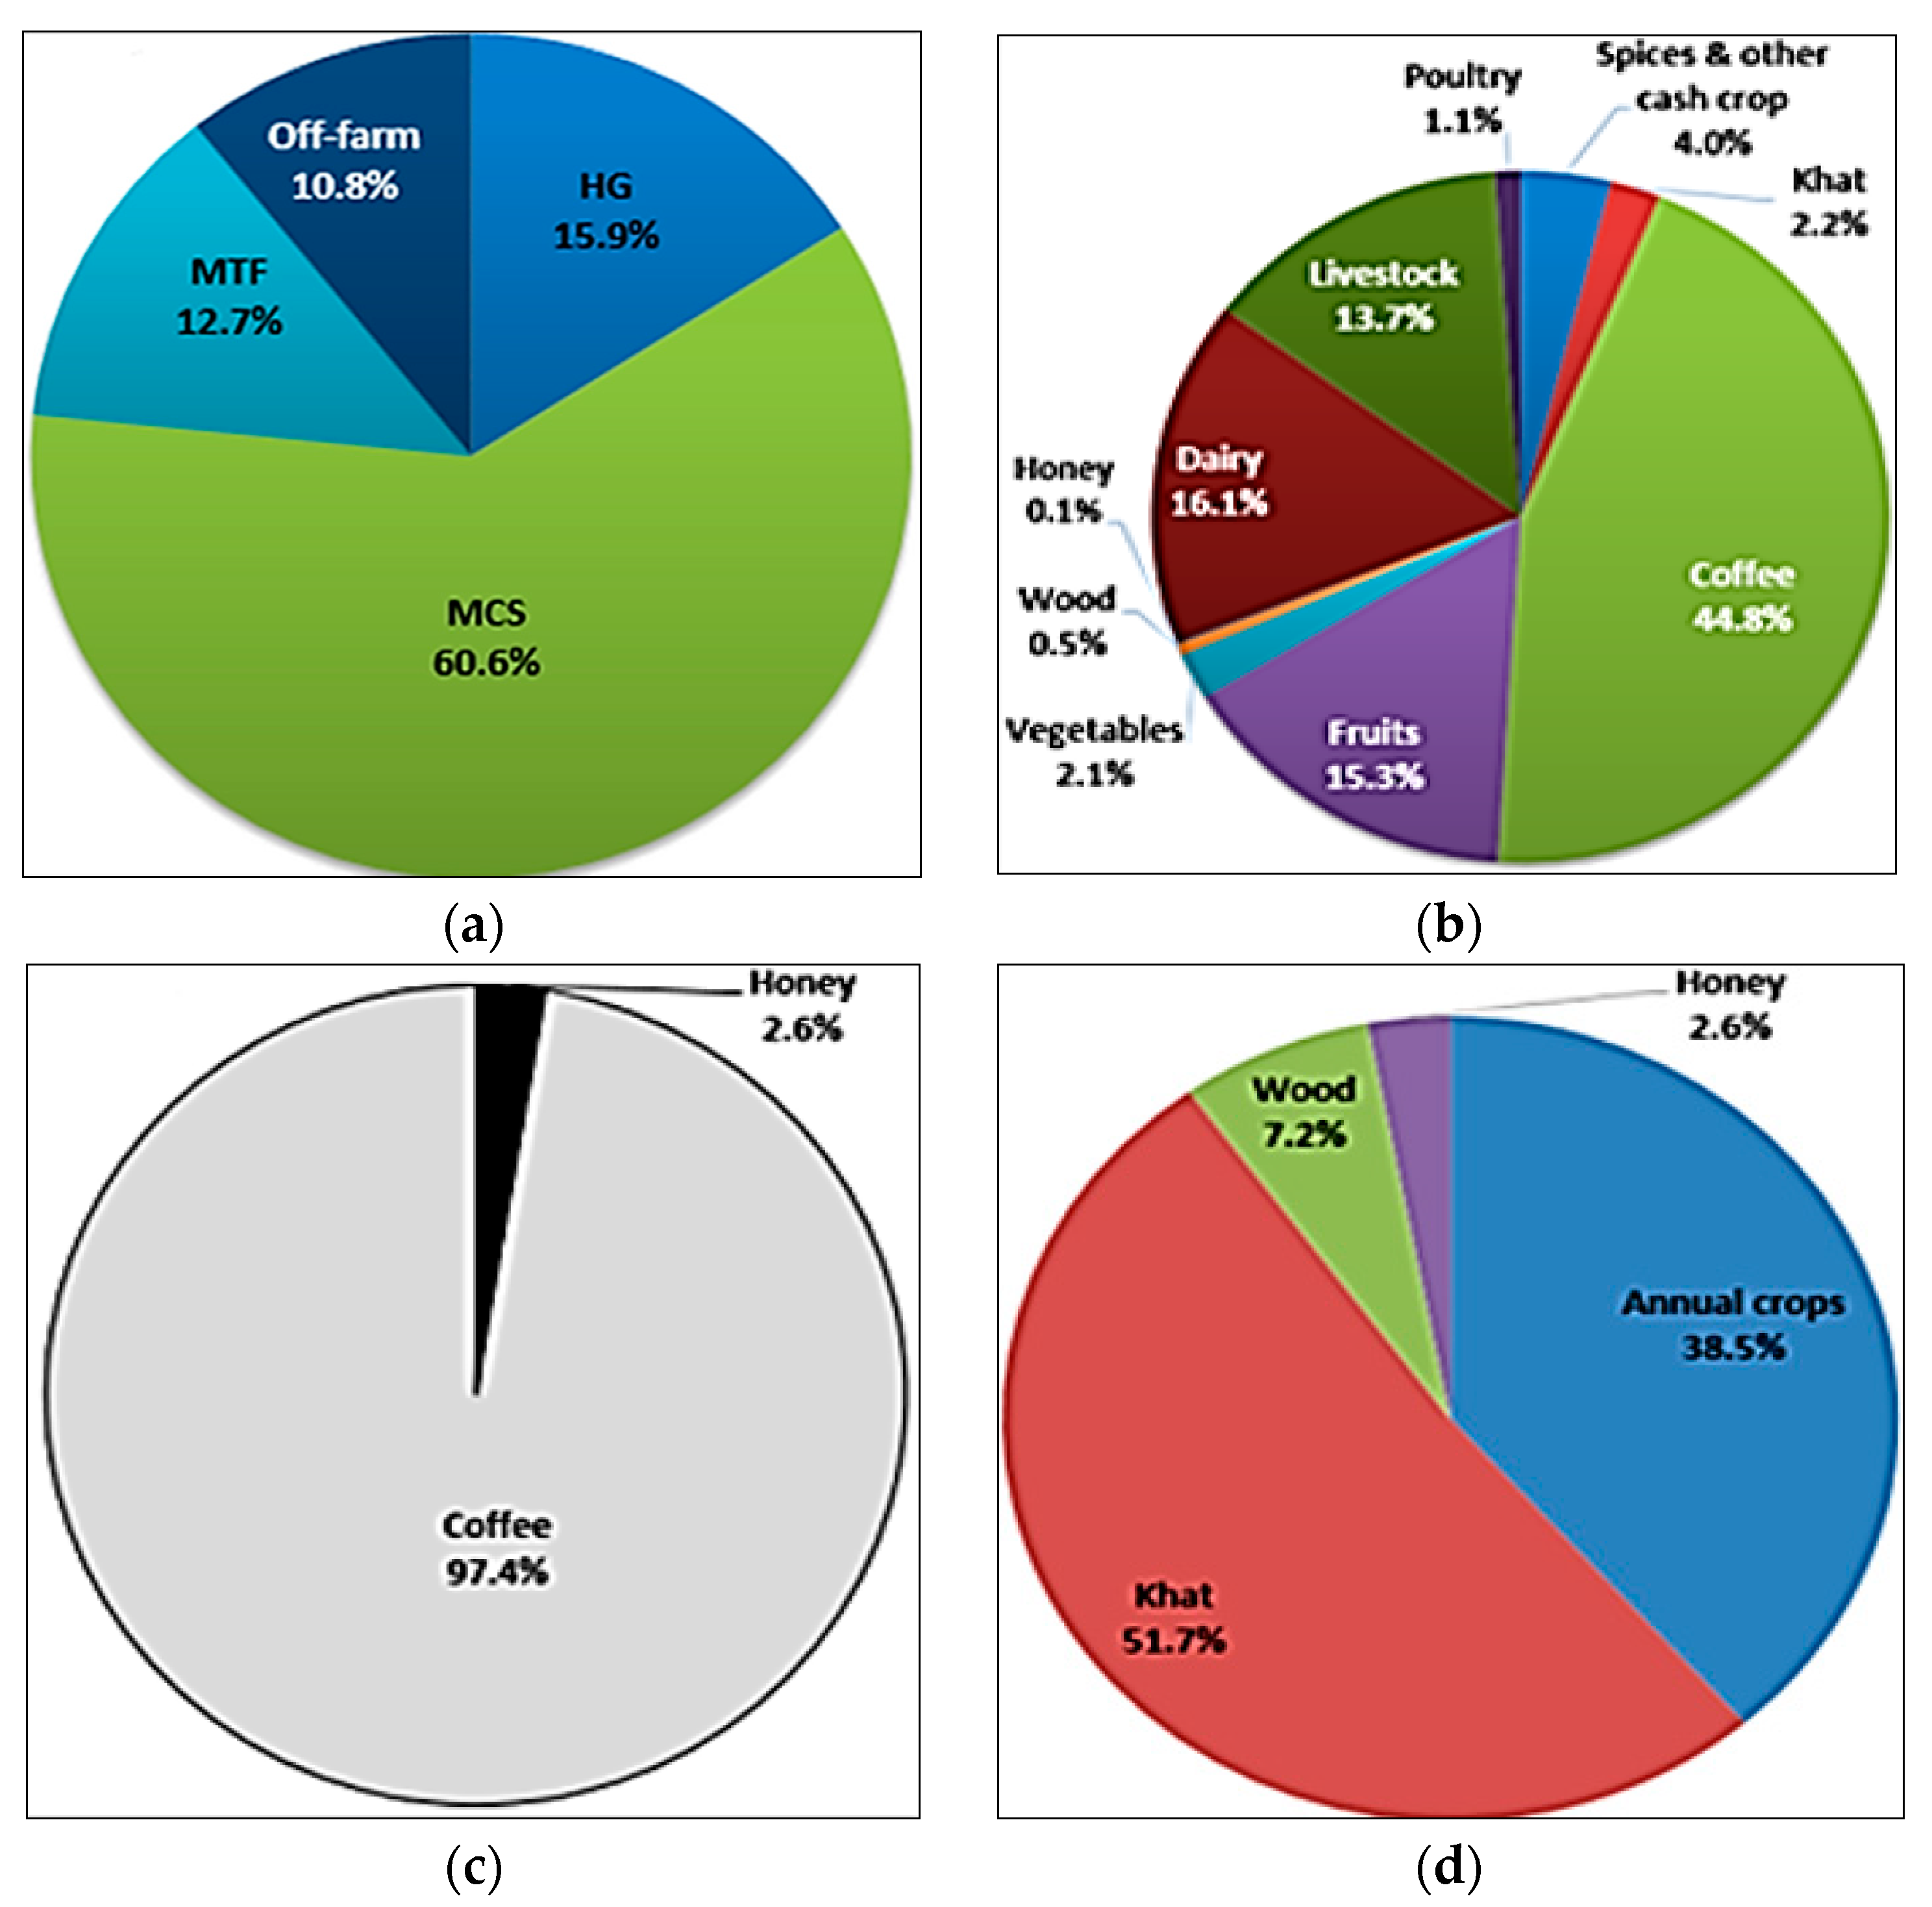
Farming in all three AFPs accounts for almost 90% of the households’ income; MCS has the largest share (60%), mainly from selling Coffea arabica (Figure 7a,c). In HG, Coffea arabica generates 45% of the cash, the rest is provided mainly by fruits and livestock-related activities (Figure 7b). As MTF is mostly devoted to food production for self-consumption, the contribution to the households’ income was slightly lower than that in MCS and HG (Figure 7a). Cash was rather generated through the sale of cash crops such as Catha edulis (52%), and annual crops such as Eragrostis tef and Zea mays (38%) (Figure 7d).
Among the 127 species identified, 50 (39.1%) were reported as ‘actively-marketed species’. In terms of species composition, HG showed the highest percentage of both active and passively (occasionally) marketed species (47), followed by MTF scoring a much lower species count (nine). On the other hand, only one actively-marketed species was reported in MCS (Coffea arabica). On average, the largest number of cash crops per households was recorded in HG (7.6). Regardless of the mode of utilization, whether for self-consumption or selling, almost all households had at least one actively-marketed species. The species counts and richness of all marketed species categories in MTF were found to differ significantly (p > 0.01). The actively-marketed species category was significantly different (p < 0.01) from the passively-marketed and non-marketed category in all practices except in MCS (Table 5).
4. Discussion
4.1. Agroforestry Practices and Purposes
The three major AFPs, i.e., HG, MCS, and MTF, have their own primary production purposes and specific management, which enable smallholder farm households to diversify their production across the year. Hence, all three are important for sustaining the livelihoods of farmers in Yayu. This was confirmed by the fact that more than 80% of the households in Yayu practice all three agroforestry systems.
However, each practice plays a predominant role. MCS is mainly used to generate money and, for the majority of households, is the main, if not the only, source of cash. Most farmers use MTF to produce food, and HG is used for both a source of food and cash to supplement the other two practices. In the absence of either one or two practices, the importance of HG increases, becoming the main source of food and/or income. Similar findings were obtained by Kebebew and Urgessa [52] in the Jimma area, southwestern Ethiopia.
Besides these, each AFP provides other benefits. This is especially true in the case of HG, as management practices tend to encourage the production of useful by-products such as fuel, fodder, and timber. Contrarily, MCS and MTF have rather specific purposes, and activities not directly contributing to yield maximization, as in the case of MCS, are discouraged [38].
In the three AFPs, gender roles differ. Women are mostly in charge of the management and utilization of HG, securing the annual food provision and supplementary cash for the household [40,53,54]. In contrast, the management and benefits of MCS and MTF are mostly controlled by males—generally heads of the households [53,55].
4.2. Predominant Species Composition
The highest number of species was found in HG, followed by MCS and MTF. Only 19% of the identified species were found in all practices, and 52% occurred in only one of the three AFP. So, species distribution is practice/system-specific. The number of species in HG is similar to values reported in other studies [15,16,18,56].
Regarding growth habits, as expected, perennial species were dominant but also shrubs were common, although fewer in MCS and MTF due to the regular clearings carried out to prevent competition.
Concerning the species diversity, based on their origin, about 70% of the species identified were native, confirming that the Yayu area is naturally endowed with high biodiversity [39]. A higher number of exotic species were observed in HG, followed by MTF and MCS. This confirms that coffee forest production (MCS) is more environmentally friendly than the other two practices. This finding validates those of Muleta et al. [38] and Gole et al. [22], who observed that local communities exert their experience in managing the naturally grown coffee for commercial purposes. Nevertheless, there is a remarkable dominance of individual species, especially in MCS and MTF, by Coffea arabica and Zea mays, respectively. The dominance of Zea mays in MTF is consistent with similar reports from the Koga watershed in northwestern Ethiopia [57]. In contrast, the species frequency distribution in HG is rather flat, as the HG approach has multiple production objectives, i.e., stimulants, fruits, vegetables, roots and tubers, and timber. However, Kebebew and Urgessa [52] reported that fruit trees were a dominant group of species in HG of Jimma.
4.3. Species Uses and Services
All three practices provide additional uses and services besides food. HG was found to be the most versatile, as it delivers 10 different groups of uses and services. Similar values were observed in Abebe [8], Senbeta et al. [39], and Méndez [46]. The types of uses and services by practice were cross-analyzed, e.g., food uses in HG were inversely correlated with the MTF size, i.e., as the size of MTF increases, the number of food crops in HG plots decreases (Table A1, Appendix A). According to the local farmers, this relation is common in the area because those households who produce a sufficiently large amount of cereals from their MTF are less interested in using their HG for growing food. Similarly, the production of ‘stimulants’, specifically Coffea arabica, in HG, decreases as the households have larger MCS plots (Table A1, Appendix A). Both cases show the complementarity that exists among the AFPs of Yayu.
Most uses and services except ‘food’, ‘spices, condiments, and other food and beverage additives’, and ‘shade trees for coffee’ were provided by all AFPs. Local farmers confirmed that ‘fuel’ is mainly a by-product of MCS pruning, weeding, thinning, and clearing. Meanwhile, in HG-specific species, such as Vernonia amygdalina, are cultivated solely for the production of fuel. The situation is similar with regard to ‘fodder’, where multipurpose trees supplement the hay obtained from the communal grazing lands [40,55].
On the other hand, some uses and services are limited to specific practices. For instance, ‘shade trees for coffee’ was observed only in MCS and HG, as Coffea arabica is hardly present in MTF. Similarly, ‘other services’ such as live fences and hedges are more important for MTF and HG than for MCS, as was reported for the area by Etissa et al. [56].
4.4. Food Production Potential
MTF and HG were found to be the main food-supplying practices. The number of all edible species identified (80) was considerably higher than in other areas with a similar ecological profile in Ethiopia, e.g., 23 by Senbeta et al. [39] in Yayu, 59 by Abebe [58] in HG of Sidama. However, differently from these studies, which considered only native species, the present study included both native and exotic species.
HG has the larger share of active foods species (82.5%) compared to 1.5% in MCS and 20% in MTF. The dominant active food species in MTF are Zea mays, Sorghum bicolor, Eleusine coracana, and Eragrostis tef, which are ingredients of the traditional food Enjera (main source of carbohydrates). Other second-order species are Vicia faba and Pisum sativum, which are leguminous providers of protein. Similar values were observed in the Jimma zone [52] and the upper Blue Nile basin [57].
Noticeable is the low supply of staple foods by MTF during the ‘food gap’, the window of time between seasons. This is generally filled with food cultivated in HG [40,53], including species such as Ensete ventricosum, which is available throughout the year [6,7,8,59], and Colocasia antiquorum, Dioscoreaal alta, and Solanum tuberosum, which are available during the ‘food gap’ specifically, and are complemented by leafy vegetables such as Brassica oleraceae spp. and Brassica carinata [40,55,60,61].
Concerning the presence of ‘active-foods’, MTF is dominated by cereals but lacks vegetables and fruits, which are mostly provided by HG, endowed by a broader diversity of active food species from different food groups, e.g., Carica papaya, Prunus persica, Daucus carot, Cucurbita pepo, Capsicum frutescens, Brassica oleracea, Brassica carinata, etc., which are also key sources of micronutrients.
4.5. Income Generation Potential
Household economic capability to acquire food in the market is key for the food access pillar [62,63]. As shown, 95% of the monetary income in Yayu comes from selling Coffea arabica harvested from MCS. This cash is used not only to buy food but also to cover other expenditures [40,54].
However, this high dependency on Coffea arabica creates a concomitant cash shortage. Alternatively, HG provides a diversity of merchantable products, e.g., dairy products, fruit, livestock, spices, and even other cash crops that are sold throughout the year, but especially during that ‘cash gap’. The findings of Etissa et al. [56] confirmed this. Similarly, in MTF, with Catha edulis being harvested several times throughout the year, can generate a continuous flow of cash, and in the case of annual crops, whenever surplus is achieved it may also be sold. An interesting paradox occurs with Eragrostis tef, the most valued staple, which sometimes is sold to buy cheaper staples like Zea mays and Sorghum bicolor.
Regarding the species richness of each marketability category, most species cultivated in HG, such as Catha edulis, Musa paradisiaca, Mangifera indica, and Rhamnus prinoides, were actively sold in the area. Contrastingly, MCS and MTF were dominated by non-marketable tree species in number but not in area. This is likely due to the priority given to Coffea arabica in MCS, and to annual crops such as Zea mays and Sorghum bicolor in MTF. In general, the non-marketed species exceeded the marketable categories, suggesting a potential of improvement via conservation, transformation, and/or marketing.
4.6. Relationships among Household and Agroforestry Attributes
The correlation analysis conducted between attributes of the household and agroforestry practices (see Table A1, Appendix A) disclosed that altitude and proximity to market are the two most important household attributes, which influencing the species composition and richness of a given AFP in Yayu. As the traditional coffee production system causes minimum damage on the existing vegetation and as it exists in a biosphere reserve, the residual influence of the original vegetation on the current species composition of AFPs was expected. The original vegetation is mainly a result of the local topography and ecological factors. These results agree with those of Addi et al. [64], who focused on the correlation of natural vegetation composition and altitude in southwestern Ethiopia, and those of Bajigo et al. [17], who observed a similar association of altitude with woody species diversity in HG of the Wolayita zone.
Similarly, the market has a considerable influence on the type of species grown and their purpose of management under each AFP of Yayu. For instance, in Yayu, households located near to the market had better species richness than those farther away. In facts, both negative and positive influences of the market on different traits of AFPs have been reported. For instance, in line with the present study, the authors of Reference [8] reported a positive correlation between the species richness of agroforestry plots and proximity to markets in the Sidama zone in Ethiopia. In contrast, Reference [65], studying HG diversity in Indonesia, revealed that HG near to markets tended to be dominated by a few commercial crops. In Yayu, the major reason for the higher species richness in HG near to markets may be the dominance that Coffea arabica already has on MCS, while the others are purposefully managed to meet household and market demands.
Gender also correlates with the richness of some species groups, depending on the purpose of management, plot location, and labor demand of the species. For example, cultivating legumes and cereals in MTF plots requires higher cropping and guarding labor, which the female-headed households often lack. According to the local people, the females in those households are often widows or divorced mothers. These avoid labor-demanding crops in their MTF plots and convert a share to cash-generating tree species such as Eucalyptus grandis and give the rest to sharecroppers [53]. On the other hand, the HG plots of female-headed households were rich in food groups such as vitamin A-rich dark green vegetables and tuber and root crops, which are of great importance for the food security of these households during shortage times. A study conducted on the driving forces of changes in the structure of traditional HG agroforestry of southern Ethiopia reported a more significant relation between women and food crops than between women and cash crops grown in HG [66].
In general, the migrant and resettled households had AFP plots that were less rich in native useful species, including edible ones, than the native households, except for the actively-marketed species. This because they have relatively less knowledge about the type and uses of native plant species. According to the local people, the resettled households change the species of their AFP into merchantable exotic species more frequently than the natives. This implies that the impact of migration has a considerable impact on the environment, especially on non-marketable species. Lemenih et al. [67] confirmed the negative relationship between migration and environmental management as a lack of formal or informal structure and poor social capital with respect to the native environment.
4.7. The Five Pillars of Food Security
This study demonstrated that each AFP has considerable potential, but differentiated contribution toward the five pillars of FNS of small farming households of Yayu. MTF primarily contributes to the ‘availability’ pillar by serving as the main supply of the annual food. MCS is solely to contributor to the ‘access’ pillar by generating the annual cash the household uses to purchase food and other food-related inputs from the market. The HG plots of smallholders usually are used to fill the seasonal and unexpected food and cash supply gaps by producing crops with different harvesting seasons, which ultimately enhance the stability of the above two pillars. Furthermore, the diversity in all three AFPs plays an important role for the ‘utilization’ pillar by providing fruits, vegetables, fuel, and fodder, which ultimately increases the access of the household to diverse and healthy foods. The final pillar, ‘sovereignty’, is mainly assured by the HG as its management and selling of products are mostly controlled by the female family members, who manage the type of food prepared for the household.
5. Conclusions
Yayu agroforestry practices (AFPs) constitute a remarkable case study concerning potential local-based efforts to improve food and nutrition security (FNS). The local farmers use three different AFPs, namely homegarden (HG), multistorey-coffee-system (MCS), and multipurpose-trees on-farmland (MTF), with different spatial and temporal arrangements, structures, and compositions. Each has a main purpose, i.e., MTF for food production, MCS for cash generation, and HG for both. Inter- and intra-practice variations exist with respect to species composition and utilization. Making the best use of their differences, farmers manage and utilize these practices in a synchronized way to sustain their livelihoods.
Based on the correlation analysis, it is concluded that the species composition, structure, and mode of utilization of a given AFP in Yayu is a function of household attributes such as elevation, proximity to market, gender, and settlement history.
This study also acknowledges the existence of a knowledge gap regarding the detailed contributions of AFPs to the current FNS of smallholder farm households in Yayu. Thus, empirical research should assess the FNS status of smallholder farm households to relate this with the observed attributes of each AFP. As shown, the Yayu area is endowed with untapped resources of edible and marketable plants, whose contributions should be explored in depth, particularly of those within local AFPs, toward the enhancement of FNS as well as the living standards of smallholder farm households of Yayu and other similar areas.
Author Contributions
Conceptualization, O.J., D.C.-C., and M.v.N.; field work, analysis, drafting, O.J.; review and editing, O.J., D.C.C., and M.v.N.
Funding
This research was funded by the German Federal Ministries of Education and Research (BMBF) and of Cooperation and Development (BMZ), grant number FKZ 031 A258 A.
Acknowledgments
We are greatly indebted to Ato. Abdata W.; Ato. Alebacew T.; Ato. Bekele D.; Ato. Bekele M.; W/ro Bekabil Z.; Ato. Bekele Z; Ato. Fiqadu B.; W/ro Hora A.; Ato. Korsa T.; W/ro Nuri F.; Ato. Olana D for their cooperation during data collection. We thank also the ECFF (Environment and Coffee Forest Forum) and the Agricultural offices of Yayu and the surrounding Woreda—their support and facilitation were indispensable for realization of the field work.
Conflicts of Interest
The authors declare no conflict of interest.
Appendix A

Table A1.
Pearson correlation coefficients between attributes of three agroforestry practices and household characteristics in Yayu.
Table A1.
Pearson correlation coefficients between attributes of three agroforestry practices and household characteristics in Yayu.
| Attributes | Appendix A | Appendix A | Appendix A | Appendix A | Appendix A | Appendix A | Appendix A | Appendix A | Appendix A | Appendix A | Appendix A | Appendix A | Appendix A | Appendix A | Appendix A | Appendix A |
|---|---|---|---|---|---|---|---|---|---|---|---|---|---|---|---|---|
| Type of main purpose | HG | −0.16 ** | −0.18 ** | −0.03 | −0.17 ** | 0.11 | −0.17 | 0.13 * | −0.01 | 0.11 | 0.15 * | 0.14 * | 0.16 ** | 0.28 ** | 0.14 * | 0.11 |
| MCS | −0.04 | −0.05 | 0.01 | −0.04 | 0.04 | 0.05 | −0.01 | −0.04 | −0.03 | 0.04 | 0.14 * | 0.18 ** | 0.07 | 0.17 ** | 0.09 | |
| MTF | −0.25 ** | −0.22 ** | 0.06 | 0.03 | 0.14 * | 0.01 | −0.01 | −0.08 | 0.03 | 0.03 | 0.14 * | 0.16 ** | 0.15 ** | 0.16 ** | 0.07 | |
| Number of benefits | HG | −0.24 ** | −0.19 ** | −0.06 | −0.12 * | 0.15 * | −0.2 ** | 0.17 ** | −0.08 | 0.04 | 0.22 ** | 0.23 ** | 0.22 ** | 0.51 ** | 0.23 ** | 0.10 |
| MCS | −0.15 ** | −0.15 | 0.09 | −0.17 ** | 0.05 | −0.02 | 0.04 | 0.01 | 0.06 | 0.20 ** | 0.3 ** | 0.34 ** | 0.25 ** | 0.34 ** | 0.15 ** | |
| MTF | −0.31 ** | −0.30 ** | −0.02 | −0.08 | 0.17 ** | −0.14 | 0.11 | −0.03 | 0.06 | 0.15 * | 0.23 ** | 0.24 ** | 0.28 ** | 0.22 ** | 0.14 * | |
| Total no. of species | HG | −0.33 ** | −0.30 ** | −0.12 | 0.01 | 0.08 | −0.15 * | 0.16 ** | 0.01 | 0.15 * | 0.12 * | 0.09 | 0.13 * | 0.17 ** | 0.25 ** | −0.12 |
| MCS | −0.27 ** | −0.33 ** | 0.08 | −0.08 | 0.06 | −0.16 ** | 0.18 ** | 0.10 | 0.06 | 0.17 ** | 0.14 * | 0.25 ** | 0.11 | 0.33 ** | −0.01 | |
| MTF | −0.13 * | −0.12 | 0.09 | −0.10 | 0.05 | −0.14 * | 0.13 * | 0.08 | 0.10 | 0.22 ** | 0.09 | 0.17 ** | 0.15 * | 0.20 ** | 0.03 | |
| Number of native species | HG | −0.17 ** | −0.09 | −0.18 ** | −0.02 | 0.04 | −0.30 ** | 0.27 ** | −0.01 | 0.18 ** | 0.07 | 0.09 | 0.10 | 0.17 ** | 0.17 ** | −0.05 |
| MCS | −0.27 ** | −0.33 ** | 0.08 | −0.08 | 0.05 | −0.16 ** | 0.18 ** | 0.10 | 0.06 | 0.17 ** | 0.14 * | 0.24 ** | 0.11 * | 0.32 ** | −0.01 | |
| MTF | −0.07 | −0.07 | 0.11 | −0.08 | 0.06 | −0.14 * | 0.12 | 0.08 | 0.13 * | 0.21 ** | 0.07 | 0.15 * | 0.12 | 0.18 ** | 0.02 | |
| Number of exotic species | HG | −0.36 ** | −0.38 ** | −0.02 | 0.03 | 0.08 | 0.05 | 0.00 | 0.02 | 0.06 | 0.12 * | 0.06 | 0.11 | 0.11 | 0.23 ** | −0.13 * |
| MCS | −0.08 | −0.09 | 0.07 | 0.02 | 0.07 | 0.00 | 0.03 | 0.05 | 0.02 | 0.07 | 0.08 | 0.14 * | 0.05 | 0.23 ** | −0.06 | |
| MTF | −0.21 ** | −0.19 ** | −0.04 | −0.10 | −0.03 | −0.04 | 0.04 | 0.01 | −0.05 | 0.08 | 0.10 | 0.10 | 0.12 | 0.11 | 0.04 | |
| Number of species cultivated as food | HG | −0.26 ** | −0.3 ** | −0.02 | 0.08 | 0.13 * | −0.12 * | 0.15 * | 0.05 | 0.09 | 0.04 | −0.04 | 0.04 | −0.05 | 0.13 * | −0.17 ** |
| MTF | 0.32 ** | 0.38 ** | −0.16 * | −0.19 ** | −0.02 | −0.08 | 0.04 | 0.04 | 0.00 | 0.07 | 0.14 * | 0.17 ** | 0.11 | 0.03 | 0.33 ** | |
| Number of species cultivated as stimulant | HG | −0.29 ** | −0.26 ** | 0.09 | −0.10 | −0.02 | −0.2 ** | 0.21 ** | 0.06 | 0.11 | 0.04 | 0.15 * | 0.06 | 0.14 * | 0.11 | −0.06 |
| MCS | 0.29 ** | 0.35 ** | −0.09 | 0.13 * | −0.05 | 0.15 ** | −0.18 ** | −0.12 * | −0.06 | −0.18 ** | −0.11 | −0.15 ** | −0.11 | −0.21 ** | 0.02 | |
| MTF | −0.34 ** | −0.34 ** | 0.12 | −0.02 | 0.10 | −0.08 | 0.11 | −0.05 | 0.13 * | 0.13 * | 0.12 | 0.22 ** | 0.18 ** | 0.29 ** | −0.10 | |
| Richness of edible species total | HG | −0.35 ** | −0.36 ** | −0.01 | 0.09 | 0.11 | −0.10 | 0.11 | 0.00 | 0.09 | 0.05 | −0.02 | 0.06 | −0.01 | 0.17 ** | −0.20 ** |
| MCS | −0.04 | −0.08 | 0.02 | 0.06 | −0.07 | −0.03 | 0.05 | −0.07 | 0.02 | 0.07 | 0.00 | 0.06 | −0.06 | 0.13 * | −0.01 | |
| MTF | 0.15 * | 0.13 * | −0.01 | −0.13 * | 0.02 | −0.15 * | 0.14 * | 0.12 | 0.11 | 0.11 | 0.02 | 0.11 | 0.02 | 0.07 | 0.13 * | |
| Richness of active-food species | HG | −0.34 ** | −0.37 ** | 0.03 | 0.11 | 0.11 | −0.11 | 0.11 | −0.01 | 0.10 | 0.02 | −0.06 | 0.02 | −0.05 | 0.13 * | −0.21 ** |
| MTF | 0.19 ** | 0.25 ** | −0.12 | −0.2 ** | 0.03 | −0.12 | 0.09 | 0.02 | 0.07 | 0.12 | 0.19 ** | 0.26 ** | 0.18 ** | 0.15 * | 0.30 ** | |
| Richness of actively-marketed species | HG | −0.35 ** | −0.38 ** | 0.07 | 0.02 | 0.08 | 0.03 | −0.03 | −0.02 | 0.04 | 0.04 | −0.12 * | 0.05 | 0.00 | 0.16 * | −0.20 ** |
| MCS | 0.25 ** | 0.29 ** | −0.10 | 0.11 | −0.03 | 0.11 | −0.14 * | −0.13 * | −0.05 | −0.18 ** | 0.02 | −0.09 | −0.10 | −0.13 * | 0.00 | |
| MTF | −0.08 | −0.05 | −0.10 | −0.14 * | 0.13 * | −0.13 * | 0.12 * | −0.04 | 0.04 | 0.17 ** | 0.22 ** | 0.32 ** | 0.27 ** | 0.27 ** | 0.26 ** | |
| Richness of cereals | HG | 0.00 | −0.04 | −0.09 | 0.08 | −0.12 | −0.08 | 0.11 | 0.14 * | 0.07 | −0.05 | −0.18 ** | −0.25 ** | −0.13 * | −0.13 * | −0.47 ** |
| MTF | 0.28 ** | 0.27 ** | −0.12 | −0.14 * | 0.02 | −0.07 | 0.04 | 0.07 | 0.052 | 0.14 * | 0.16 ** | 0.15 * | 0.09 | 0.05 | 0.27 ** | |
| Richness of roots and tubers | HG | −0.08 | −0.14 * | −0.11 | 0.15 * | 0.19 ** | −0.34 ** | 0.40 ** | −0.05 | 0.16 ** | 0.02 | −0.07 | −0.01 | −0.02 | 0.06 | −0.03 |
| Richness of legumes and nuts | HG | −0.01 | −0.05 | 0.07 | 0.06 | −0.03 | −0.08 | 0.01 | 0.08 | 0.08 | −0.09 | −0.21 ** | −0.21 ** | −0.13 * | −0.12 | −0.27 ** |
| MTF | 0.14 * | 0.25 ** | −0.11 | −0.15 * | −0.09 | −0.07 | 0.04 | 0.03 | −0.02 | −0.05 | 0.10 | 0.06 | 0.04 | −0.03 | 0.18 ** | |
| Richness of vitamin A-rich vegetables | HG | −0.01 | 0.10 | 0.08 | −0.02 | 0.05 | 0.20 ** | −0.19 ** | −0.05 | −0.10 | 0.03 | 0.03 | 0.05 | 0.01 | −0.03 | 0.07 |
| Richness of dark green leafy vegetables | HG | 0.13 * | 0.19 ** | −0.05 | 0.02 | −0.09 | −0.12 * | 0.13 * | 0.01 | 0.04 | −0.03 | −0.13 * | −0.09 | −0.14 * | −0.11 | −0.05 |
| Richness of vitamin A-rich fruits | HG | −0.26 ** | −0.23 ** | −0.10 | −0.10 | −0.03 | 0.01 | −0.02 | −0.05 | 0.05 | 0.05 | 0.06 | 0.09 | 0.11 | 0.13 * | −0.07 |
| Richness of other vegetables | HG | 0.07 | 0.06 | 0.18 ** | 0.02 | 0.00 | 0.39 ** | −0.39 * | −0.14 * | −0.17 ** | 0.00 | 0.02 | 0.08 | −0.01 | 0.08 | 0.06 |
| Richness of other fruits | HG | −0.26 ** | −0.38 ** | −0.01 | 0.01 | 0.15 * | −0.10 | 0.11 | 0.07 | 0.06 | 0.09 | 0.03 | 0.18 ** | 0.09 | 0.26 ** | 0.02 |
* significant correlation at p < 0.05; ** significant correlation at p < 0.01; β nominal variables.
References
- Garrity, D.P. Agroforestry and the achievement of the Millennium Development Goals. Agrofor. Syst. 2004, 61, 5–17. [Google Scholar] [CrossRef]
- Hasan, M.K.; Alam, A.A. Land degradation situation in Bangladesh and role of agroforestry. J. Agric. Rural Dev. 2006, 4, 19–25. [Google Scholar] [CrossRef]
- Kalaba, K.F.; Chirwa, P.; Syampungani, S.; Ajayi, C.O. Contribution of agroforestry to biodiversity and livelihoods improvement in rural communities of Southern African regions. In Tropical Rainforests and Agroforests under Global Change; Tscharntke, T., Leuschner, C., Veldkamp, E., Eds.; Springer: Berlin, Germany, 2010; pp. 461–476. ISBN 978-3-642-00493-3. [Google Scholar]
- Bishaw, B.; Neufeldt, H.; Mowo, J.; Abdelkadir, A.; Muriuki, J.; Dalle, G.; Assefa, T.; Guillozet, K.; Kassa, H.; Dawson, K.; et al. Farmers’ Strategies for Adapting to and Mitigating Climate Variability and Change through Agroforestry in Ethiopia and Kenya; Oregon State University: Corvallis, OR, USA, 2013. [Google Scholar]
- Mbow, C.; Van Noordwijk, M.; Luedeling, E.; Neufeldt, H.; Minang, A.P.; Kowero, G. Agroforestry solutions to address food security and climate change challenges in Africa. Curr. Opin. Environ. Sustain. 2014, 6, 61–67. [Google Scholar] [CrossRef] [Green Version]
- Abate, T.; Hiebsch, C.; Brandt, S.A.; Gebremariam, S. Enset-based sustainable agriculture in Ethiopia. In Proceedings from the International Workshop on Enset; Abate, T., Hiebsch, C., Brandt, S.A., Gebremariam, S., Eds.; IAR: Addis Abeba, Ethiopia, 1996. [Google Scholar]
- Brandt, S.; Spring, A.; Clitton, H.; McCabe, J.T.; Tabogie, E.; Diro, M.; Woldemichael, G.; Yintiso, G.; Shigeta, M.; Tesfaye, S. The “Tree against Hunger”: Enset-Based Agricultural Systems in Ethiopia; American Association for the Advancement of Science: Washington, DC, USA, 1997. [Google Scholar]
- Abebe, T. Determinants of crop diversity and composition in Enset-coffee agroforestry homegardens of Southern Ethiopia. J. Agric. Rural Dev. Trop. Subtrop. 2013, 114, 29–38. [Google Scholar]
- Van Noordwijk, M.; Bizard, V.; Wangpakapattanawong, P.; Tata, H.L.; Villamor, G.B.; Leimona, B. Tree cover transitions and food security in Southeast Asia. Glob. Food Secur. 2014, 3, 200–208. [Google Scholar] [CrossRef]
- Ickowitz, A.; Powell, B.; Salim, M.A.; Sunderland, T.C.H. Dietary quality and tree cover in Africa. Glob. Environ. Chang. 2013, 24, 287–294. [Google Scholar] [CrossRef]
- Jamnadass, R.; Place, F.; Torquebiau, E.; Malézieux, E.; Liyama, M.; Sileshi, G.; Kehlenbeck, K.; Masters, E.; McMullin, S.; Dawson, I. Agroforestry, Food and Nutritional Security; Working Paper No. 170; ICRAF: Nairobi, Kenya, 2013. [Google Scholar] [CrossRef]
- Food and Agriculture Organization (FAO). The State of Food and Agriculture. Biofuels: Prospects, Risks and Opportunities; Food and Agriculture Organization: Rome, Italy, 2008. [Google Scholar]
- Altieri, M.A.; Funes-Monzote, F.R.; Petersen, P. Agroecologically efficient agricultural systems for smallholder farmers: Contributions to food sovereignty. Agron. Sustain. Dev. 2012, 32, 1–13. [Google Scholar] [CrossRef]
- Wilson, A. Household Food Security and Food Sovereignty: Framing the Future of Hunger and Agriculture. University Honor’s Thesis, Portland State University, Portland, OR, USA, 2015. [Google Scholar]
- Abebe, T. Diversity in Homegarden Agroforestry Systems of Southern Ethiopia. Ph.D. Thesis, Wageningen University, Wageningen, The Netherlands, 2005. [Google Scholar]
- Mekonnen, E.L.; Asfaw, Z.; Zewudie, S. Plant species diversity of homegarden agroforestry in Jabithenan district, North-Western Ethiopia. Int. J. Biodivers. Conserv. 2014, 6, 301–307. [Google Scholar] [CrossRef]
- Bajigo, A.; Tadesse, M. Woody species diversity of traditional agroforestry practices in Gununo watershed in Wolayitta zone, Ethiopia. For. Res. 2015, 4, 155. [Google Scholar] [CrossRef]
- Mengitu, M.; Fitamo, D. Plant species diversity and composition of the homegardens in Dilla Zuriya Woreda, Gedeo Zone, SNNPRS, Ethiopia. Plant 2015, 3, 80–86. [Google Scholar] [CrossRef]
- Poschen, P. An evaluation of the Acacia albida-based agroforestry practices in the Hararghe highlands of Eastern Ethiopia. Agrofor. Syst. 1986, 4, 129–143. [Google Scholar] [CrossRef]
- Tesemma, M.N. The Indigenous Agroforestry Systems of the South-Eastern Rift Valley Escarpment, Ethiopia: Their Biodiversity, Carbon Stocks, and Litterfall. Ph.D. Thesis, University of Helsinki, Helsinki, Finland, 2013. [Google Scholar]
- Asfaw, Z.; Ågren, G.I. Farmers’ local knowledge and topsoil properties of agroforestry practices in Sidama, Southern Ethiopia. Agrofor. Syst. 2007, 71, 35–48. [Google Scholar] [CrossRef]
- Gole, W.T.; Senbeta, F.; Tesfaye, K.; Fite, G. Yayu Coffee Forest Biosphere Reserve Nomination Form; Ethiopian MAB National Committee: Addis Ababa, Ethiopia, 2009. [Google Scholar]
- Assefa, A.D. Local Institutions and Their Influence on Forest Resource Management in Southwest of Ethiopia: The Case of Yayu Forest. Master’s Thesis, Addis Ababa University, Addis Ababa, Ethiopia, 2010. [Google Scholar]
- Reliefweb. The Ethiopia Network on Food Security. 2002. Available online: http://reliefweb.int/sites/reliefweb.int/files/resources/9CF3EE6079D3BD7785256B61004C77EB-usaid_eth_14feb.pdf (accessed on 28 March 2017).
- Famine Early Warning Systems Network (FEWS NET). Ethiopia: Food Security Update. 2005. Available online: http://www.fews.net/sites/default/files/documents/reports/Ethiopia_200503en.pdf (accessed on 28 August 2017).
- Famine Early Warning Systems Network (FEWS NET). Ethiopia: Food Security Outlook. 2009. Available online: http://www.fews.net/sites/default/files/documents/reports/ethiopia_OL_04_2009_final.pdf (accessed on 28 August 2017).
- Famine Early Warning Systems Network (FEWS NET). Ethiopia: Food Security Outlook. 2013. Available online: http://www.fews.net/sites/default/files/documents/reports/Ethiopia_OL_10_2013_0.pdf (accessed on 28 August 2017).
- Famine Early Warning Systems Network (FEWS NET). Ethiopia: Food Security Outlook. 2015. Available online: http://www.fews.net/sites/default/files/documents/reports/Ethiopia_OL_2015_10_0.pdf (accessed on 28 August 2017).
- Famine Early Warning Systems Network (FEWS NET). Ethiopia: Famine Early Warning Systems Network. 2017. Available online: http://www.fews.net/east-africa/ethiopia (accessed on 28 August 2017).
- Taye, E. Report on Woody Plant Inventory of Yayu National Forestry Priority Area; IBCR/GTZ: Addis Ababa, Ethiopia, 2001; pp. 2–21. [Google Scholar]
- Yeshitela, K.; Bekele, T. Plant community analysis and ecology of Afromontane and transitional rainforest vegetation of southwestern Ethiopia. SINET Ethiop. J. Sci. 2002, 25, 155–175. [Google Scholar] [CrossRef]
- Gole, W.T. Vegetation of the Yayu Forest in SW Ethiopia: Impacts of Human Use and Implications for In Situ Conservation of Wild Coffea arabica, L. Populations. Ph.D. Thesis, University of Bonn, Bonn, Germany, 2003. [Google Scholar]
- Senbeta, F.; Schmitt, C.; Denich, M.; Demissew, S.; Velk, P.L.; Preisinger, H.; Woldemariam, T.; Teketay, D. The diversity and distribution of lianas in the Afromontane rain forests of Ethiopia. Divers. Distrib. 2005, 11, 443–452. [Google Scholar] [CrossRef]
- Senbeta, F.; Denich, M. Effects of wild coffee management on species diversity in the Afromontane rainforests of Ethiopia. For. Ecol. Manag. 2006, 232, 68–74. [Google Scholar] [CrossRef]
- Gole, W.T.; Borsch, T.; Denich, M.; Teketay, D. Floristic composition and environmental factors characterizing coffee forests in southwest Ethiopia. For. Ecol. Manag. 2008, 255, 2138–2150. [Google Scholar] [CrossRef]
- Ettisa, T.A. Diversity of Vascular Epiphytes along Disturbance Gradient in Yayu Forest, Southwest Oromia, Ethiopia. Master’s Thesis, Addis Ababa University, Addis Ababa, Ethiopia, 2010. [Google Scholar]
- Tafesse, A. Agroecological Zones of South Western Ethiopia. Ph.D. Thesis, University of Trier, Trier, Germany, 1996. [Google Scholar]
- Muleta, D.; Assefa, F.; Nemomissa, S.; Granhall, U. Socioeconomic benefits of shade trees in coffee production systems in Bonga and Yayu Hurumu districts, southwestern Ethiopia: Farmers’ perceptions. Ethiop. J. Educ. Sci. 2011, 7, 39–55. [Google Scholar]
- Senbeta, F.; Gole, T.W.; Denich, M.; Kellbessa, E. Diversity of useful plants in the coffee forests of Ethiopia. Ethnobot. Res. Appl. 2013, 11, 49–69. [Google Scholar] [CrossRef]
- Jemal, O.M.; Callo-Concha, D. Potential of Agroforestry for Food and Nutrition Security of Small-Scale Farming Households: A Case Study from Yayu, Southwestern Ethiopia; Working Paper 161; ZEF, University of Bonn: Bonn, Germany, 2017. [Google Scholar]
- Israel, G.D. Determining Sample Size; Fact Sheet PEOD-6; Florida Cooperative Extension Service, Institute of Food and Agricultural Sciences, University of Florida: Gainesville, FL, USA, 1992. [Google Scholar]
- Mooney, H.F. Glossary of Ethiopian Plant Names; Dublin University Press: Dublin, Germany, 1963. [Google Scholar]
- Mesfin, T.; Hedberg, I. Flora of Ethiopia and Eritrea; National Herbarium, Addis Abeba University: Uppsala, Sweden, 1995; Volume 2, pp. 71–106. [Google Scholar]
- Bekele, A. Useful Trees and Shrubs for Ethiopia: Identification, Propagation and Management for 17 Agroclimatic Zones; World Agroforestry Center: Nairobi, Kenya, 2007. [Google Scholar]
- Teketay, D.; Senbeta, F.; Barklund, P. Edible Wild Plants in Ethiopia; Addis Ababa University Press: Addis Ababa, Ethiopia, 2010. [Google Scholar]
- Mendez, E. An assessment of tropical homegarden as example sustainable local agroforestry systems. In Agroecosystem Sustainability: Developing Practical Strategy; Gliessman, S.R., Ed.; CRC Press: Boca Raton, FL, USA, 2000; pp. 51–66. [Google Scholar]
- Molla, E.L.; Asfaw, Z.; Kelbessa, E.; Van Damme, P. Wild edible plants in Ethiopia: A review on their potential to combat food insecurity. Afr. Focus 2011, 24, 71–121. [Google Scholar]
- Kennedy, G.; Ballard, T.; Dop, M.C. Guidelines for Measuring Household and Individual Dietary Diversity; Food and Agriculture Organization of the United Nations: Rome, Italy, 2011. [Google Scholar]
- Marrugan, A.E. Ecological Diversity and Its Measurement; Chapman & Hall: London, UK, 1988; pp. 154–196. ISBN 978-94-015-7360-3. [Google Scholar]
- Minitab Inc. Minitab 17 Statistical Software. 2013. Available online: www.minitab.com (accessed on 28 August 2015).
- Nair, P.K.R. Classification of agroforestry systems. Agrofor. Syst. 1985, 3, 97–128. [Google Scholar] [CrossRef]
- Kebebew, Z.; Urgessa, K. Agroforestry perspective in land use pattern and farmers coping strategy: Experience from southwestern Ethiopia. World J. Agric. Sci. 2011, 7, 73–77. [Google Scholar]
- Bekele, D.; (Weyira kebele, Elemo, Ethiopia); Bekele, M.; (Environment and Coffee Forest Forum, Yayu, Ethiopia); Bekabil, Z.; (Werebo kebele, Elemo, Ethiopia); Korsa, T.; (Oromiya forest and wild life enterprise, Wutete, Ethiopia). Personal communication, 2014.
- Hora, A.; (Elemo kebele, Elemo, Ethiopia, Ethiopia); Fiqadu, B.; (Beteli Gebecha kebele, Elemo, Ethiopia); Nuri, F.; (Sololo kebele, Qumbabe, Ethiopia); Alebacew, T.; (Environment and Coffee Forest Forum, Yayu, Ethiopia); Bekele, Z.; (Wangene kebele, Hurumu, Ethiopia). Personal communication, 2014.
- Abdata, W.; (Weyira kebele, Elemo, Ethiopia); Alebacew, T.; (Environment and Coffee Forest Forum, Yayu, Ethiopia); Bekele, M.; (local expert, Wutete, Illubabor, Ethiopia); Olana, D.; (Environment and Coffee Forest Forum, Wabo, Ethiopia). Personal communication, 2014.
- Etissa, E.; Gole, T.; Teshome, A.; Abebie, T.G. Horticultural crops diversity and cropping in the smallholders home gardens in the transitional area of Yayu Coffee Forest Biosphere Reserve, Ethiopia. In Proceedings of the Conference on International Research on Food Security, Vienna, Austria, 18–21 September 2016. [Google Scholar]
- Agidie, A.; Ayele, B.; Wassie, A.; Hadgu, K.M.; Aynekulu, E.; Mowo, J. Agroforestry practices and farmers’ perception in Koga watershed, upper blue Nile basin, Ethiopia. Agric. For. 2013, 59, 75–89. [Google Scholar]
- Abebe, T.; Wiersum, K.F.; Bongers, F. Spatial and temporal variation in crop diversity in agroforestry HGs of southern Ethiopia. Agrofor. Syst. 2010, 78, 309–322. [Google Scholar] [CrossRef]
- Negash, A.; Niehof, A. The significance of enset culture and biodiversity for rural household food and livelihood security in southwestern Ethiopia. Agric. Hum. Values 2004, 21, 61–71. [Google Scholar] [CrossRef]
- Asfaw, Z. Conservation and use of traditional vegetables in Ethiopia. In Traditional Vegetables in Africa, Proceedings of the IPGRI International Workshop on Genetic Resources of: Conservation and Use, Nairobi, Kenya, 29–31 August 1995; Guarino, L., Ed.; ICRAF: Nairobi, Kenya, 1997. [Google Scholar]
- Ebert, A.W. Potential of underutilized traditional vegetables and legume crops to contribute to food and nutritional security, income and more sustainable production systems. Sustainability 2014, 6, 319–335. [Google Scholar] [CrossRef]
- Riely, F.; Mock, N.; Cogill, B.; Bailey, L.; Kenefick, E. Food Security Indicators and Framework for Use in the Monitoring and Evaluation of Food Aid Programs; Nutrition Technical Assistance Project (FANTA)/U.S. Agency for International Development (USAID): Washington, DC, USA, 1999.
- Food and Agriculture Organization (FAO). Integrated Food Security and Humanitarian Phase Classification (IPC) Framework; Policy Brief Issue 3; Food and Agriculture Organization: Rome, Italy, 2006. [Google Scholar]
- Addi, A.; Soromessa, T.; Kelbessa, E.; Dibaba, A.; Kefalew, A. Floristic composition and plant community types of Agama Forest, an Afromontane Forest in Southwest Ethiopia. J. Ecol. Nat. Environ. 2016, 8, 55–69. [Google Scholar] [CrossRef]
- Wiersum, K.F. Diversity and change in homegarden cultivation in Indonesia. In Tropical Homegardens; Kumar, B.M., Nair, P.K.R., Eds.; Springer: The Netherlands, 2006; pp. 13–24. [Google Scholar]
- Gebrehiwot, M. Recent Transitions in Ethiopian Homegarden Agroforestry: Driving Forces and Changing Gender Relations. Licentiate Thesis, Swedish University of Agricultural Sciences, Umeå, Swedish, 2013. [Google Scholar]
- Lemenih, M.; Kassa, H.; Kassie, G.T.; Abebaw, D.; Teka, W. Resettlement and woodland management problems and options: A case study from north-western Ethiopia. Land Degrad. Dev. 2014, 25, 305–318. [Google Scholar] [CrossRef]
Figure 1.
Aspects of food security at the interface of land use and food systems.

Figure 2.
Location of the study area and sampled Kebele, with reference to the three zones of the Yayu Coffee Forest Biosphere Reserve and roads. Adapted from Reference [22].
Figure 2.
Location of the study area and sampled Kebele, with reference to the three zones of the Yayu Coffee Forest Biosphere Reserve and roads. Adapted from Reference [22].

Figure 3.
Demographic, socioeconomic, and cultural attributes of sample households in Yayu. * Average ± standard deviation; ** Basic reading and writing skill from non-formal school attendance, e.g., traditional/religious school, etc.
Figure 3.
Demographic, socioeconomic, and cultural attributes of sample households in Yayu. * Average ± standard deviation; ** Basic reading and writing skill from non-formal school attendance, e.g., traditional/religious school, etc.

Figure 4.
Characteristics of predominant agroforestry practices in Yayu. (a) Classification, number, and size of households * Household count, relative proportion; ** size (mean ± SD). (b) Relative frequency of main purpose of outputs per practice. (c) Relative frequency of number of benefits per practice. (d) Relative frequency of the main users per gender per practice. Homegardens (HG), multistorey-coffee-systems (MCS), and multipurpose-trees-on-farmlands (MTF).

Figure 5.
Floristic composition of local agroforestry practices in Yayu, southwestern Ethiopia. (a) Relative proportion per growth habit. (b) Relative proportion per origin. Homegardens (HG), multistorey-coffee-systems (MCS), and multipurpose-trees-on-farmlands (MTF).
Figure 5.
Floristic composition of local agroforestry practices in Yayu, southwestern Ethiopia. (a) Relative proportion per growth habit. (b) Relative proportion per origin. Homegardens (HG), multistorey-coffee-systems (MCS), and multipurpose-trees-on-farmlands (MTF).

Figure 6.
Relative frequency of the 10 most frequent species found in each of the three agroforestry practices in Yayu. Homegardens (HG), multistorey-coffee-systems (MCS), and multipurpose-trees-on-farmlands (MTF).
Figure 6.
Relative frequency of the 10 most frequent species found in each of the three agroforestry practices in Yayu. Homegardens (HG), multistorey-coffee-systems (MCS), and multipurpose-trees-on-farmlands (MTF).

Figure 7.
Income generation in households by (a) main agricultural and non-agricultural activities; (b) homegardens; (c) multistorey-coffee-systems; and (d) multipurpose-trees-on-farmlands.
Figure 7.
Income generation in households by (a) main agricultural and non-agricultural activities; (b) homegardens; (c) multistorey-coffee-systems; and (d) multipurpose-trees-on-farmlands.

Table 1.
Sampled kebele, altitudes, and size.
| Kebele | Altitudinal Range (m.a.s.l) | Sample Size (n) |
|---|---|---|
| Wabo | 1570 to 1624 | 27 |
| Wutete | 1565 to 1672 | 45 |
| Sololo | 1624 to 1688 | 43 |
| Wangene | 1562 to 1890 | 44 |
| Weyira | 1789 to 1973 | 26 |
| Werebo | 1725 to 1892 | 45 |
| Beteli Gebecha | 1754 to 1819 | 45 |
| Elemo | 1906 to 1981 | 25 |
Table 2.
Count, percentage, average (± standard deviation) number per household, and richness per household of species of 10 plant uses and service categories in three AFPs and p-value for one-way ANOVA test among categories.
Table 2.
Count, percentage, average (± standard deviation) number per household, and richness per household of species of 10 plant uses and service categories in three AFPs and p-value for one-way ANOVA test among categories.
| Use and Service Category | Count of Total Species (%) | Average Number of Species/HH (±SD) | Average Richness/HH (±SD) | |||||||
|---|---|---|---|---|---|---|---|---|---|---|
| All | HG | MCS | MTF | HG | MCS | MTF | HG | MCS | MTF | |
| Food | 44 (34.6) | 42 (46.6) | 0 (0) | 10 (18.2) | 7.8 A (±2.9) | 0.0 F (±0.0) | 1.8 BC (±1.0) | 1.6 A (±0.5) | 0.0 F (±0.0) | 0.9 B (±0.4) |
| Spices, condiments, and other food and beverage additives | 9 (7.1) | 10 (10.2) | 0 (0) | 0 (0) | 0.6 FG (±0.9) | 0.0 F (±0.0) | 0.0 E (±0.0) | 0.1 FG (±0.2) | 0.0 F (±0.0) | 0.0 D (±0.0) |
| Stimulants | 2 (1.6) | 2 (2.3) | 2 (1.5) | 1 (1.8) | 1.2 EFG (±0.7) | 1.0 EF (±0.0) | 0.1 DE (±0.4) | 0.2 EF (±0.1) | 0.4 E (±0.1) | 0.1 D (±0.2) |
| Fodder | 41 (32.3) | 27 (29.5) | 31 (46.2) | 29 (52.7) | 2.7 CD (±2.7) | 3.6 BC (±3.4) | 2.0 B (±2.1) | 0.6 C (±0.5) | 1.3 C (±1.1) | 1.0 B (±0.8) |
| Fuel | 52 (40.9) | 27 (29.5) | 46 (69.2) | 36 (65.5) | 4.5 B (±2.1) | 7.1 A (± 3.6) | 2.9 A (±1.9) | 0.9 B (±0.4) | 2.5 A (±0.5) | 1.4 A (±0.5) |
| Timber | 34 (26.8) | 17 (18.2) | 31 (46.2) | 24 (43.6) | 1.5 EF (±1.1) | 3.4 C (±2.6) | 0.9 CD (±1.1) | 0.3 DE (±0.2) | 1.1 C (±0.6) | 0.4 C (±0.4) |
| Non-timber tree products | 10 (7.9) | 5 (4.5) | 10 (13.8) | 3 (5.5) | 0.1 G (±0.4) | 0.3 F (±0.7) | 0.1 DE (±0.3) | 0.0 G (±0.1) | 0.1 F (±0.2) | 0.01 D (±0.1) |
| Shade trees for coffee | 26 (20.5) | 20 (21.6) | 25 (36.9) | 0 (0) | 2.0 CDE (±1.7) | 4.7 B (±2.2) | 0.0 E (±0.0) | 0.4 D (±0.3) | 1.6 B (±0.5) | 0.0 D (±0.0) |
| Other services, e.g., live fences, windbreaks, etc. | 18 (14.2) | 16 (17) | 15 (21.5) | 12 (21.8) | 1.9 DE (±1.2) | 2.0 DE (±1.4) | 0.9 CD (±0.9) | 0.4 D (±0.3) | 0.7 D (±0.5) | 0.5 C (±0.4) |
| Medicine | 21 (16.5) | 21 (22.7) | 9 (12.3) | 7 (12.7) | 3.1 C (±1.67) | 2.1 D (±1.1) | 0.4 DE (±0.8) | 0.6 C (±0.3) | 0.8 D (±0.3) | 0.2 CD (±0.3) |
| p-value | <0.01 | <0.01 | <0.01 | <0.01 | <0.01 | <0.01 | ||||
Categories with at least one similar superscript do not significantly differ at least at α = 0.05; HH = household; HG = homegardens; MCS = multistorey-coffee-systems; MTF = multipurpose-trees-on-farmlands.
Table 3.
Count, percentage, average (± standard deviation) number per household, and richness per household of species of three edibility categories in three agroforestry practices (AFPs), and a ‘potential’ to ’active’ ratio in each practice.
Table 3.
Count, percentage, average (± standard deviation) number per household, and richness per household of species of three edibility categories in three agroforestry practices (AFPs), and a ‘potential’ to ’active’ ratio in each practice.
| Edibility Category/Ratio | Count of Total Food Species (%) | Average Number of Species/HH (±SD) | Average Richness/HH (±SD) | |||||||
|---|---|---|---|---|---|---|---|---|---|---|
| All | HG | MCS | MTF | HG | MCS | MTF | HG | MCS | MTF | |
| Total edible | 80 (62.9) | 63 (71.6) | 22 (33.8) | 25 (45.5) | 9.3 (± 3.6) | 2.7 (±1.4) | 2.3 (±1.3) | 2.6 (±0.6) | 0.9 (±0.3) | 1.2 (±0.4) |
| Potentially edible | 25 (19.7) | 11 (12.5) | 21 (32.3) | 14 (25.6) | 0.3 (±0.6) | 1.7 (±1.4) | 0.4 (±0.7) | 0.1 (±0.2) | 0.6 (±0.4) | 0.2 (±0.3) |
| Active food | 55 (44) | 52 (59.1) | 1 (1.5) | 11 (20.0) | 9.0 (±3.4) | 1.0 (±0.0) | 1.9 (±1.1) | 2.5 (±0.6) | 0.4 (±0.1) | 0.96 (±0.4) |
| Ratio potential: active food | 0.5 | 0.2 | 21.0 | 1.3 | 0.0 (±0.1) | 1.7 (±1.4) | 0.3 (±0.5) | 0.0 (±0.1) | 1.7 (±1.4) | 0.3 (±0.5) |
HH = household; HG = homegardens; MCS = multistorey-coffee-systems; MTF = multipurpose-trees-on-farmlands.
Table 4.
Count, percentage, average (± standard deviation) number per household, and richness per household of species of 10 food groups in three AFPs and p-value for one-way ANOVA test among food groups.
Table 4.
Count, percentage, average (± standard deviation) number per household, and richness per household of species of 10 food groups in three AFPs and p-value for one-way ANOVA test among food groups.
| Food Group | Count of Active Food Species (%) | Average Number of Species/HH (± SD) | Average Richness/HH (± SD) | |||||||
|---|---|---|---|---|---|---|---|---|---|---|
| All | HG | MCS | MTF | HG | MCS | MTF | HG | MCS | MTF | |
| Cereals | 6 (13.6) | 3 (7.1) | 0.0 (0.0) | 6 (54.5) | 0.1 E (±0.4) | 0.0 (±0.0) | 1.6 A (±0.8) | 0.1 D (±0.1) | 0.0 (±0.0) | 1.2 A (±0.3) |
| White roots and tubers | 6 (13.6) | 6 (14.3) | 0.0 (0.0) | 0 (0.0) | 1.5 B (±1.2) | 0.0 (±0.0) | 0.0 (±0.0) | 0.4 BC (±0.3) | 0.0 (±0.0) | 0.0 B (±0.0) |
| Vitamin A-rich vegetables and tubers | 4 (9.1) | 4 (9.5) | 0.0 (0.0) | 0 (0.0) | 0.5 DE (±0.6) | 0.0 (±0.0) | 0.0 (±0.0) | 0.2 D (±0.2) | 0.0 (±0.0) | 0.0 B (±0.0) |
| Dark green leafy vegetables | 4 (9.1) | 4 (9.5) | 0.0 (0.0) | 0 (0.0) | 1.0 C (±0.7) | 0.0 (±0.0) | 0.0 (±0.0) | 0.3 C (±0.2) | 0.0 (±0.0) | 0.0 B (±0.0) |
| Other vegetables | 5 (11.4) | 5 (11.9) | 0.0 (0.0) | 0 (0.0) | 0.5 DE (±0.7) | 0.0 (±0.0) | 0.0 (±0.0) | 0.1 D (±0.2) | 0.0 (±0.0) | 0.0 B (±0.0) |
| Vitamin A-rich fruits | 3 (6.8) | 3 (7.1) | 0.0 (0.0) | 0 (0) | 1.2 BC (±0.7) | 0.0 (±0.0) | 0.0 (±0.0) | 0.4 C (±0.2) | 0.0 (±0.0) | 0.0 B (±0.0) |
| Other fruits | 12 (27.3) | 12 (28.6) | 0.0 (0.0) | 0 (0) | 2.4 A (±1.4) | 0.0 (±0.0) | 0.0 (±0.0) | 0.8 A (±0.4) | 0.0 (±0.0) | 0.0 B (±0.0) |
| Legumes, nuts, seeds | 5 (11.4) | 5 (11.9) | 0.0 (0.0) | 4 (36.4) | 0.2 DE (±0.4) | 0.0 (±0.0) | 0.1 B (±0.4) | 0.1 D (0.1) | 0.0 (±0.0) | 0.1 B (±0.2) |
| Sweets | 1 (2.3) | 1 (2.4) | 0.0 (0.0) | 0 (0) | 0.1 E (±0.3) | 0.0 (±0.0) | 0.0 (±0.0) | 0.0 D (±0.1) | 0.0 (±0.0) | 0.0 B (±0.0) |
| Spices, condiments, and beverages | 9 (20.5) | 9 (21.4) | 1.0 (1.5) | 0 (0) | 0.7 CD (±0.9) | 1.0 (±0.0) | 0.0 (±0.0) | 0.6 B (±0.3) | 1.0 (±0.0) | 0.1 B (±0.2) |
| p-value | <0.01 | N.A | <0.01 | <0.01 | N.A | <0.01 | ||||
Food groups with at least one similar superscript do not significantly differ at least at α = 0.05; N.A = test not applicable; HH = household; HG = homegardens; MCS = multistorey-coffee-systems; MTF = multipurpose-trees-on-farmlands.
Table 5.
Count, percentage, average (± standard deviation) number per household, and richness per household species of three marketability categories in three AFPs and p-value for one-way ANOVA test among categories.
Table 5.
Count, percentage, average (± standard deviation) number per household, and richness per household species of three marketability categories in three AFPs and p-value for one-way ANOVA test among categories.
| Marketability Category | Species Count (%) | Average Number of Species/HH (±SD) | Average Species Richness/HH (±SD) | |||||||
|---|---|---|---|---|---|---|---|---|---|---|
| All | HG | MCS | MTF | HG | MCS | MTF | HG | MSC | MTF | |
| Actively-marketed species | 50 (39.4) | 47 (53.4) | 1 (1.5) | 9 (16.4) | 7.6 A (±2.8) | 1 B (±0.0) | 2.1 A (±1.1) | 2.3 A (±0.6) | 0.4 B (±0.1) | 1.1 A (±0.4) |
| Passively-marketed species | 18 (14.2) | 13 (14.7) | 11 (16.9) | 10 (18.1) | 2.7 B (±1.6) | 1.3 B (±0.9) | 0.4 B (±0.6) | 0.5 B (±0.3) | 0.5 B (±0.3) | 0.2 C (±0.3) |
| Non-marketed species | 59 (46.5) | 28 (31.8) | 53 (81.5) | 36 (65.5) | 2.2 B (±1.6) | 5.7 A (±3.6) | 1.5 C (±1.5) | 0.6 B (±0.4) | 1.9 A (±0.7) | 0.7 B (±0.5) |
| p-value | <0.01 | <0.01 | <0.01 | <0.01 | <0.01 | <0.01 | ||||
Categories with similar superscript do not significantly differ at least at α = 0.05; HH = household; HG = homegardens; MCS = multistorey-coffee-systems; MTF = multipurpose-trees-on-farmlands.
© 2018 by the authors. Licensee MDPI, Basel, Switzerland. This article is an open access article distributed under the terms and conditions of the Creative Commons Attribution (CC BY) license (http://creativecommons.org/licenses/by/4.0/).
Share and Cite
MDPI and ACS Style
Jemal, O.; Callo-Concha, D.; Van Noordwijk, M. Local Agroforestry Practices for Food and Nutrition Security of Smallholder Farm Households in Southwestern Ethiopia. Sustainability 2018, 10, 2722. https://doi.org/10.3390/su10082722
AMA Style
Jemal O, Callo-Concha D, Van Noordwijk M. Local Agroforestry Practices for Food and Nutrition Security of Smallholder Farm Households in Southwestern Ethiopia. Sustainability. 2018; 10(8):2722. https://doi.org/10.3390/su10082722
Chicago/Turabian StyleJemal, Omarsherif, Daniel Callo-Concha, and Meine Van Noordwijk. 2018. "Local Agroforestry Practices for Food and Nutrition Security of Smallholder Farm Households in Southwestern Ethiopia" Sustainability 10, no. 8: 2722. https://doi.org/10.3390/su10082722
Note that from the first issue of 2016, this journal uses article numbers instead of page numbers. See further details here.