Article

Assessing the Greenhouse Gas Mitigation Effect of Removing Bovine Trypanosomiasis in Eastern Africa

1
Land Economy, Environment and Society Group, SRUC, Edinburgh EH9 3JG, UK
2
Department of Zoology, Environmental Research Group Oxford (ERGO), South Parks Road, Oxford OX1 3PS, UK
3
AP Consultants, 22 Walworth Enterprise Centre, Duke Close, Andover SP10 5AP, UK
4
The World Bank Group, Agriculture and Food Global Practice, 1818 H Street N.W., Washington, DC 20433, USA
5
Animal Production Systems Group, Wageningen University, P.O. Box 338, Wageningen 6708, The Netherlands
6
Food and Agriculture Organization of the United Nations (FAO), Sub-regional Office for Eastern Africa, CMC Road, P.O. Box 5536, Addis Ababa, Ethiopia
7
Food and Agriculture Organization of the United Nations (FAO), Animal Production and Health Division, Viale delle Terme di Caracalla, 00153 Rome, Italy
*
Author to whom correspondence should be addressed.
Sustainability 2018, 10(5), 1633; https://doi.org/10.3390/su10051633
Submission received: 25 April 2018 / Revised: 14 May 2018 / Accepted: 15 May 2018 / Published: 18 May 2018
(This article belongs to the Special Issue Environmentally Sustainable Livestock Production)

Abstract

:
Increasing the production of meat and milk within sub-Saharan Africa should provide significant food security benefits. However, greenhouse gas (GHG) emissions represent a challenge, as cattle production in the region typically has high emissions intensity (EI), i.e., high rates of GHG emissions per unit of output. The high EI is caused by the relatively low production efficiencies in the region, which are in turn partly due to endemic cattle diseases. In theory, improved disease control should increase the efficiency and decrease the emissions intensity of livestock production; however quantitative analysis of the potential GHG mitigation effects of improved disease control in Africa is lacking. This paper seeks to respond to this by using a hybrid modelling approach to quantify the production and emissions effects of removing trypanosomiasis from East African cattle production systems. The emissions are quantified for each cattle production system using an excel version of GLEAM, the Food and Agriculture Organization’s Global Livestock Environmental Assessment Model. The results indicate that removing trypanosomiasis leads to a reduction in the emissions intensity per unit of protein produced of between 0% and 8%, driven mainly by the increases in milk yields and cow fertility rates. Despite the limitations, it is argued that the approach provides considerable scope for modelling the GHG impacts of disease interventions.

1. Introduction

In developing countries growing populations, rising incomes, and urbanization are translating into increasing demand for livestock products. Livestock is now one of the fastest growing sub-sectors of agriculture: a doubling of demand for animal-source foods is expected within developing countries between 2000 and 2050, and a 70% increase for the world as a whole [1,2]. However, it has been noted that: “Meeting this demand in a way that is socially desirable and environmentally sustainable is a major challenge facing agriculture today” [3] (p. 9).
A major part of the challenge is the emission of greenhouse gases (GHGs) arising from livestock production. It has been estimated through life-cycle assessments that the global livestock sector accounts for around 14.5% of all anthropogenic GHG emissions, with cattle meat and milk accounting for 65% of the livestock emissions [4]. If increased demand is to be met without significant increases in GHG emissions, then ways of reducing the emissions intensity (EI, i.e., the amount of GHG emitted per unit of commodity produced) need to be identified and deployed.
Improving livestock health is potentially a cost-effective way of increasing production, while reducing EI. The World Organisation for Animal Health (OIE) has estimated that: “at the worldwide level, average losses due to animal diseases are more than 20%” [5]. The main direct farm level losses arise from mortality (including involuntary culling), a lowering of the efficiency of the production process, and reduction in output quantity or quality [6]. Reducing the disease burden can lead to significant reductions in EI by, for example, improving the feed conversion ratio of individual animals or changing herd structures (i.e., the proportion of each animal cohort in the herd). However, disease reduction is not yet widely recognised as a mitigation measure [7]. In fact, the Intergovernmental Panel on Climate Change Fifth Assessment Report [8] does not specifically mention livestock health, and current evidence is limited to a small number of studies of European livestock [9,10,11,12,13].
Understanding the impacts of improving cattle health on production and emissions is of particular relevance in sub-Saharan Africa (SSA), given that cattle are the predominant source of livestock GHGs [4], growth in demand between 2000 and 2030 is forecast to be 113% for beef and 107% for dairy products [1] and that the EIs for bovine milk and meat tend to be higher in SSA than in other regions [14]. The higher EIs are largely due to inefficiencies in converting natural resources into edible animal products, with relatively high feed conversion ratios and high energy (methane) and nitrogen (nitrous oxide) losses occurring along the process [4]. In these systems, efficiency is closely and positively related to productivity and key factors such as: milk yield, growth rates, fertility and mortality rates, and ages at slaughter. These, in turn, are a function of the genetics, feeding, management, environmental stress, and health status of the animals.
While various studies have investigated the effects of improved genetics, feeding, and management on livestock [15], evidence on the mitigation potential of improving health is scarce. It has been noted that, “Simulation results seem promising, but reliable quantitative estimates of the mitigation potential of improved health will require more research” [16] (p. 111). This paper seeks to respond to this by using a hybrid modelling approach to quantify the production and emissions effects of removing trypanosomiasis from East African cattle systems.
Trypanosomiasis is a disease caused by tsetse-transmitted parasitic protozoans, and is endemic in a tsetse-infested belt that spans across 9 million square kilometres in SSA [17]. With its animal form (called “nagana”) and its human form (also known as “sleeping sickness”), trypanosomiasis is widely considered as one of the main threats to human and livestock health and agricultural production, and, as such, a major constraint to rural development and poverty alleviation in SSA [18,19]. It has been identified as “the most economically important disease of livestock in sub-Saharan Africa” [20]. African trypanosomiasis, in its various forms, can cause a wide range of symptoms, including anaemia, wasting, loss of condition, abortion, and reduced milk production. Progression can lead either to death or to a chronic form. For many decades chemotherapy has been the mainstay of trypanosomiasis control, but in recent years resistance has emerged as a growing concern [21].
This paper presents a method for quantifying the effect of trypanosomiasis treatment on the production and EI of a range of cattle production systems. It quantifies the effect of trypanosomiasis treatment on the EI in East Africa. The limitations of the method are discussed and the wider challenges in quantifying the GHG effects of livestock health improvement are explored.

2. Materials and Methods

2.1. Study Area

The study focuses on East Africa, which is one of the most important dairy development zones in SSA. The specific area of study is the Inter-Governmental Authority on Development (IGAD) region, an area of over 5.2 million km2 that comprises the countries of Djibouti, Eritrea, Ethiopia, Kenya, Somalia, South Sudan, Sudan, and Uganda [22]. Just under half (45%) of the cattle in SSA are reported to be in the IGAD region [23].

2.2. Cattle Production Systems

The cattle in the study area were classified into twelve distinct production systems (Table 1). These refined cattle systems were based on three main livestock systems (i.e., pastoral, agro-pastoral and mixed farming) [24], which were further disaggregated based on the prevalence of work oxen (used for traction) and milk yields of dairy cattle (which have varying degrees of exotic genetic material, usually of the main European dairy breeds that have been widely adopted in high value smallholder dairy production in Eastern Africa).
The high milk yield dairy systems consist of cattle with varying degrees of non-indigenous genetic material derived primarily from the main European dairy breeds, principally Ayrshire, Friesian and Channel Island breeds—Guernsey and Jersey. In the other systems indigenous breeds predominate, i.e., zebu cattle and related crossbreeds [26]. The eastern African indigenous zebu cattle breeds are conventionally divided into three main groups all of which are represented in the countries covered by this study: the Large East African Zebu (including the Boran breeds of Ethiopia, Kenya and Somalia, the Samburu, Karmajong Zebu, Orma Boran and Butana and Kenana of Sudan) the Small East African Zebu (including the Maasai, Abyssinian Shorthorned Zebu, Kamba of Kenya and Serere and Kyoga in the tsetse-infested areas of Uganda) and the Sanga cattle (including the Ankole of Uganda, Danakil cattle of Ethiopia and the Nuer and Dinka of Sudan). Further information is available on the Domestic Animal Genetic Resources Information System (DAGRIS) [27]. More detail on the production systems and how they were defined is available in [28].
Data on the use of work oxen were obtained from in-country informants, reports, census data, livelihood studies [24] and other sources [29,30,31,32,33]. Combining these sources across the region by administrative area, and studying data on herd compositions, enabled three broad categories of oxen use to be distinguished depending on the proportion of cattle used for draught: low (≤10%), medium (>10% and <20%), and high (≥20%).
The proportion of cattle modelled in each system is given in Table 2. The most recent statistics report a total cattle population in the study area of 144.5m in 2016 [23].

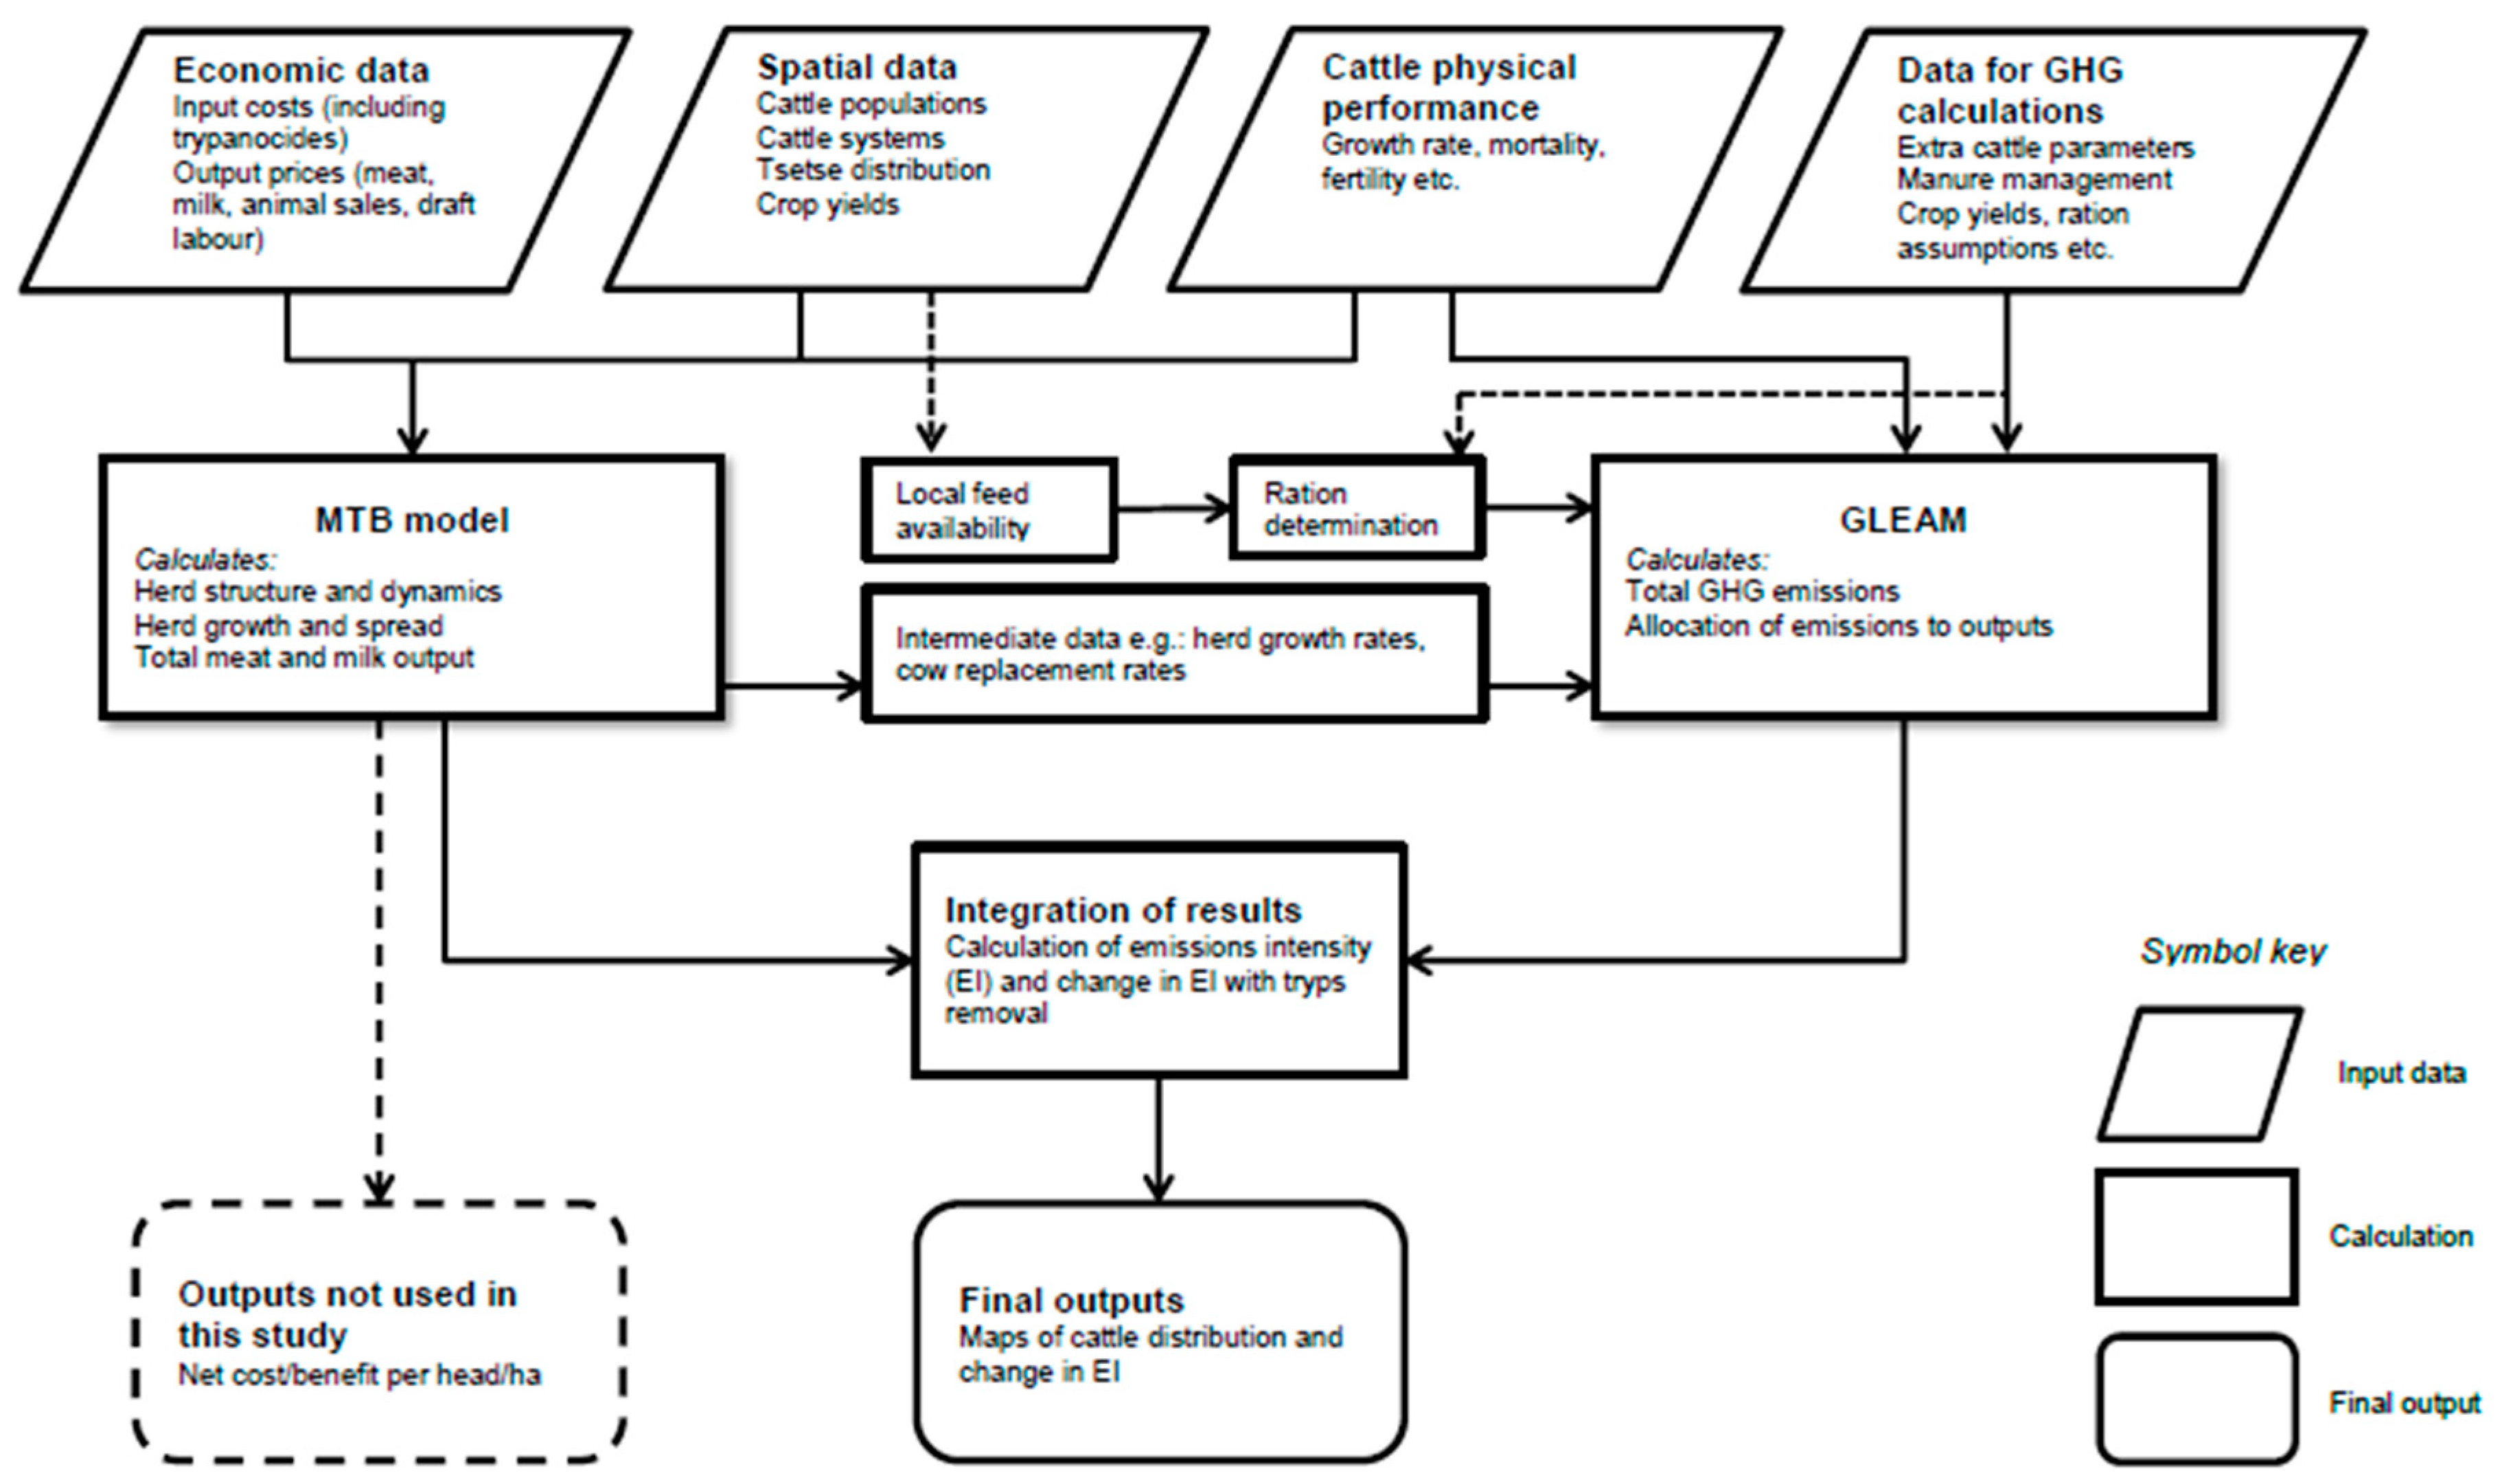
2.3. Modelling Approach

This study builds on previous work, which quantified the economic benefits of removing trypanosomiasis in East African cattle using the “Mapping the Benefits” (MTB) model [25,28,34]. In this study, the MTB model is combined with an excel version of GLEAM (the UN-FAO’s Global Livestock Environmental Assessment Model, [35]) which calculates the GHG emissions arising from production. A schematic diagram of the relationship between the models is provided in Figure 1.

2.3.1. Harmonising the GLEAM and MTB Herd Models

At the heart of both GLEAM and MTB are herd models, which determine the herd structure and the number of animals entering and leaving the herd each year. The two herd models perform some of these calculations in different ways. For example, they have different animal cohorts (adult female, replacement female, etc.) and different ways of calculating the number of calves born. Therefore, the herd models had to be harmonised, i.e. adjusted until they produced the same herd structure and dynamics. This was achieved by comparing the results given by the two herd models with the same input data, and adjusting the calculations in GLEAM until the models were producing the same results for all 12 production systems.

2.3.2. Estimating the Effects of Trypanosomiasis Treatment over 20 Years

The herd structure and dynamics, and the output of meat and milk were calculated for the situations with and without trypanosomiasis using the MTB model [34] and applied to cattle population density maps, projected using the herd growth and additional spread models. Regional tsetse maps at 1 km resolution were used [36], complemented by 5km resolution continental datasets [37] where 1 km resolution maps were unavailable. Cattle population densities were available from a series of 1km resolution datasets created within the framework of the IGAD Land Policy Initiative (LPI) using the most recent national statistics available for the period 2000–2005. The mapping methods were those developed to generate the Gridded Livestock of the World [38].
GLEAM was used to calculate the (meat and milk) production, the total greenhouse gas emissions arising from that production and the EI of each commodity for each of the cattle systems with and without trypanosomiasis. The meat production in live weight was calculated by multiplying the number of cattle exiting the herd as offtake, i.e., sold or slaughtered, by the average live weight of each cohort (i.e., adult female, calves etc.). The live weight was then converted to edible protein by multiplying it by (a) the carcass weight: live weight percentage (50–55% depending on the cohort); (b) the bone-free meat: carcass weight percentage (75%) and finally (c) the protein content of bone-free meat (18%). The edible protein from milk was determined by multiplying the net milk production (milk secreted minus milk suckled) by the protein content of milk (3.3%). Emissions are only allocated to edible protein and draft, however cattle perform other functions. It has been estimated that 16% of the emissions should be allocated to the manure, financing and dowry functions of cattle [39]. Doing so would reduce the EI but would have a negligible impact on the change in EI arising from trypanosomiasis removal.
The main GHG-producing activities were included, i.e., the production of feed and fertiliser, the digestion of feed and the excretion of undigested organic matter (Table 3 provides an explanation of the emission categories). The emissions of methane and nitrous oxide were converted to their carbon dioxide equivalent using the Intergovernmental Panel on Climate Change (IPCC) global warming potentials of 25 and 298, respectively. The system boundary of the study is “cradle to farm-gate”, i.e., emissions arising from the production of feed and other inputs are included but post-farm gate emissions occurring during processing and distribution are not included; however in the systems studied post-farm gate emissions are likely to represent a small proportion of the total emissions [4]. CO2 emissions and sequestration in short-term carbon cycles (i.e., respiration and photosynthesis) are not included, in keeping with the IPCC guidelines ([40], Volume 4, p. 10.7). Furthermore, it is assumed that the treatment (chemotherapy) has negligible additional GHG emissions arising (from drug manufacture and distribution) given the small doses involved. Other treatment strategies, such as the removal of tsetse habitats, could lead to significant additional GHG emissions.

2.3.3. Parameterising the Cattle Production Systems

The values for the baseline situation (i.e., with trypanosomiasis) in Table 4 were derived from various sources. A few sources provided information relating to all production systems [32,41], others for the pastoralist systems [42,43,44], for the agro-pastoral and mixed farming systems [29,31,45,46,47,48,49,50] and for the high milk yield “grade” dairy cattle kept in a separate system alongside indigenous cattle in the agro-pastoral and mixed farming systems [51,52,53].
The effects of trypanosomiasis treatment on performance were estimated based on a review of longitudinal and cross-sectional studies comparing the productivity observed in infected and uninfected individual cattle or whole herds, under conditions of both high and low trypanosomiasis challenge [33,45,54,55,56,57,58,59,60,61]. The review gave a range of values for the effect of the disease. In this study, it was assumed that disease treatment would have an effect between the middle and lower end of the range reported in studies. These (arguably conservative) assumptions were made in order to correct for the fact that the studies reviewed tended to be conducted in areas where the disease impact was relatively severe.
Similar impacts for trypanosomiasis were applied across the production systems (Table 4). This table also shows that baseline cattle mortality rates observed in Eastern Africa tend to be high. This reflects not just the presence of trypanosomiasis, but also of tick-borne diseases, especially East Coast fever [60] and, locally, very high stocking rates leading to nutritional stress, especially in parts of the Ethiopian highlands [62].

2.3.4. Ration Composition and Nutritional Value

The ration (i.e., the livestock feed) for each system was determined using a combination of approaches. The proportions of the main feed material categories (i.e., forage, crop residues and concentrates) were estimated based on literature, expert knowledge, and unpublished surveys, while the percentage of each crop residue (maize, millet and sorghum stover, wheat, rice and barley straw, and sugar cane tops) were calculated for each cell, based on how much of each crop is produced within the cell. Crop data was extracted for livestock production zones from Spatial Production Allocation Model (SPAM) V3r6 2000 datasets [63]. The nutritional value of the ration was calculated by multiplying the nutritional value of each feed material by its proportion in the ration. The nutritional values of individual feed materials were based on [14,64], the Sub-Saharan Africa Feed Composition Database [65], and Feedipedia [66,67].

2.3.5. Estimating Uncertainty

Calculation of the emission intensities involves parameters that are subject to some degree of uncertainty. A Monte Carlo simulation was undertaken in order to quantify the uncertainty ranges in the results. Parameters were included in the simulation that were (a) likely to have a significant influence on the most important emissions categories (those contributing more than twenty percent of the total emissions, i.e., enteric CH4 and feed N2O) and (b) had a high degree of uncertainty or inherent variability. An initial list of parameters was generated and reviewed. Based on the review, some parameters were excluded, e.g., the emission factors (EFs) for indirect N2O were removed because volatilisation and leaching only account for a small % of feed N2O emissions, and a previous study had found the contribution to variance of these EFs to be very small (<2%) [14] (p. 81). The distributions and variability of the parameters are given in Table 5. The variability of forage digestibility is based on the standard deviation of the digestibility of Napier grass (Pennisetum purpureum) reported in [67]. The variability of cow milk yield, cow fertility and calf death rates were based on the ranges reported in [32]. The Monte Carlo was performed in Model Risk with 5000 runs for each of 12 systems with and without trypanosomiasis.

3. Results

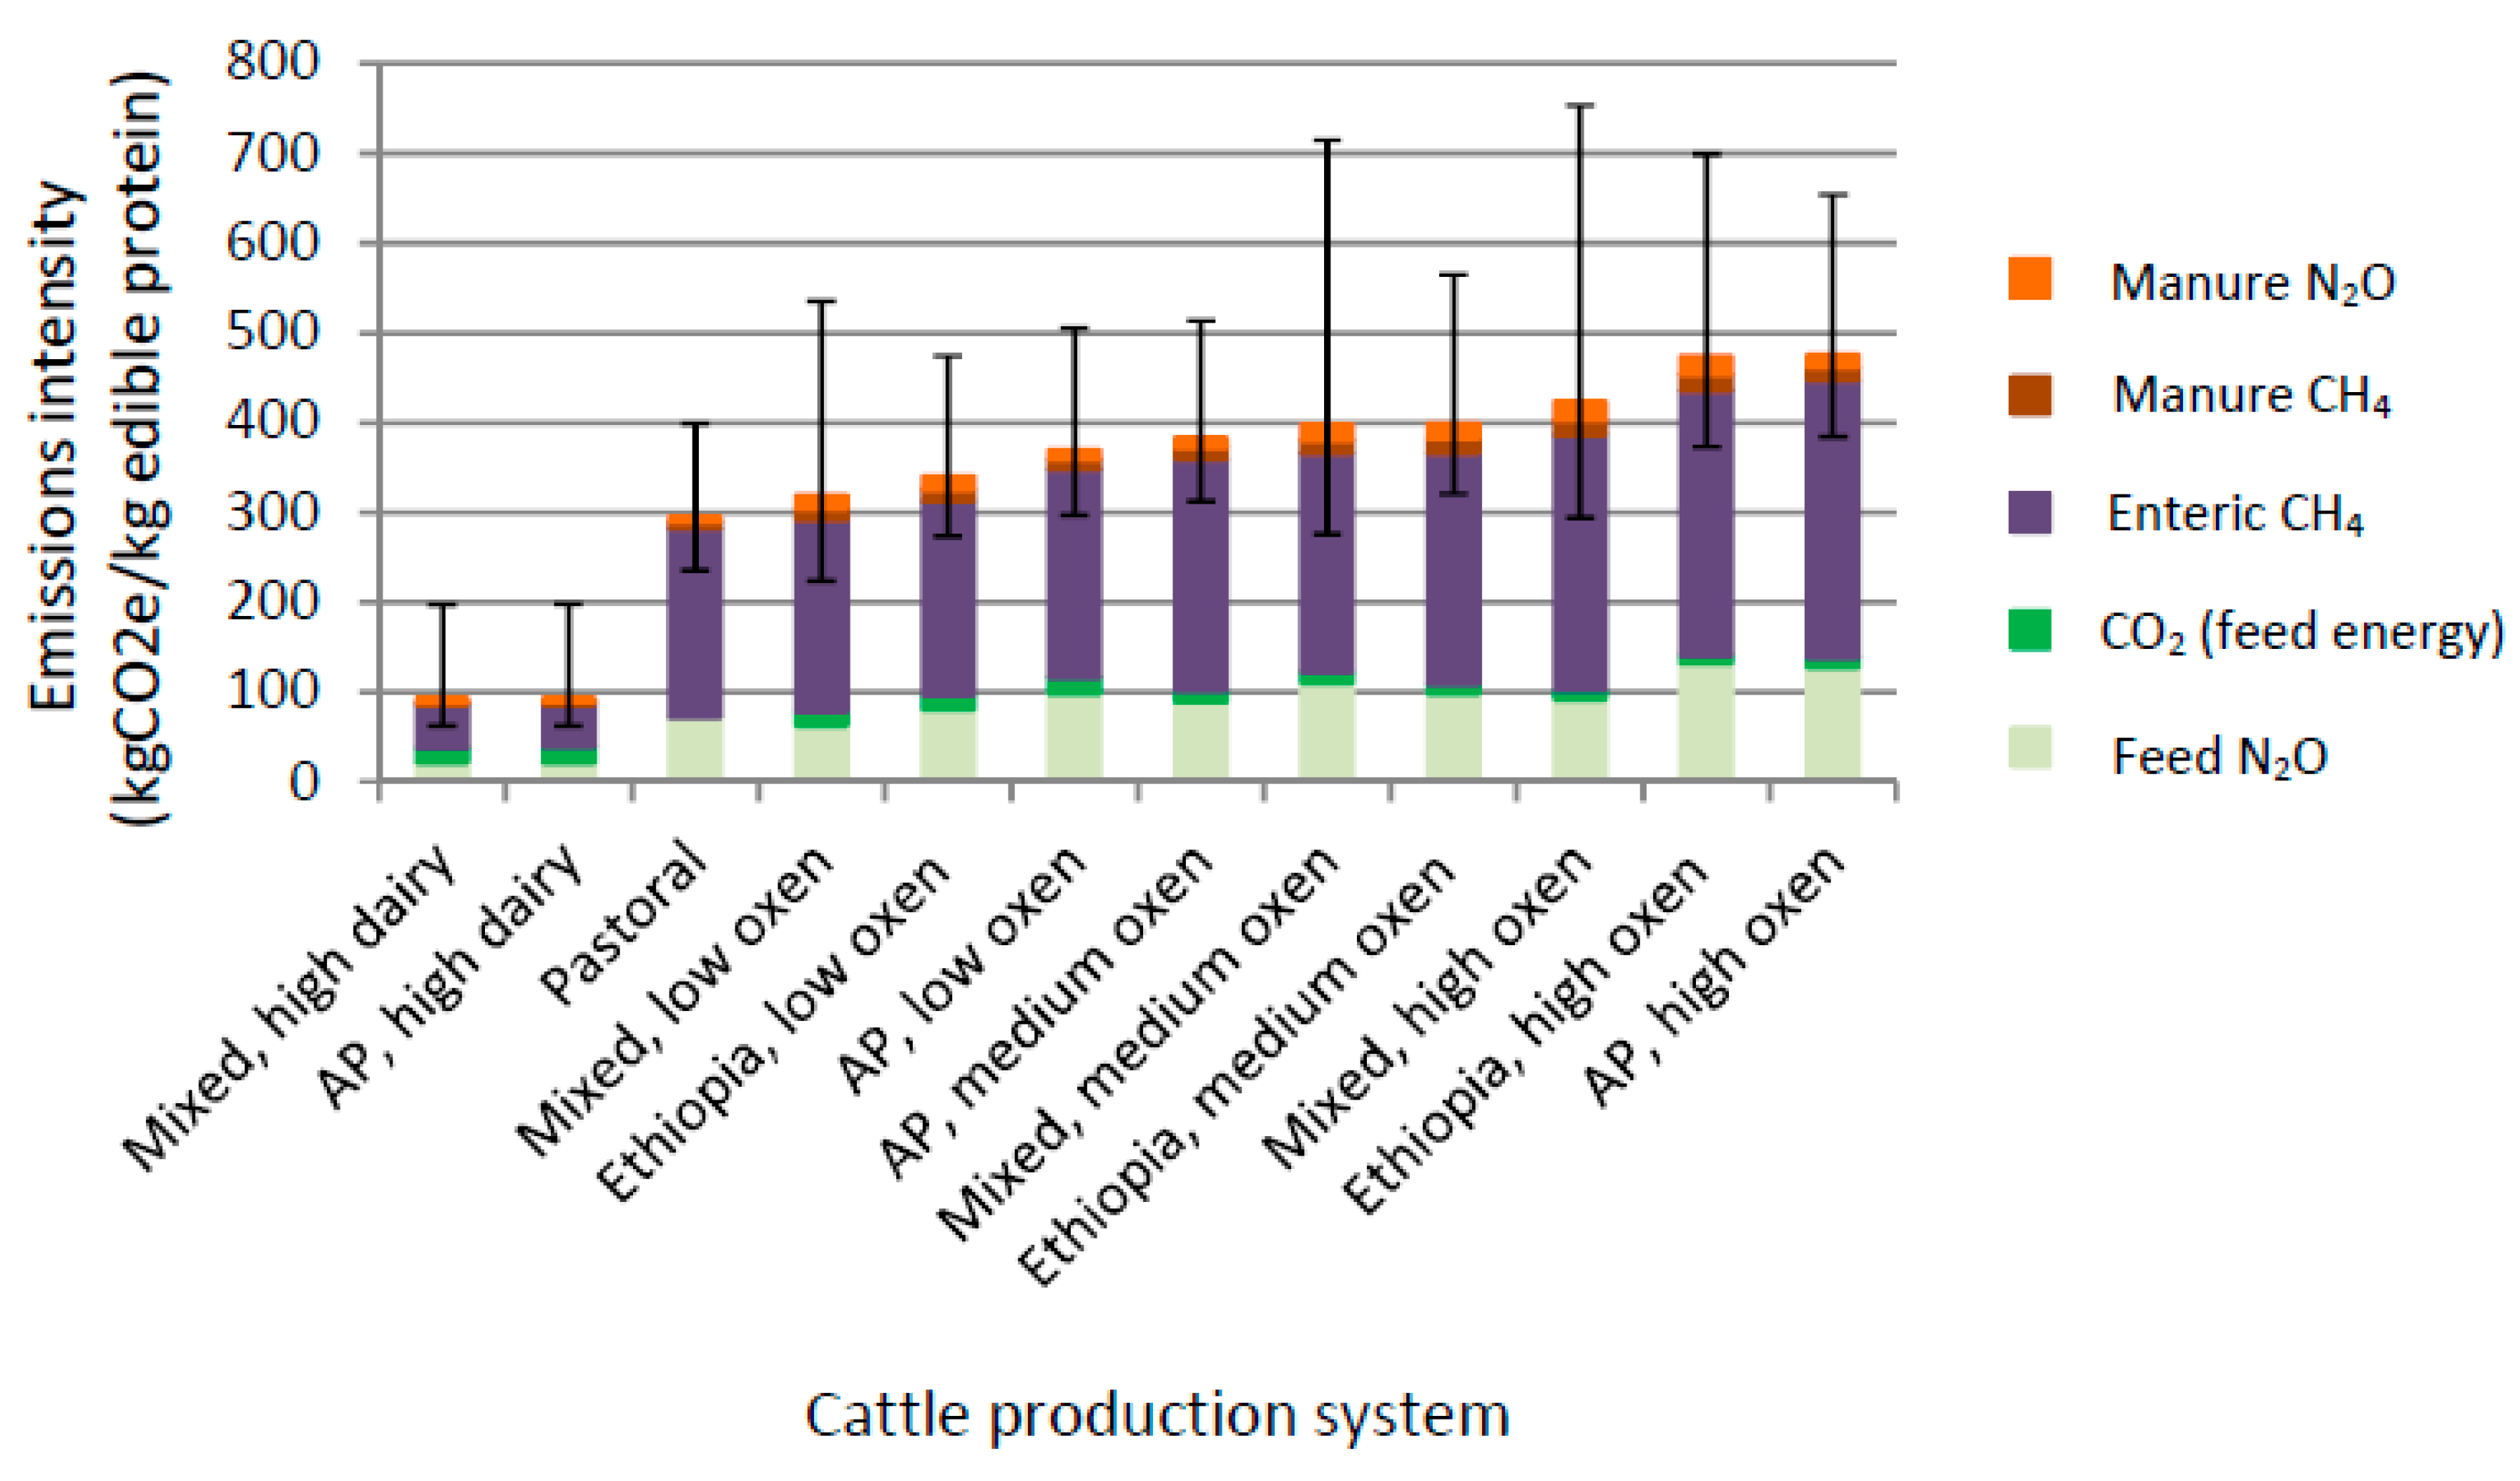
3.1. Baseline Emissions with Trypanosomiasis

The EI by system and emission category is shown in Figure 2. The main sources of emissions are (a) enteric methane and (b) feed nitrous oxide, i.e., the nitrous oxide arising from the deposition of organic N on pasture (either directly via the urine of grazing animals, or via the spreading of the collected manure of housed cattle). The high (milk yield) dairy systems have much lower EI than other systems due to their higher productivity (where productivity is defined as the mass of meat and milk produced by a system each year compared to the live weight mass of the cattle in the system). Differences between the other systems are less marked but also largely driven by productivity. The relationship between productivity and EI for the 12 systems with and without trypanosomiasis is shown in Figure 3. This trend is consistent with other studies [68,69] which found a similar relationship between productivity and EI in cattle systems, i.e., large (but reducing) marginal decreases in EI with increasing productivity in low productivity systems, such as those in East Africa.

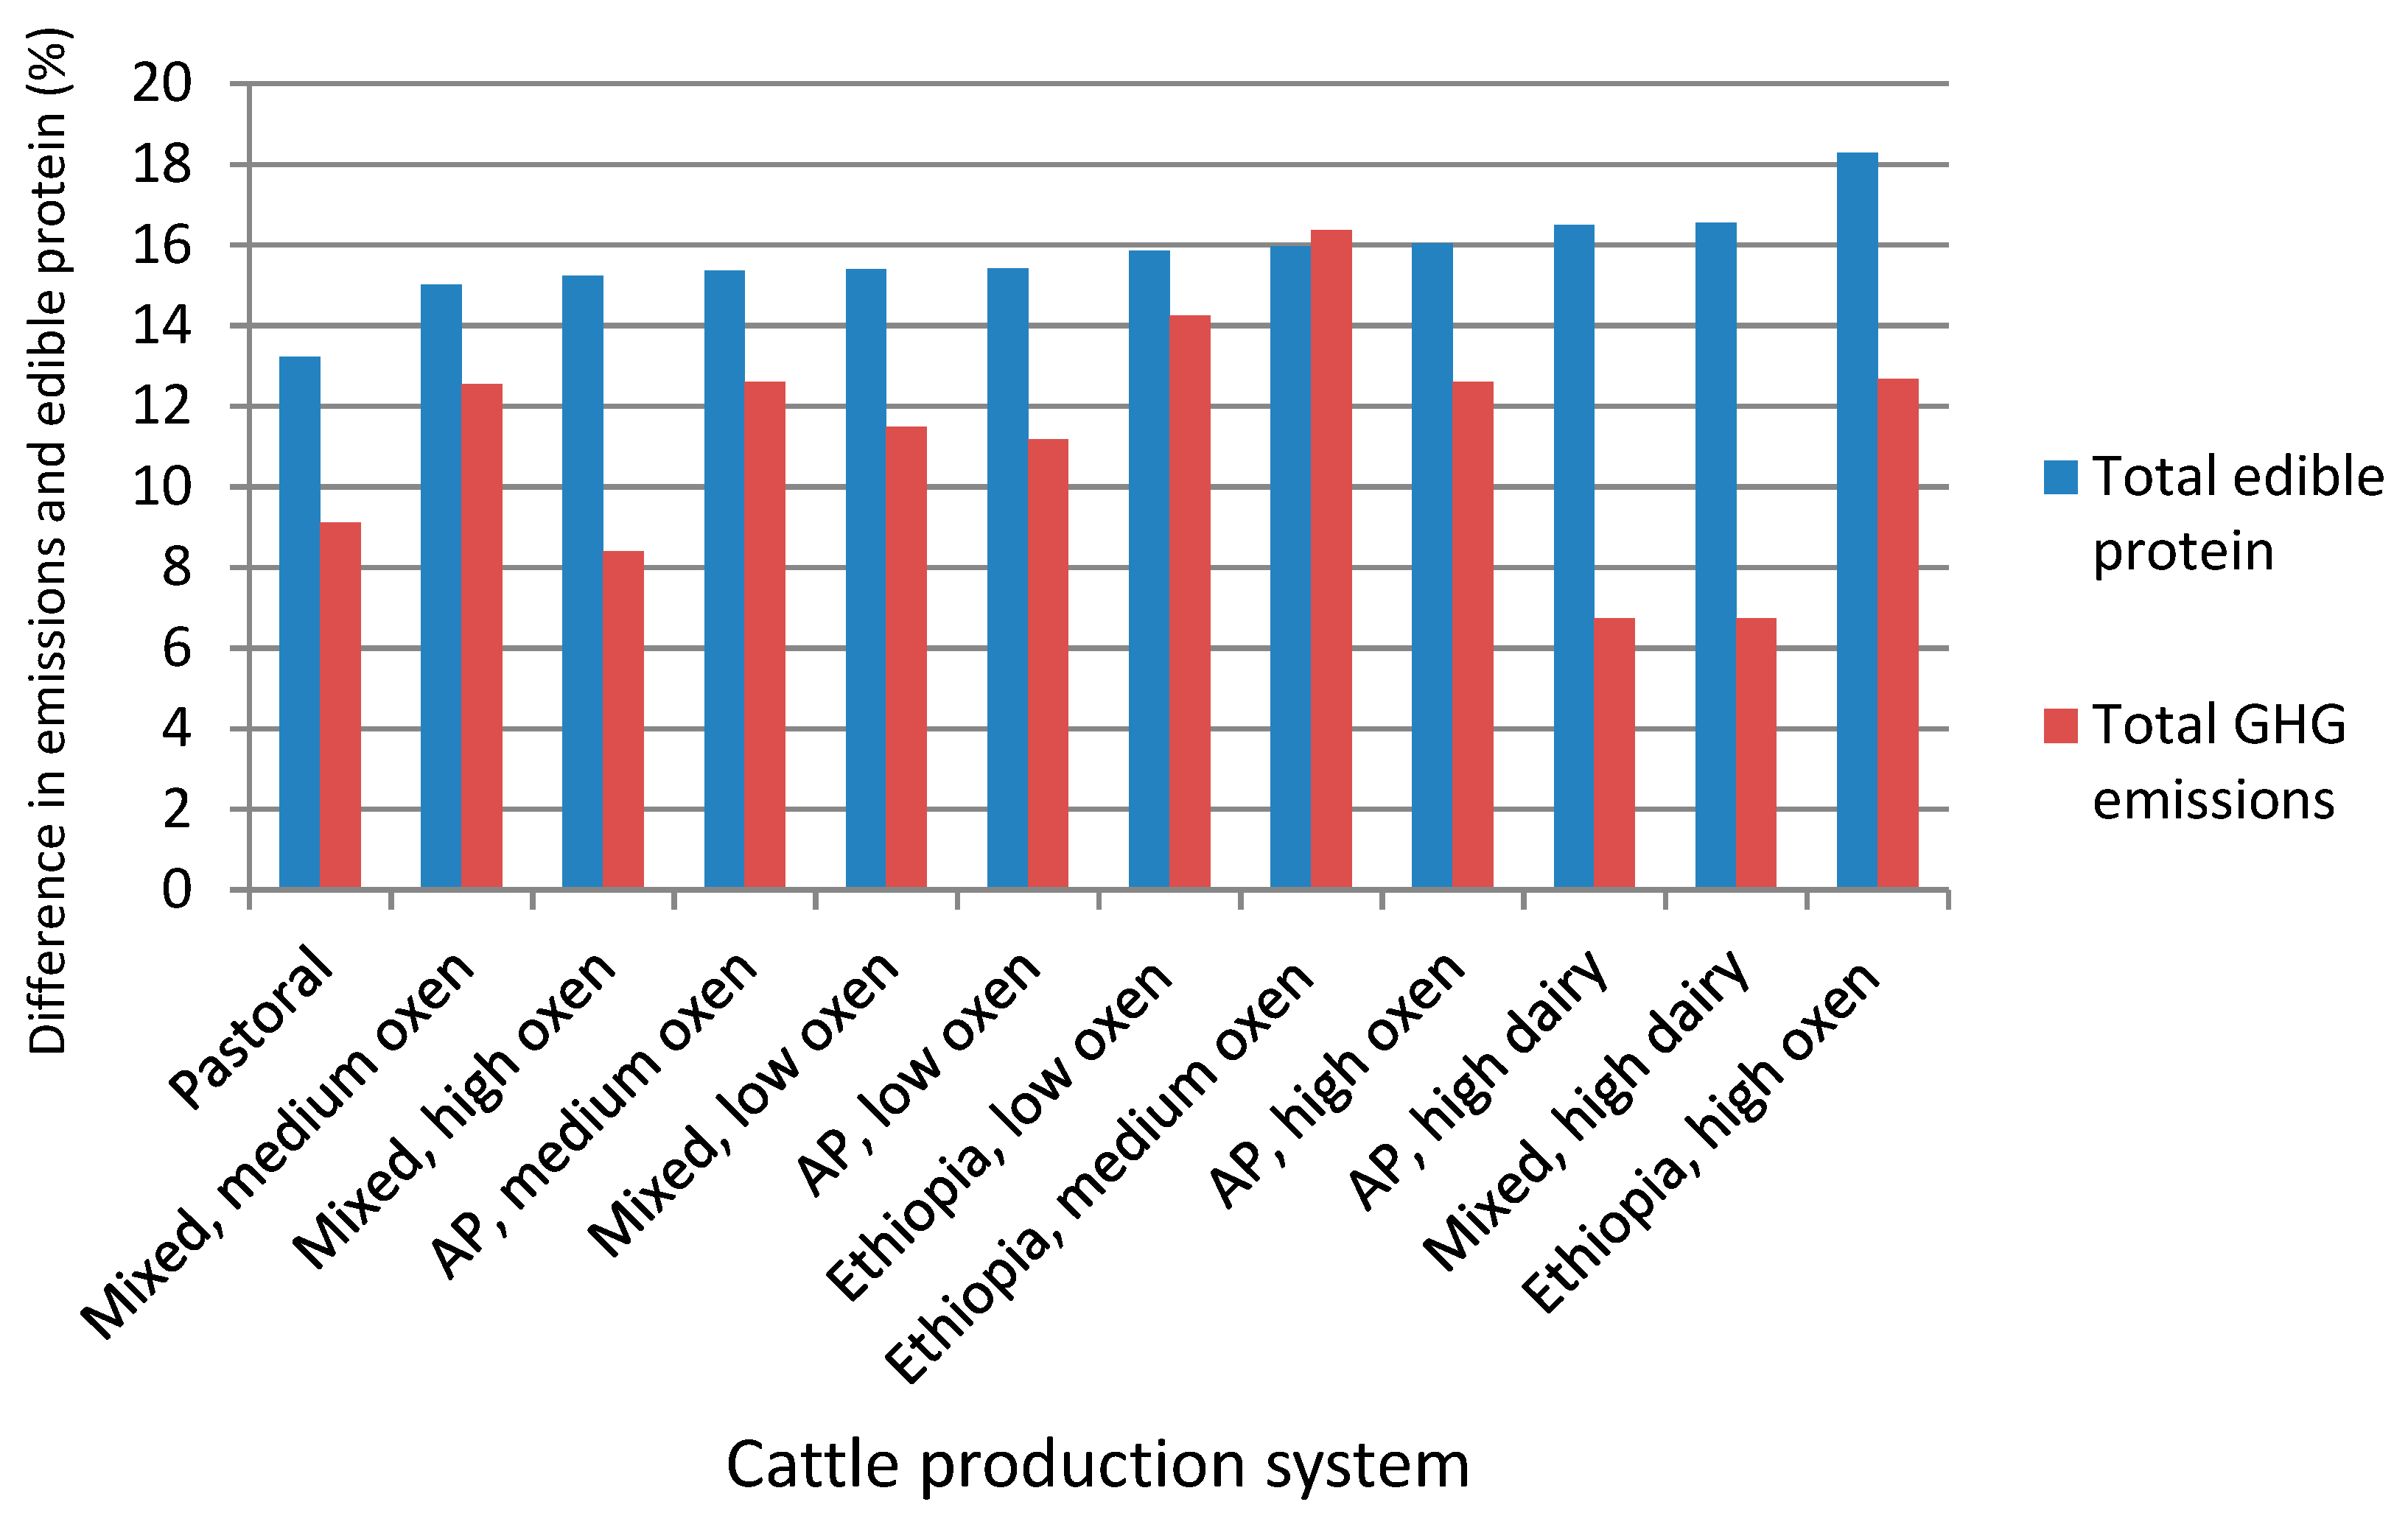
3.2. Effect of Disease Treatment

Treatment of trypanosomiasis leads to increases in production and emissions across all the systems. Figure 4 shows the increases once the full effects of disease treatment have been achieved. Production increases relatively more than emissions leading to reductions in EI of 0% to 8%. The reductions in EI are significant in eleven of the twelve systems and are closely (inversely) correlated with the change in productivity (Figure 5).

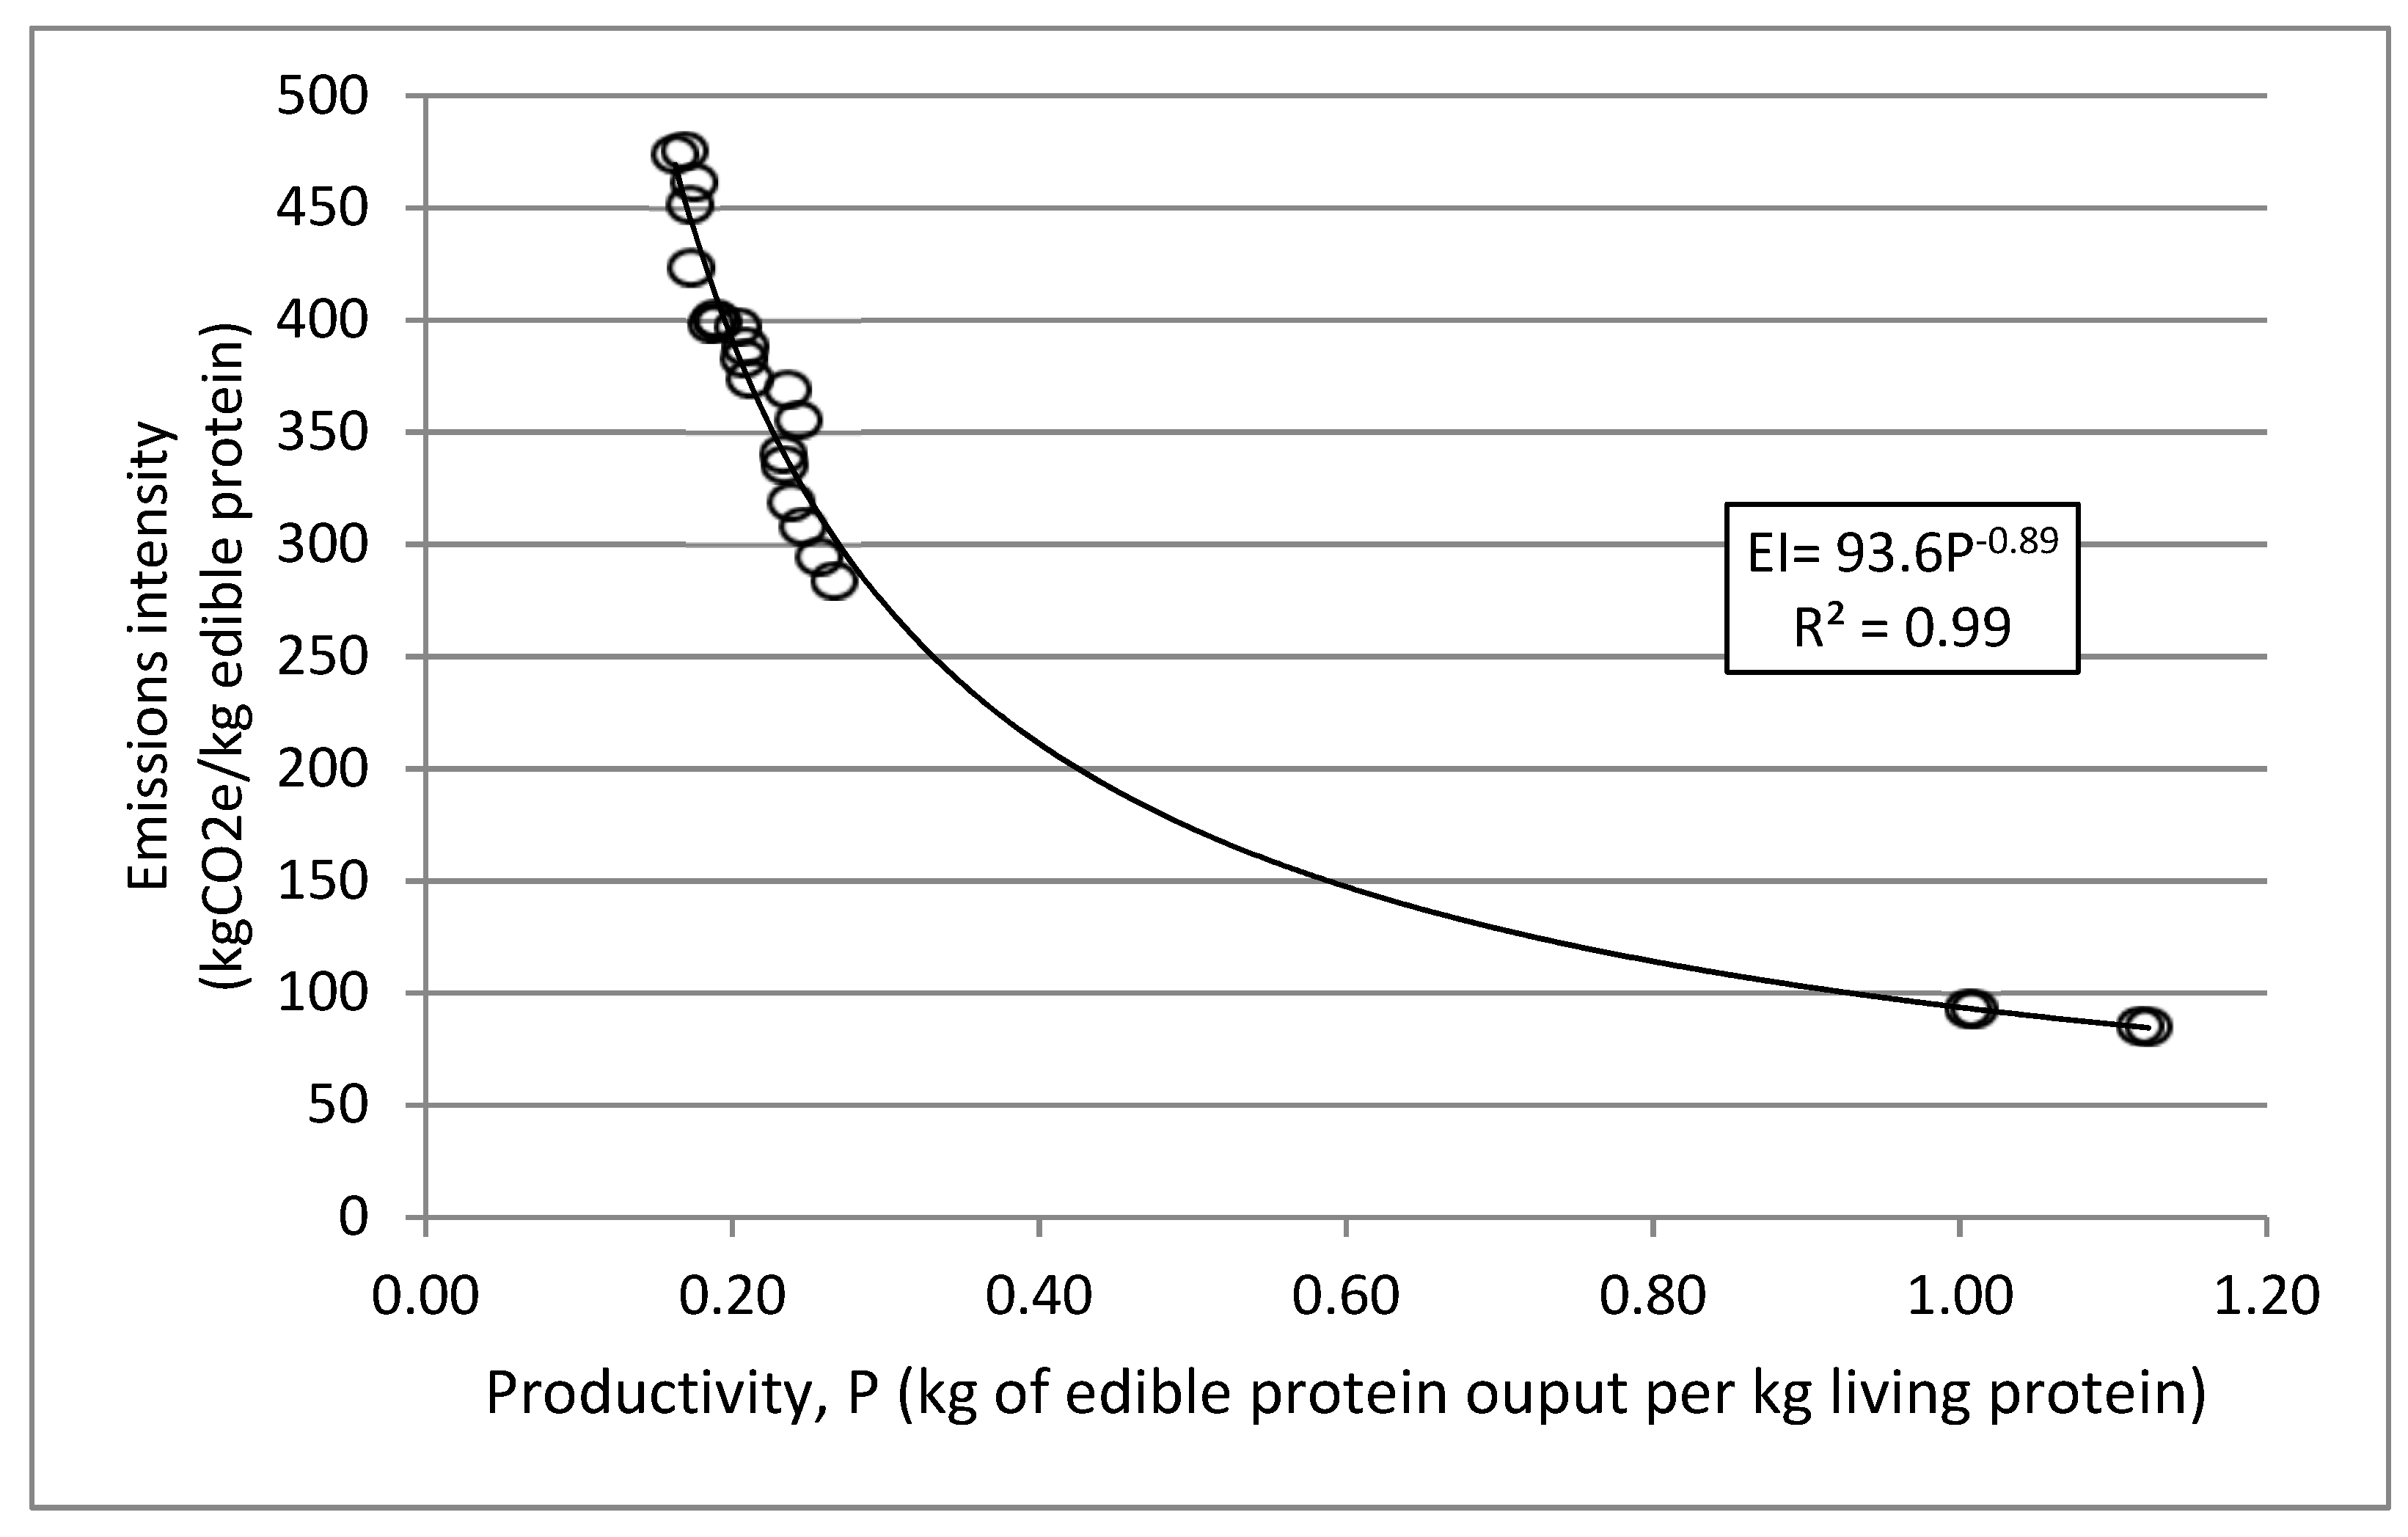
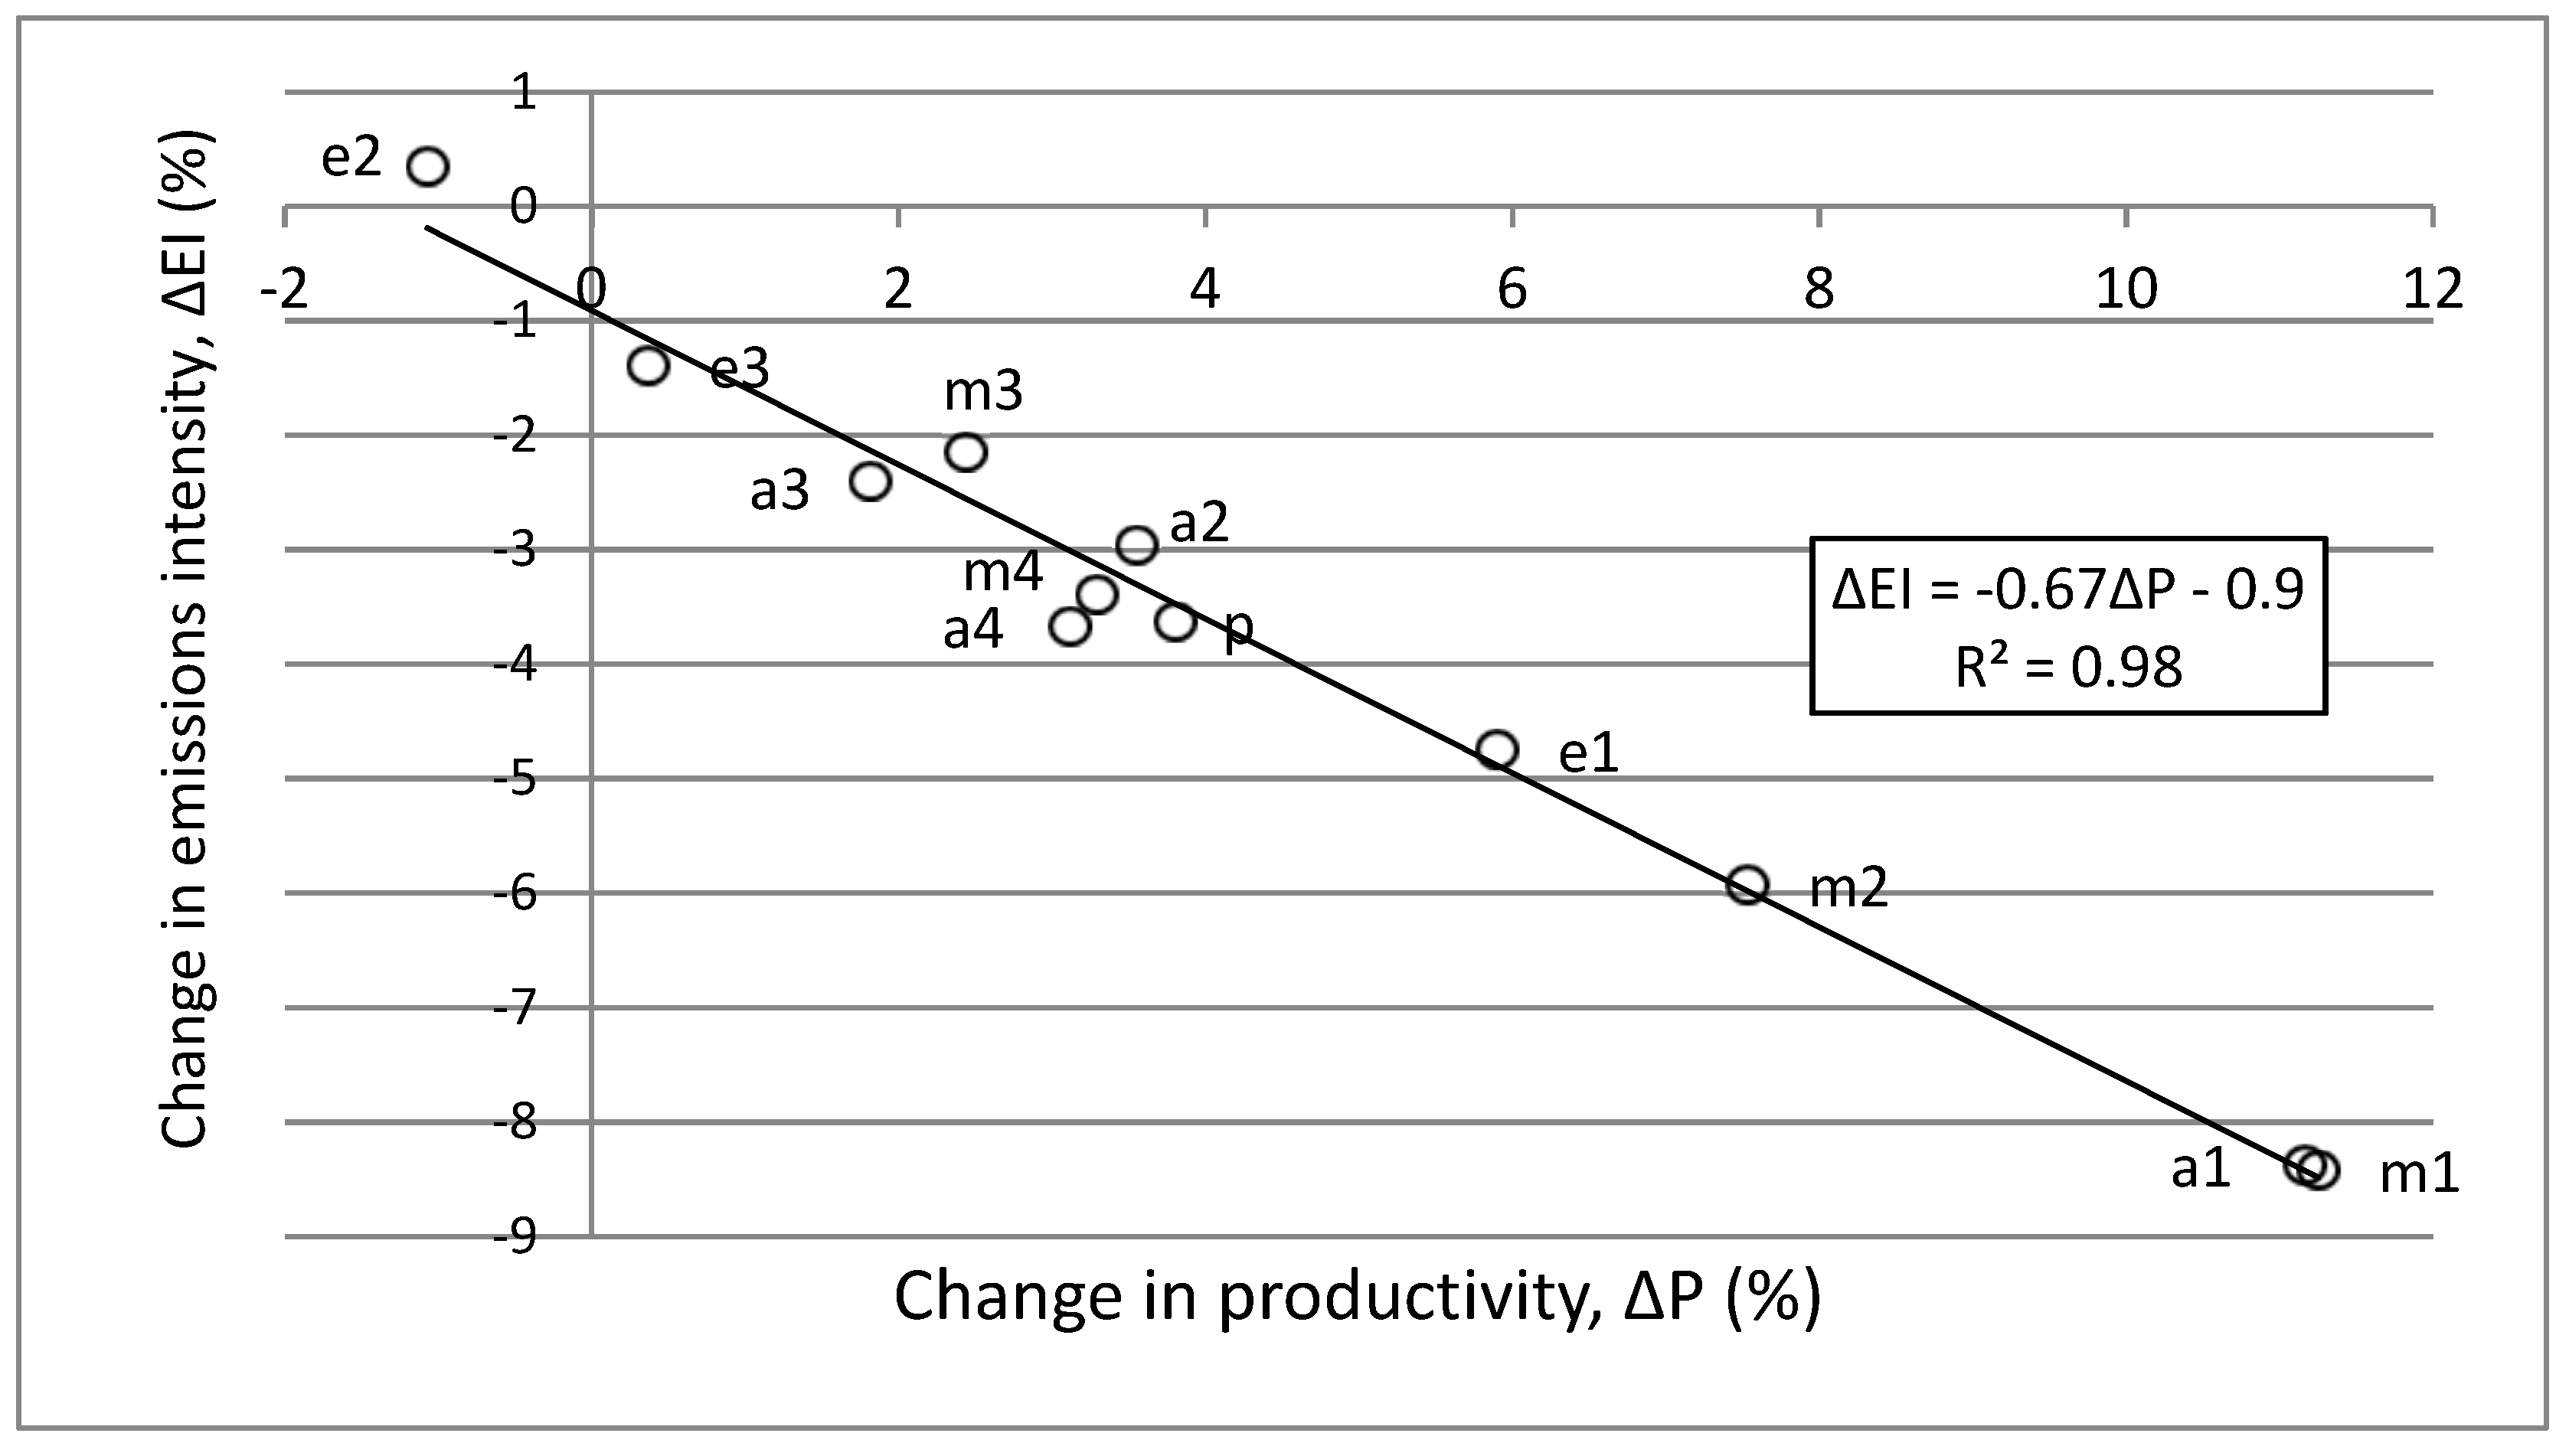
3.3. Factors driving the Changes in EI

A sensitivity analysis was undertaken in order to investigate the influence of different parameters on EI (Table 6). The EI is highly sensitive to changes in the digestibility of forage, and to the enteric methane emission factor (Ym), however, both of these remain constant with changes in disease status. Increased milk yield leads to a decrease in EI as a greater percentage of the lactating cow’s feed energy requirement is used for the production of edible outputs (i.e., lactation) rather than non-productive activity (e.g., maintenance or locomotion), [68]. The increased cow fertility rate leads to a higher proportion of the adult females producing edible outputs. This is important as while non-lactating adult females produce lower emissions than lactating ones, they produce no edible outputs (i.e., milk or liveweight gain) so their EI is effectively infinite. The increased fertility rate also changes the herd structure, but this has a limited effect on EI. EI is less sensitive to changes in calf mortality than it is to changes in cow milk yield or fertility, however the effect of calf mortality on EI depends on the fate of the dying calves, i.e., what proportion enter the human food chain and are therefore counted as production. Finally, increasing the use of draft oxen leads to increases EI in some systems. Draft animals have a high EI as they produce no/limited edible output, so even when a proportion of the emissions are allocated to labour, they still have a higher EI than younger, faster growing cattle.

4. Discussion

While the results are consistent with the expectation that improving health is likely to lead to reductions in EI, the validity of the results depends on the input assumptions and the method used to perform the calculations. The approach developed in this study allows multiple effects of a disease to be quantified. The MTB model enables herd growth and livestock movement over time to be quantified. The use of a herd model in GLEAM enables disease impacts on parameters that affect the herd structure to be modelled, e.g. death rates, fertility rates, replacement rates, and offtake rates. The IPCC tier 2 approach [40] to calculating livestock emissions used in GLEAM enables disease impacts on parameters that affect the production and emissions of the individual animal to be modelled, e.g., milk yield, animal growth rates, activity level and ration. However, the approach requires further development in order to capture some potentially important effects, such as the impact of disease status on ration quality.
The results are expressed in terms of the functional unit “kg of CO2e per kg of edible protein at the farm gate”, and therefore don’t include post-farm emissions or take into account post-farm losses. While post-farm emissions are likely to represent a small % of the total emissions, losses can make significant differences to the EI, and may vary between different production systems. The functional unit also assumes that: (a) 1 kg of milk protein is equivalent to 1 kg of meat protein and (b) production of edible outputs is the only reason for keeping cattle, which are simplifications. Although some of the emissions are allocated to draught power, none are allocated to other outputs (such as manure) or the less tangible values that cattle may have, such as social value and increased resilience of their owners [39]. While the choice of functional unit means that care needs to be taken when making comparisons of the EI between systems, none of the limitations noted above would affect the change in EI arising from treatment of trypanosomiasis.
As noted in [25] “data on livestock productivity (fertility, mortality, milk yields and output of draught power) were mostly obtained from a limited number of in-depth studies in specific localities. As the large number of references testifies, cattle systems in the study region have been much studied and there is enough information to paint a good general picture, and to cross-check and validate. However, although trypanosomosis has been relatively well researched, there remains a need for more specific studies on this disease’s impact”. This is particularly the case with draught animals. FAO have developed a geospatial database [70] that should improve understanding of trypanosomiasis prevalence in Africa.

5. Conclusions

The treatment of trypanosomiasis in East African cattle systems could lead to reductions in EI of between 0 and 8%, depending on the system. EI is closely related to productivity, and the largest reductions in EI are in those systems experiencing the largest increases in productivity, i.e., the higher (milk yield) dairy systems. However, when making inter-system comparisons, it should be borne in mind that in some systems cattle perform functions in addition to producing meat and milk.
The approach employed in this study could, in principle, be used to model the impact of other important diseases in SSA (such as foot and mouth disease), if their effects can be adequately described in terms of the model parameters. However, in order to produce valid results, the main direct effects of the disease need to be captured by the model. This is potentially challenging given the lack of data on prevalence and impact for many diseases. While it may be possible to partially fill gaps through the analysis of existing datasets (such as abattoir records), some diseases have important effects that are not routinely recorded or readily measured (for example they may alter feed intake, the efficiency of digestion or energy partitioning) and may require bespoke studies. A second challenge is capturing the indirect effects of disease control. For example, disease treatment would lead to increased livestock populations which could, depending on how this increase is managed, lead to overstocking and thus reduced feed availability and/or quality.
The reduction of EI represents an external benefit of disease control, i.e., it is a benefit not normally factored into farm management or policy decisions. In order to achieve the economically optimal level of disease control, such externalities need to be quantified and included in decision making, alongside other costs and benefits. Given the difficulty of measuring agricultural GHG emissions directly, it is suggested that modelling approaches, such as the one outlined in this paper, have an important contribution to make to the development of disease control strategies.

Author Contributions

Conceptualization, M.M. and T.R.; Data curation, M.M., W.W., and A.S.; Formal analysis, M.M. and A.S.; Funding acquisition, T.R.; Investigation, V.E., W.W., A.S., P.G., G.C., and R.M.; Methodology, M.M.; Writing—original draft, M.M.

Acknowledgments

This project was funded by the International Livestock Research Institute under CCAFS, the CGIAR Research Program “Climate Change, Agriculture and Food Security”. The authors are grateful to the UN FAO for permission to use GLEAM in this study. The authors would like to acknowledge the support of the Scottish Government Strategic Research Programme, Theme 2: Productive and Sustainable Land Management and Rural Economies. The support of the Government of Italy through the FAO Project “Improving food security in sub-Saharan Africa by supporting the progressive reduction of tsetse-transmitted trypanosomiasis in the framework of the NEPAD” (codes GTFS/RAF/474/ITA and GCP/RAF/502/ITA) is also acknowledged.

Conflicts of Interest

The authors declare no conflict of interest.

References

  1. Robinson, T.P.; Pozzi, F. Mapping Supply and Demand for Animal-Source Foods to 2030; Animal Production and Health Working Paper No. 2; Food and Agriculture Organisation of the United Nations: Rome, Italy, 2011. [Google Scholar]
  2. Alexandratos, N.; Bruinsma, J. World Agriculture towards 2030/2050. The 2012 Revision. Global Perspective Studies Team; ESA Working Paper No. 12-03; Food and Agriculture Organization of the United Nations: Rome, Italy, 2012. [Google Scholar]
  3. Pingali, P.; McCullough, E. Drivers of change in global agricultural livestock systems. In Livestock in a Changing Landscape: Drivers, Consequences and Responses; Steineld, H., Mooney, H.A., Schneider, F., Neville, L.E., Eds.; Island Press: Washington, DC, USA, 2010. [Google Scholar]
  4. Gerber, P.J.; Steinfeld, H.; Henderson, B.; Mottet, A.; Opio, C.; Dijkman, J.; Falcucci, A.; Tempio, G. Tackling Climate Change through Livestock—A Global Assessment of Emissions and Mitigation Opportunities; Food and Agriculture Organization of the United Nations: Rome, Italy, 2013. [Google Scholar]
  5. Vallat, B. Feeding the World Better by Controlling Animal Diseases. Available online: http://www.oie.int/for-the-media/editorials/detail/article/feeding-the-world-better-by-controlling-animal-diseases/ (accessed on 23 May 2014).
  6. Elliot, J. Animal health and productivity in the EU—Current and emerging issues. In Proceedings of the FACCE–JPI Workshop: Animal Health/Animal Diseases and GHG Mitigation, Madrid, Spain, 21 May 2014. [Google Scholar]
  7. MacLeod, M.; Eory, V.; Gruère, G.; Lankoski, J. Cost-Effectiveness of Greenhouse Gas Mitigation Measures for Agriculture: A Literature Review, OECD Food; Agriculture and Fisheries Papers, No. 89; OECD Publishing: Paris, France, 2015. [Google Scholar]
  8. Stocker, T.F.; Qin, D.; Plattner, G.-K.; Tignor, M.; Allen, S.K.; Boschung, J.; Nauels, A.; Xia, Y.; Bex, V.; Midgley, P.M. IPCC Climate Change 2013: The Physical Science Basis. Contribution of Working Group I to the Fifth Assessment Report of the Intergovernmental Panel on Climate Change; Cambridge University Press: Cambridge, UK; New York, NY, USA, 2013; p. 1535. [Google Scholar]
  9. Hospido, A.; Sonesson, U. The environmental impact of mastitis: A case study of dairy herds. Sci. Total Environ. 2005, 343, 71–82. [Google Scholar] [CrossRef] [PubMed]
  10. Stott, A.; MacLeod, M.; Moran, D. Reducing Greenhouse Gas Emissions through Better Animal Health Rural Policy Centre Policy Briefing July 2010 (RPC PB 2010/01); SAC: Edinburgh, UK, 2010. [Google Scholar]
  11. Guelbenzu, M.; Graham, D. Prevalence of BVD in Northern Ireland Dairy and Suckler Herds; Agri-Food and Biosciences Institute: Belfast, UK, 2013. [Google Scholar]
  12. ADAS UK Ltd. Study to Model the Impact of Controlling Endemic Cattle Diseases and Conditions on National Cattle Productivity; Agricultural Performance and Greenhouse Gas Emissions: Final Report; Defra/AVHLA: London, UK, 2014. [Google Scholar]
  13. Houdijk, J.G.M.; Tolkamp, B.J.; Rooke, J.A.; Hutchings, M.R. Animal health and greenhouse gas intensity: The paradox of periparturient parasitism. Int. J. Parasitol. 2017, 47, 633–641. [Google Scholar] [CrossRef] [PubMed]
  14. Opio, C.; Gerber, P.; Mottet, A.; Falcucci, A.; Tempio, G.; MacLeod, M.; Vellinga, T.; Henderson, B.; Steinfeld, H. Greenhouse Gas Emissions from Ruminant Supply Chains—A Global Life Cycle Assessment; Food and Agriculture Organization of the United Nations: Rome, Italy, 2013. [Google Scholar]
  15. Staal, S.; Poole, J.; Baltenweck, I.; Mwacharo, J.; Notenbaert, A.; Randolph, T.; Thorpe, W.; Nzuma, J.; Herrero, M. Targeting Strategic Investment in Livestock Development as a Vehicle for Rural Livelihoods. BMGF-ILRI Project on Livestock Knowledge Generation; International Livestock Research Institute: Nairobi, Kenya, 2009. [Google Scholar]
  16. Hristov, A.N.; Oh, J.; Lee, C.; Meinen, R.; Montes, F.; Ott, T.; Firkins, J.; Rotz, A.; Dell, C.; Adesogan, A.; et al. Mitigation of Greenhouse Gas Emissions in Livestock Production—A Review of Technical Options for Non-CO2 Emissions; Gerber, P.J., Henderson, B., Makkar, H.P.S., Eds.; FAO Animal Production and Health Paper No. 177; Food and Agriculture Organization of the United Nations: Rome, Italy, 2013. [Google Scholar]
  17. Cecchi, G.; Mattioli, R.; Slingenbergh, J.; De La Rocque, S. Land cover and tsetse fly distributions in sub-Saharan Africa. Med. Vet. Entomol 2008, 22, 364–373. [Google Scholar] [CrossRef] [PubMed]
  18. Cattand, P.; Simarro, P.; Jannin, J.; Ly, C.; Fall, A.; Shaw, A.; Mattioli, R. Linking Sustainable Human and Animal African Trypanosomiasis Control with Rural Development Strategies; Programme Against African Trypanosomiasis–Technical and Scientific Series. Vol. 10. 2010; Food and Agriculture Organization of the United Nations: Rome, Italy, 2010. [Google Scholar]
  19. Simarro, P.P.; Cecchi, G.; Franco, J.R.; Paone, M.; Diarra, A.; Ruiz-Postigo, J.A.; Fèvre, E.M.; Mattioli, R.; Jannin, J.G. Estimating and mapping the population at risk of sleeping sickness. PLoS Negl. Trop. Dis. 2012, 6, 1859. [Google Scholar] [CrossRef] [PubMed]
  20. Taylor, K.; Authié, E.M.-L. Pathogenesis of Animal Trypanosomiasis. In The Trypanosomiases; Maudlin, I., Holmes, P.H., Miles, M.A., Eds.; CAB International: Wallingford, UK, 2004. [Google Scholar]
  21. Diall, O.; Cecchi, G.; Wanda, G.; Argilés-Herrero, R.; Vreysen, M.J.B.; Cattoli, G.; Viljoen, G.J.; Mattioli, R.; Bouyer, J. Developing a Progressive Control Pathway for African Animal Trypanosomosis. Trends Parasitol. 2017, 33, 499–509. [Google Scholar] [CrossRef] [PubMed]
  22. IGAD. The IGAD Region. Available online: https://igad.int/index.php/about-us/the-igad-region (accessed on 24 September 2017).
  23. FAOSTAT Live Animals. Available online: http://www.fao.org/faostat/en/#data/QA (accessed on 9 May 2018).
  24. Cecchi, G.; Wint, W.; Shaw, A.; Marletta, A.; Mattioli, R.; Robinson, T. Geographic distribution and environmental characterization of livestock production systems in Eastern Africa. Agric. Ecosyst. Environ. 2010, 135, 98–110. [Google Scholar] [CrossRef]
  25. Shaw, A.P.M.; Cecchi, G.; Wint, G.R.W.; Mattioli, R.C.; Robinson, T.P. Mapping the economic benefits of intervening against bovine trypanosomiasis in Eastern Africa. Prev. Vet. Med. 2014, 113, 197–210. [Google Scholar] [CrossRef] [PubMed]
  26. Mwai, O.; Hanotte, O.; Kwon, Y.-J.; Cho, S. African Indigenous Cattle: Unique Genetic Resources in a Rapidly Changing World. Asian-Australas. J. Anim. Sci. 2015, 28, 911–921. [Google Scholar] [CrossRef] [PubMed]
  27. Domestic Animal Genetic Resources Information System (DAGRIS). Available online: http://dagris.info/ (accessed on 9 May 2018).
  28. Shaw, A.; Wint, W.; Cecchi, G.; Torr, S.; Waiswa, C.; Alemu, T.; Eregae, M.; Abdi, A.; Muchina, S.; Mugasi, S.; et al. Intervening against Bovine Trypanosomosis in Eastern Africa: Mapping the Costs and Benefits; PAAT Technical and Scientific Series No. 11; FAO: Rome, Italy, 2017; Available online: http://www.fao.org/3/a-i7342e.pdf (accessed on 15 May 2018).
  29. Itty, P. Economics of Village Cattle Production in Tsetse-affected Areas of Africa. In A Study of Trypanosomiasis Control Using Trypanotolerant Cattle and Chemotherapy in Ethiopia, Kenya, The Gambia, Côte d’Ivoire, Zaire and Togo; Hartung-Gorre Verlag: Constance, Germany, 1992. [Google Scholar]
  30. Starkey, P.; Kaumbutho, P. Meeting the Challenges of Animal Traction. In A Resource Book of the Animal Traction Network for East-ern and Southern Africa (ATNESA), Harare, Zimbabwe; Intermediate Technology Publications: London, UK, 1999. [Google Scholar]
  31. Rege, J.E.O.; Kahi, A.K.; Okomo-Adhiambo, M.; Mwacharo, J.; Hanotte, O. Zebu Cattle of Kenya: Uses, Performance, Farmer Preferences, Measures of Genetic Diversity; ILRI (International Livestock Research Institute) and Kenya Agriculture Research Institute (KARI): Nairobi, Kenya, 2001. [Google Scholar]
  32. Otte, M.J.; Chilonda, P. Cattle and Small Ruminant Production Systems in Sub-Saharan Africa. A Systematic Review; FAO (Food and Agriculture Organization of the United Nations): Rome, Italy, 2002. [Google Scholar]
  33. Ocaido, M.; Otim, C.; Okuna, N.; Erume, J.; Ssekitto, C.; Wafula, R.; Kakaire, D.; Walubengo, J.; Monrad, J. Socio-economic and livestock disease survey of agro-pastoral communities in Serere County, Soroti District, Uganda. Livest. Res. Rural Dev. 2005, 17, 93. [Google Scholar]
  34. Shaw, A.P.M.; Wint, G.R.W.; Cecchi, G.; Torr, S.J.; Mattioli, R.C.; Robinson, T.P. Mapping the benefit-cost ratios of interventions against bovine trypanosomiasis in Eastern Africa. Prev. Vet. Med. 2015, 122, 406–416. [Google Scholar] [CrossRef] [PubMed]
  35. MacLeod, M.J.; Vellinga, T.; Opio, C.; Falcucci, A.; Tempio, G.; Henderson, B.; Makkar, H.; Mottet, A.; Robinson, T.; Steinfeld, H.; et al. Invited Review: A Position on the Global Livestock Environmental Assessment Model (GLEAM). Animal 2018, 12, 383–397. [Google Scholar] [CrossRef] [PubMed]
  36. Wint, G.R.W. Kilometre Resolution Tsetse Fly Distribution Maps for the Lake Victoria Basin and West Africa; Report to the Joint Food and Agriculture Organization of the United Nations/International Atomic Energy Agency Programme; Food and Agriculture Organization: Rome, Italy, 2001. [Google Scholar]
  37. Wint, W.; Rogers, D. Predicted Distributions of Tsetse in Africa; Report of the Environmental Research Group Oxford Ltd and TALA Research Group, Department of Zoology, University of Oxford, for the Animal Health Service of the Animal Production and Health Division of the Food and Agriculture Organisation of the United Nations; FAO: Rome, Italy, 2000. [Google Scholar]
  38. Wint, W.; Robinson, T. Gridded Livestock of the World; FAO (Food and Agricultural Organization of the United Nations): Rome, Italy, 2007. [Google Scholar]
  39. Weiler, V.; Udo, H.M.; Viets, T.; Crane, T.A.; De Boer, I.J. Handling multi-functionality of livestock in a life cycle assessment: The case of smallholder dairying in Kenya. Curr. Opin. Environ. Sustain. 2014, 8, 29–38. [Google Scholar] [CrossRef]
  40. IPCC. IPCC Guidelines for National Greenhouse Gas Inventories; Prepared by the National Greenhouse Gas Inventories Programme; Eggleston, H.S., Buendia, L., Miwa, K., Ngara, T., Tanabe, K., Eds.; IPCC: Kanagawa, Japan, 2006. [Google Scholar]
  41. Peeler, E.; Omore, A. Manual of Livestock Production Systems in Kenya; KARI (Kenya Agricultural Research Institute): Nairobi, Kenya, 1997. [Google Scholar]
  42. Roderick, S.; Stevenson, P.; Mwendia, C.; Okech, G. The use of trypanocides and antibiotics by Maasai pastoralists. Trop. Anim. Health Prod. 2000, 32, 361–374. [Google Scholar] [CrossRef] [PubMed]
  43. Roderick, S.; Stevenson, P.; Ndungu, J. The production parameters influencing the composition and structure of pastoral cattle herds in a semi-arid area of Kenya. Anim. Sci. 1998, 66, 585–594. [Google Scholar] [CrossRef]
  44. Roderick, S.; Stevenson, P.; Ndungu, J. Factors influencing the production of milk from pastoral cattle herds in Kenya. Anim. Sci. 1999, 68, 201–209. [Google Scholar]
  45. Itty, P.; Swallow, B.; Rowlands, G.; Mulatu, W.; d’Ieteren, G. The economics of village cattle production in a tsetse-infested area of southwest Ethiopia. Prev. Vet. Med. 1995, 22, 183–196. [Google Scholar] [CrossRef]
  46. Swallow, B. Impacts of Trypanosomiasis on African Agriculture; Food and Agriculture Organization of the United Nations (FAO): Rome, Italy, 2000. [Google Scholar]
  47. Muraguri, G.R. Epidemiological and Financial Impact of Vector-borne Diseases on Productivity of Smallholder Cattle in the Coastal Lowlands of Kenya; Department of Agriculture, University of Reading: Reading, UK, 2000; p. 219. [Google Scholar]
  48. Machila, N. Improved Targeting and Appropriate Use of Trypanocidal Drugs for the Control of African Bovine Trypanosomiasis in Tsetse Endemic Areas of Western and Coastal Kenya within the Context of Primary Veterinary Care; University of Edinburgh: Edinburgh, UK, 2005; p. 304. [Google Scholar]
  49. Musa, L.; Peters, K.; Ahmed, M. On farm characterization of Butana and Kenana cattle breed production systems in Sudan. Livest. Res. Rural Dev. 2006, 18, 177. [Google Scholar]
  50. Maichomo, M.; Ndungu, J.; Ngare, P.; Ole-Mapenay, I. The performance of Orma Boran and Maasai Zebu crossbreeds in a trypanosomiasis endemic area of Nguruman, south western Kenya. Onderstepoort J. Vet. Res. 2010, 72, 87–93. [Google Scholar]
  51. Omore, A.; Muriuki, H.; Kenyanjui, M.; Owango, M.; Staal, S. The Kenyan Dairy Sub-Sector: A Rapid Appraisal; Smallholder Dairy (Research & Development) Project Report; ILRI (International Live-stock Research Institute): Nairobi, Kenya, 1999. [Google Scholar]
  52. Mudavadi, P.O.; Otieno, K.J.; Wanambacha, W.; Odenya, J.O.; Odendo, M.; Njaro, O.K. Smallholder Dairy Production and Marketing in Western Kenya: A Review of Literature; Smallholder Dairy (Research & Development) Project Research Report; ILRI (International Livestock Research Institute): Nairobi, Kenya, 2001. [Google Scholar]
  53. Ongadi, P.; Wakhungu, J.; Wahome, R.; Okitoi, L. Characterization of grade dairy cattle owning households in mixed small scale farming systems of Vihiga, Kenya. Livest. Res. Rural Dev. 2007, 19, 43. [Google Scholar]
  54. Fox, R.G.R.; Mmbando, S.; Fox, M.; Wilson, A. Effect on herd health and productivity of controlling tsetse and trypanosomiasis by applying deltamethrin to cattle. Trop. Anim. Health Prod. 1993, 25, 203–214. [Google Scholar] [CrossRef] [PubMed]
  55. Jemal, A.; Hugh-Jones, M.E. Association of tsetse control with health and productivity of cattle in the Didessa Valley, western Ethiopia. Prev. Vet. Med. 1995, 22, 29–40. [Google Scholar] [CrossRef]
  56. Laker, C.D. Assessment of the Economic Impact of Bovine Trypanosomiasis and its Control in Dairy Cattle in Mukono County, Uganda; Makerere University: Kampala, Uganda, 1998. [Google Scholar]
  57. Rowlands, G.; Mulatu, W.; Leak, S.; Nagda, S.; d’Ieteren, G. Estimating the effects of tsetse control on livestock productivity—A case study in southwest Ethiopia. Trop. Anim. Health Prod. 1999, 31, 279–294. [Google Scholar] [CrossRef] [PubMed]
  58. Shaw, A. Economics of African trypanosomiasis. In The Trypanosomiases; Maudlin, I., Holmes, P., Miles, M., Eds.; CABI Publishing: Wallingford, UK, 2004; pp. 369–402. [Google Scholar]
  59. Mugunieri, G.; Matete, G. Association of trypanosomiasis risk with dairy cattle production in western Kenya. Onderstepoort J. Vet. Res. 2005, 72, 279–284. [Google Scholar] [CrossRef] [PubMed]
  60. Minjauw, B.; McLeod, A. Tick-borne Diseases and Poverty; DFID Animal Health Programme: Edinburgh, UK, 2003. [Google Scholar]
  61. Tesfaye, D.; Speybroeck, N.; De Deken, R.; Thys, E. Economic burden of bovine trypanosomiasis in three villages of Metekel zone, Northwest Ethiopia. Trop. Anim. Health Prod. 2012, 44, 873–879. [Google Scholar] [CrossRef] [PubMed]
  62. Wilson, R.T.; Bech, J.N.; Waveren, E. Draught animals in the livelihoods of mixed smallholder farmers in North Wollo, Ethiopia. Draught Anim. News 2002, 37, 2–8. [Google Scholar]
  63. You, L.; Guo, Z.; Koo, J.; Sebastian, K.; Wood-Sichra, U. Spatial Production Allocation Model (SPAM) 2005 Version 1; Provided through Harvest Choice; International Food Policy Research Institute: Washington, DC, USA; University of Minnesota: St. Paul, MN, USA, 2014; Available online: http://harvestchoice.org (accessed on 8 January 2015).
  64. Lukuyu, B.; Gachuiri, C.K.; Lukuyu, M.N.; Lusweti, C.; Mwendia, S. Feeding Dairy Cattle in East Africa; East Africa Dairy Development Project: Nairobi, Kenya, 2012. [Google Scholar]
  65. CGIAR/ILRI Sub-Saharan Africa Feed Composition Database. Available online: http://192.156.137.110/ssafeed/ (accessed on 1 December 2015).
  66. Feedipedia. Feedipedia Animal Feed Resources Information System, a Programme by INRA, CIRAD, AFZ and FAO. Available online: http://www.feedipedia.org (accessed on 1 August 2015).
  67. Feedipedia Napier Grass. Available online: https://www.feedipedia.org/node/395 (accessed on 13 December 2017).
  68. Capper, J.L.; Cady, R.A.; Bauman, D.E. The environmental impact of dairy production: 1944 compared with 2007. J. Anim. Sci. 2009, 87, 2160–2167. [Google Scholar] [CrossRef] [PubMed]
  69. Gerber, P.; Vellinga, T.; Opio, C.; Steinfeld, H. Productivity gains and greenhouse gas EI in dairy systems. Livest. Sci. 2011, 139, 100–108. [Google Scholar] [CrossRef]
  70. Cecchi, G.; Paone, M.; Feldmann, U.; Vreysen, M.J.B.; Diall, O.; Mattioli, R.C. Assembling a geospatial database of tsetse-transmitted animal trypanosomiasis for Africa. Parasites Vectors 2014, 7, 39. [Google Scholar] [CrossRef] [PubMed]
Figure 1. Schematic diagram of the relationship between the two models: Mapping the Benefits (MTB) and Global Livestock Environmental Assessment Model (GLEAM).
Sustainability 10 01633 g001
Figure 2. Emissions intensity (EI) by cattle production system and emissions category (kgCO2e/kg edible protein at farm gate). AP: agro-pastoral. The errors bars show the 95% confidence intervals.
Sustainability 10 01633 g002
Figure 3. The relationship between productivity and EI for the 12 cattle production systems with and without trypanosomiasis. Productivity is defined as the mass of meat and milk edible protein produced by a system each year compared to the live weight mass of the cattle in the system (measured in terms of mass of living protein).
Sustainability 10 01633 g003
Figure 4. Difference in total edible protein production and GHG emissions with disease treatment. AP: agro-pastoral.
Sustainability 10 01633 g004
Figure 5. Change in EI and productivity with disease treatment. EI is measured in terms of kgCO2e per kg of edible protein produced and productivity. Productivity is defined as the mass of meat and milk edible protein produced by a system each year compared to the live weight mass of the cattle in the system (measured in terms of mass of living protein). (Key: a1 = agro-pastoral high dairy; a2 = agro-pastoral low dairy, high oxen; a3 = agro-pastoral low dairy, medium oxen; a4 = agro-pastoral low dairy, low oxen; m1 = mixed high dairy; m2 = mixed low dairy, high oxen; m3 = mixed low dairy, medium oxen; m4 = mixed, low dairy, low oxen; e1 = Ethiopia low dairy, high oxen; e2 = Ethiopia low dairy, medium oxen; e3 = Ethiopia, low dairy, low oxen; p = pastoral.).
Sustainability 10 01633 g005
Table 1. The 12 cattle production systems analysed, table adapted from [25].
Draft OxenProduction System
PastoralAgro-PastoralMixed: General aMixed: Ethiopia aHigh Milk Yield Dairy
No oxen ×× b
Low oxen ××××
Medium oxen ×××
High oxen ×××
a Two mixed farming systems were analysed, one for Ethiopia and one for the other study countries; b High milk yield dairy cows are found in the agro-pastoral and general mixed farming systems.
Table 2. The proportion of cattle in each system.
Production System% of Total Cattle Population
Pastoral12%
Agropastoral, low dairy and oxen34%
Mixed, low dairy and oxen11%
Agropastoral, high dairy and low oxen2%
Agropastoral, low dairy and medium oxen1%
Agropastoral, low dairy and high oxen2%
Mixed, high dairy and low oxen4%
Mixed, low dairy and low oxen1%
Mixed, low dairy and high oxen1%
Mixed, low dairy and medium oxen (eth)7%
Mixed, low dairy and high oxen (eth)18%
Mixed, low dairy and low oxen (eth)8%
Total100%
Table 3. The emission categories quantified in the study.
CategoryEmissions Sources
Manure N2ODirect and N2O arising from the nitrification/denitrification of excreted N during its management and storage.
Manure CH4CH4 arising from the anaerobic decomposition of excreted organic matter during its management and storage.
Enteric fermentation CH4CH4 arising from the microbial decomposition of feed during digestion.
Feed energy CO2CO2 from: fossil fuel use in the cultivation of feed crops; fossil fuel use in the production of non-crop feed materials; processing, transportation and blending of feed materials; fossil fuel use from the production of synthetic fertiliser; land use change arising from soy cultivation.
Feed N2ODirect and indirect N2O from: application of synthetic fertiliser and manure to crops; crop residue management; direct deposition of N by grazing animals; fertiliser manufacture.
Table 4. Values for selected parameters used in the analysis (T+ refers to the value with trypanosomiasis, T− to the value without trypanosomiasis). The values were estimated based on a review of longitudinal and cross-sectional studies comparing the productivity observed in infected and uninfected individual cattle or whole herds, under conditions of both high and low trypanosomiasis challenge (see Section 2.3.3). Table adapted from [25].
ParameterCattle Production Systems
PastoralAgro-PastoralMixed Farming (General)Mixed Farming (Ethiopia)High Milk Yield Dairy
T+T−T+T−T+T−T+T−T+T−
Mortality% of animals dying each year
Female calves20171815161324202118
Male calves25222017181526222623
Adult females7.56.57.06.08.07.09.07.512.010.0
Work oxen9.07.28.56.89.07.210.08.0--
Fertility% of cows producing a living calf each year
Cow fertility54585256515549545357
LactationLitres of milk per lactation a
Milk offtake27529628530630032228030119002042
a Lactation length varies depending on the system; in this study it is assumed that most of the milk for human consumption is taken off in the 12 months following calving.
Table 5. Parameters included in the Monte Carlo analysis.
ParameterDistributionCoefficient of VarianceMinimum-MaximumBasis
Forage digestibility, DE%Normal6% [67]
Milk yieldNormal11–39% [32]
Cow fertilityNormal8–21% [32]
Calf death rateNormal25–45% [32]
Enteric CH4 factor, YmNormal10% [40], (Vol. 4, p. 10.33)
N2O Emission factor 1Lognormal 0.003–0.03[40], (Vol. 4, p. 11.11)
N2O Emission factor 3Lognormal 0.007–0.06[40], (Vol. 4, p. 11.11)
Table 6. Summary of the sensitivity analysis, showing the change in EI resulting from a ±10% change in each parameter (“Draft”: the % of male cattle aged >3 years old that are used for draft. EF: emission factor; DE: digestible energy).
SystemChange in ParameterChange in EI
ConstantVary with SystemVary with System and Disease Status
N2O EF1N2O EF3Forage DE%Enteric CH4, YmMilk YieldCow FertilityCalf Death RateDraft
Pastoral+10%0.7%1.2%−16.4%7.2%−4.5%−3.9%−0.6%0.5%
Pastoral−10%−0.7%−1.2%23.1%−7.2%4.9%4.9%0.6%−0.5%
AP, high dairy+10%1.6%0.1%−15.8%5.1%−6.3%−5.4%2.2%0.0%
AP, high dairy−10%−1.6%−0.1%22.2%−5.1%7.5%6.7%0.0%0.0%
AP, low oxen+10%1.4%0.7%−16.4%6.3%−4.4%−2.9%−0.7%1.0%
AP, low oxen−10%−1.4%−0.7%23.5%−6.3%4.8%3.5%0.7%−1.0%
AP, medium oxen+10%1.1%0.7%−16.5%6.8%−4.4%−3.0%−0.7%2.0%
AP, medium oxen−10%−1.1%−0.7%23.7%−6.8%4.8%3.6%0.7%−2.0%
AP, high oxen+10%1.3%0.7%−16.3%6.5%−4.4%−3.1%−0.7%3.8%
AP, high oxen−10%−1.3%−0.7%23.3%−6.5%4.9%3.9%0.7%−3.8%
Mixed, high dairy+10%1.6%0.1%−15.8%5.1%−6.3%−5.4%2.3%0.0%
Mixed, high dairy−10%−1.6%−0.1%22.2%−5.1%7.5%6.7%−0.1%0.0%
Mixed, low oxen+10%1.2%0.3%−17.1%6.7%−4.4%−1.7%−0.9%0.9%
Mixed, low oxen−10%−1.2%−0.3%24.9%−6.7%4.9%2.0%0.9%−0.9%
Mixed, medium oxen+10%1.8%0.3%−16.7%6.2%−4.5%−2.7%−0.6%2.0%
Mixed, medium oxen−10%−1.8%−0.3%24.1%−6.2%4.9%3.7%0.6%−2.0%
Mixed, high oxen+10%1.4%0.3%−16.8%6.7%−4.5%−3.3%−0.6%3.8%
Mixed, high oxen−10%−1.4%−0.3%24.3%−6.7%4.9%4.1%0.6%−3.7%
Ethiopia, low oxen +10%1.5%0.3%−16.8%6.4%−4.5%−1.7%−1.5%0.6%
Ethiopia, low oxen −10%−1.5%−0.3%24.5%−6.4%5.0%2.0%1.5%−0.6%
Ethiopia, medium oxen +10%1.6%0.3%−16.8%6.4%−4.6%−3.1%−1.1%2.0%
Ethiopia, medium oxen −10%−1.6%−0.3%24.3%−6.4%5.1%3.7%1.0%−2.0%
Ethiopia, high oxen +10%1.8%0.3%−16.6%6.2%−4.6%−3.5%−1.0%3.7%
Ethiopia, high oxen −10%−1.8%−0.3%23.9%−6.2%5.1%4.3%0.9%−3.6%

