Quantifying the Availability of Vertebrate Hosts to Ticks: A Camera-Trapping Approach
 Tim R. Hofmeester
 J. Marcus Rowcliffe
 Patrick A. Jansen
- 1Department of Environmental Sciences, Wageningen University, Wageningen, Netherlands
- 2Institute of Zoology, Zoological Society of London, London, United Kingdom
- 3Center for Tropical Forest Science, Smithsonian Tropical Research Institute, Balboa, Ancon, Panama
The availability of vertebrate hosts is a major determinant of the occurrence of ticks and tick-borne zoonoses in natural and anthropogenic ecosystems and thus drives disease risk for wildlife, livestock, and humans. However, it remains challenging to quantify the availability of vertebrate hosts in field settings, particularly for medium-sized to large-bodied mammals. Here, we present a method that uses camera traps to quantify the availability of warm-bodied vertebrates to ticks. The approach is to deploy camera traps at questing height at a representative sample of random points across the study area, measure the average photographic capture rate for vertebrate species, and then correct these rates for the effective detection distance. The resulting “passage rate” is a standardized measure of the frequency at which vertebrates approach questing ticks, which we show is proportional to contact rate. A field test across twenty 1-ha forest plots in the Netherlands indicated that this method effectively captures differences in wildlife assemblage composition between sites. Also, the relative abundances of three life stages of the sheep tick Ixodes ricinus from drag sampling were correlated with passage rates of deer, which agrees with the known association with this group of host species, suggesting that passage rate effectively reflects the availability of medium- to large-sized hosts to ticks. This method will facilitate quantitative studies of the relationship between densities of questing ticks and the availability of different vertebrate species—wild as well as domesticated species—in natural and anthropogenic settings.
Introduction
Ticks are important vectors for many pathogens that cause disease in livestock and humans (1). Many tick-borne pathogens are transmitted to ticks during a blood meal on a vertebrate host (2). The distribution of ticks over the different host species is widely assumed to be the main determinant of pathogen prevalence in ticks and hosts when (i) the tick vector parasitizes multiple host species, and (ii) these host species differ in their ability to transmit a pathogen to feeding ticks (3). Unraveling this relationship in empirical studies remains an important goal.
Gathering reliable field data on the availability of vertebrates remains challenging for species that cannot be surveyed using capture-mark-recapture techniques. Density estimation is especially difficult for medium-sized to large-bodied mammals (4), which cannot easily be live trapped, and are often shy and/or nocturnal. Many of the larger mammal species are relatively important hosts for ticks. Deer, for example, are key hosts for the ticks in the Ixodes ricinus complex (5). To date, field studies of ticks often rely on indirect counts or secondary sources for abundance data on these hosts. For example, one of the most extensive studies in this field used published site-level data for six out of ten species (6). Site-level density, however, may not reflect the availability of hosts to ticks at smaller spatial scales, because habitat use by mammals is usually highly heterogeneous (7).
One method to estimate the local availability of larger mammals to ticks is dung counts [e.g., Ref. (8, 9)]. While more dung does not necessarily mean more individuals, dung counts do provide a proxy for the intensity at which species frequent a given location, the factor that ultimately—more than abundance per se—drives availability of hosts to ticks. However, a pervasive problem with dung counts is that dung disappears at unknown and variable rates, so that the sampling period over which the dung accumulated is unknown (10). Also, dung counts cannot be used to compare availability between species, because dung deposition rates differ between host species in unknown ways. Finally, many host species do not defecate in random places as they move. For example, carnivores such as pine marten (Martes martes) typically deposit their scats in strategic positions to mark their territory (11). Thus, dung counts have limited value as estimates of the relative availability of vertebrate hosts to ticks.
In this paper, we introduce surveys with camera traps as an alternative method for quantifying the availability of vertebrates to ticks. Camera traps (a.k.a. trail cameras) are photo or video cameras that can be deployed in the field to photograph warm-bodied animals that pass in front. Typically, camera traps are triggered by a passive infrared sensor that detects fluctuations in thermal infrared influx. Such fluctuations arise upon the passage of animals of which the outer surface (skin or coat) is warmer (or colder) than the temperature of the background (vegetation or ground) (12). Photographic capture rates (sightings/day) derived from camera-trap images are widely used as indices of relative abundance of animals (13). Rates at which animals are captured potentially reflect the availability of hosts to ticks, as these rates are a combination of the factors underlying host availability: density, activity level, and spatial behavior of hosts (14).
Here, we describe and field test the use of camera traps to measure the relative availability of vertebrate hosts to ticks. Briefly, the approach is to deploy camera traps at random points to obtain a representative sample of photographic capture rates for all vertebrate species present, and correct these capture rates for differences in detection distance between species and habitats (15). We demonstrate that the resulting “passage rate” is directly proportional to the expected rate of contact between hosts and ticks, so can be viewed as a standardized measure of the likelihood of vertebrates passing questing ticks. To determine whether this approach was effective, we performed a field study in twenty 1-ha forest plots in the Netherlands that widely differed in fauna, and correlated relative abundance of the sheep tick Ixodes ricinus obtained from drag sampling with passage rates of hosts as estimated with camera trapping. We used principal component analysis (PCA) to assess whether (i) host passage rates reflected known differences in wildlife assemblage composition between sites, and whether (ii) host passage rates were correlated with the relative abundances of three life stages of the sheep tick in a manner consistent with expectations based on known associations with host species. Specifically, we expected tick densities to increase with the availability of deer, which are considered key hosts (8, 16).
Material and Methods
Development of the Method
Most tick species that are of medical or veterinary importance wait for a passing animal in the vegetation, like sit-and-wait predators, in a position known as “questing” (2). While questing, ticks cling to leaves by their third and fourth pair of legs, and hold the first pair of legs outstretched, waiting to grasp and climb on to any passing host (17). Ticks detect hosts by CO2, body odors, body heat, moisture, and vibrations (18). Thus, successful attachment to a host depends on the frequency and proximity of passage, similar to a predator in ambush (19). Only host animals that walk on the ground are available to ticks (2).
Camera traps are similar to ticks (and other sit-and-wait predators) in that they detect and capture passing animals (12). Animal detection by cameras is, like animal detection by ticks, a function of the frequency and proximity of passage. The approach of using camera traps to assess host availability to ticks is based on the idea that cameras positioned at the questing height of ticks quantify the frequency and proximity of animal passage, which together determine the rate at which ticks encounter hosts. We assume that the likelihood of a questing tick to encounter a certain host species is proportional to the rate at which hosts pass random points at questing height.
Using gas-model theory, we first show that animal passage rate from cameras is theoretically proportional to the rate of contact between animals and ticks. The contact rate between camera traps and animals (Rcam) can be calculated as:
where D is the density at which the animal occurs, v the average day range of the animal, rcam the average distance from the camera at which animals are detected (detection distance), and θcam the angle of the circular sector within which animals are detected (detection arc) (20). In contrast to camera traps, ticks can detect animals from all directions. If we assume that animals walk randomly in relation to the position of ticks, the contact rate between ticks and animals (Rtick) is best described by a gas model where both “sensors” and “signals” are circular (21):
As ticks and cameras are positioned in the same system, D ·v is constant, so we can express Rtick as a function of Rcam:
The accuracy of Rtick critically depends on the careful positioning of the camera traps—horizontal at questing height—and the accurate estimation of rcam and θcam. Multiple methods are available for estimating these parameters (15, 22, 23). The simplest method is to define a line of sight in the view of the camera trap, measure at what distance animals cross that line, and then fit a function to these distances for each species to estimate rcam, as explained in Hofmeester et al. (15). Counting only the passages over that line effectively reduces θcam to zero, simplifying the equation:
As rtick is a constant, Rtick is directly proportional to , the “passage rate” adjusted for variation in detection distance. By estimating rcam per species and habitat type (15) passage rates are standardized and thus comparable between species and sites. This means that passage rates of different species can be summed to estimate the availability of groups of species, such as specific functional or taxonomic groups.
The average passage rate of vertebrates in a study plot can be estimated by placing cameras at random points, such that a representative sample of the study area is obtained. In practice, the camera is mounted on a tree at or near a computer-generated random point, or on a pole that is driven into the soil. The average passage rate can be correlated with estimates of tick density or infection prevalence in ticks, as obtained by sampling ticks in the same plot, either during the same period or after a time lag when the focal tick species has a multi-year life cycle (2).
Field Test
We tested this method by sampling 20 1-ha plots in 19 forests across the Netherlands with contrasting faunas, calculated average passage rate, and correlated these with abundance estimates of the sheep tick (Ixodes ricinus), a three-host species that quests in the vegetation (5). Larvae of the sheep tick feed mainly on small mammals, nymphs feed on medium-sized birds and mammals of any size, and adults feed mainly on deer (24). While the density of sheep ticks is dependent on the availability of many different host species, several studies have shown that tick density is especially correlated with deer density (8, 16).
All sampling plots were located in forests that had either pedunculate oak (Quercus robur), Scots pine (Pinus sylvestris), or a combination of these (mixed forest) as dominant tree species (Table 1). Forests were selected based on published distribution maps of mammals in the Netherlands (25). All plots were >5 km apart except for two plots at Enkhout, which were just 150 m apart; one of these was located in a 3-ha stand fenced three years prior to the study to create a situation without large mammals. We sampled eleven plots for vertebrates and ticks in 2013 and nine plots in 2014.
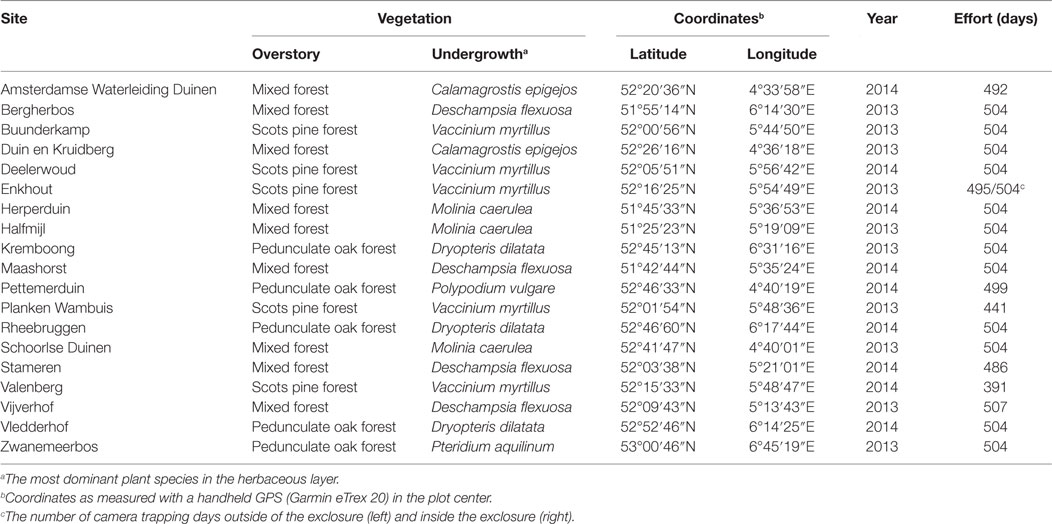
Table 1. Characteristics of the research sites and sampling effort (camera days).
As baseline for comparison, we determined the expected presence of hosts based on habitat preference and distribution of the different medium-sized to large mammals in the Netherlands [Table 2; Ref. (25)]. We only included species known to be parasitized by the sheep tick (26) and excluded small mammals—bank vole (Myodes glareolus), weasel (Mustela nivalis), and wood mouse (Apodemus sylvaticus)—as species of this size are difficult to capture using camera traps (23), and because, based on their distribution patterns, these species occurred in all 20 plots.
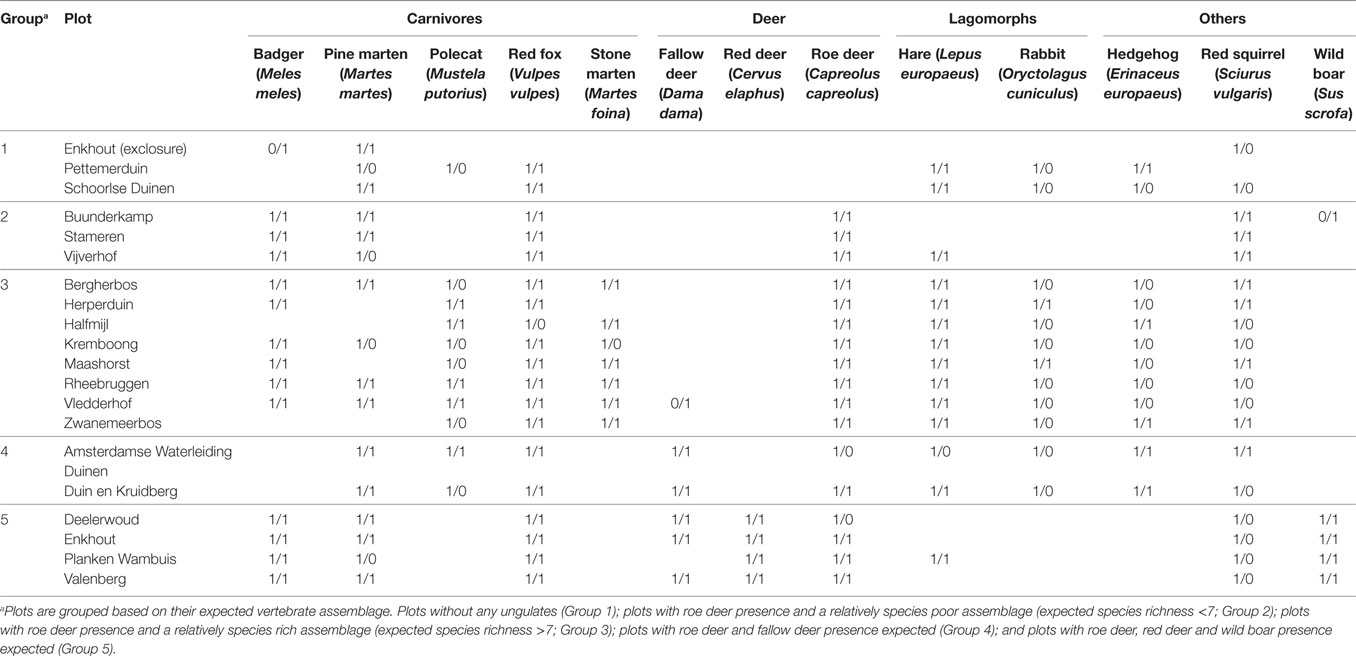
Table 2. Presence of mammal species in the 20 study plots as expected based on habitat preference and published distribution maps (left) and as detected by camera traps in this study (right).
Camera Trapping of Mammals
We measured the availability of hosts throughout March–November, the main activity season of the sheep tick in the Netherlands (27), by running camera traps at 18 random points per plot (as rule of thumb, in homogenous areas, the average passage rate stabilizes as the number of sample points approaches 20) (28). Two camera traps (HC500, Reconyx Inc., Holmen, WI, USA.) were deployed at random points in each plot during nine consecutive rounds of four weeks. Points sampled simultaneously were >30 m apart, as to reduce the likelihood of any animal walking past both cameras in a short amount of time. Thus, we sampled 18 points per plot for a total of 504 sampling days (Table 1). Cameras were placed on a tree nearest to a computer-generated random point, at 40 cm above the ground with the view parallel to the ground, without bait or lure. We set the camera traps to the highest sensitivity, to take a series of ten pictures when triggered with no delay, and to take time-lapse photos every 12 h to generate a record of camera functioning. We used a semi-automated image-processing tool (28) in which sequences were combined per event.
We quantified rcam for each species and habitat type using the line-transect method (15) to control for variation in detectability between species and sites. This method involved the placement of a line of markers in the center of the view at distance intervals of 2.5 m. For each animal passage, we recorded the species and distance interval at which the animal crossed the line. Using these frequency data, we estimated rcam for all mammal species per habitat type (Table 3) using a point model with a detection probability, described by a half-normal function, and with log10-transformed body mass as covariate (15). Estimates of rcam were used to estimate passage rate per species per camera. For each plot, we then calculated the average passage rate (m−1⋅day−1) per species by using the arithmetic mean over sampling points. Furthermore, we combined passage rates of related species into passage rates of taxonomic groups by summing the detection-corrected species- and site-specific passage rates.
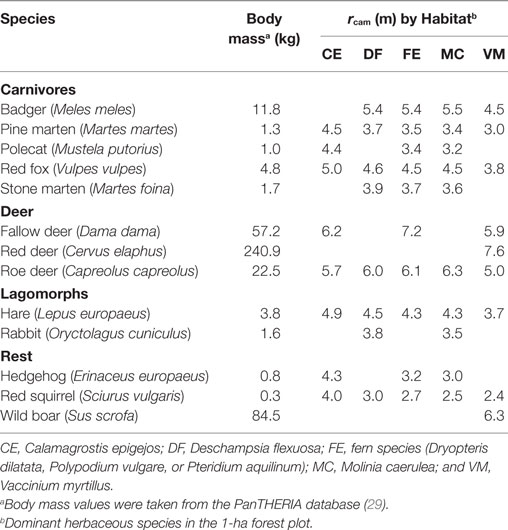
Table 3. Estimated effective detection distances (rcam) of species by camera traps in this study, estimated using a point model with a half-normal detection probability fitted to recorded passage distances, with log10-transformed body mass as covariate, and by habitat type.
Drag Sampling of Ticks
We estimated the abundance of questing ticks by blanket dragging six times in each plot, once every four weeks during April–September, the main activity season for the sheep tick in the Netherlands (30). During each session, a cotton cloth of 1 m2 was dragged for twenty transects of 10 m, resulting in 200 m2 per session as in (31). We dragged for ticks only during conditions with dry weather with a temperature above 10°C and dry vegetation, following the recommendations of Mejlon and Jaenson (32) and Randolph (2). After each transect, we counted all larvae, nymphs, and adult sheep ticks on the bottom side of the cloth and used these numbers to calculate the average tick density per 100 m2 for each life stage.
Analyses
We used principal component analysis (PCA) to quantify differences in passage rates of wildlife across plots, with the vegan package in R 3.2.3 (33, 34), as this multivariate analysis allowed us to examine relationships in host passage rate of the whole mammal community in a single model (35). We did this both for individual species and for taxonomic groups. To determine whether camera trapping accurately captured the wildlife communities of the sampling plots, we calculated the percentage overlap between the expected and observed presence of species (Table 2).
Second, we used PCA to quantify differences in tick densities across the plots by life stage, and related the outcome to the passage rates of vertebrate hosts. Here, the multivariate approach allowed us to model the three life stages of the sheep tick simultaneously to explore general patterns for the species, which may be more informative than specific correlations per life stage. We tested for correlations between the availability of specific vertebrate species and the sheep tick composition of a plot using 999 permutations in the envfit function of the vegan package (33, 36). Specifically, we verified whether variation in density of different life stages of ticks between sites was explained by passage rates of deer, which are known as key hosts (8, 16).
Results
Camera traps detected a total of thirteen medium-sized to large mammal species in the 20 forest plots (Table 3). Overall, the species presence as determined with camera trapping was similar (72%) to what was expected based on habitat preference and distribution patterns (Table 2). We recorded fallow deer and wild boar in two plots that were located outside the published distribution patterns, and we recorded a badger inside the exclosure at Enkhout, which had dug its ways underneath the fence. Only the four smallest mammal species—polecat, rabbit, hedgehog and red Squirrel—were recorded in fewer plots than expected (37% similarity), while the three largest species—fallow deer, red deer, and wild boar—were recorded in all plots where they were expected (100% similarity; Table 2). Detection distance, rcam, differed considerably between species and vegetation types (Table 3).
Principal Component Analysis of passage rates reflected the large variation between plots in the composition of the host assemblage (Figure 1A), where the first three axes of the PCA explained 57% of the variation (Table S1 in Supplementary Material). Plots grouped together as expected, where the first PCA axis separated the plots in groups 1, 4, and 5 from those in groups 2 and 3, and the second PCA axis separated groups 4 and 5 (Figure 1A). Much of the variation in passage rate was retained after combining capture rates of host species by taxonomic group (Figure 1B), where the first two axes of the PCA explained 56% of variation between forest plots.
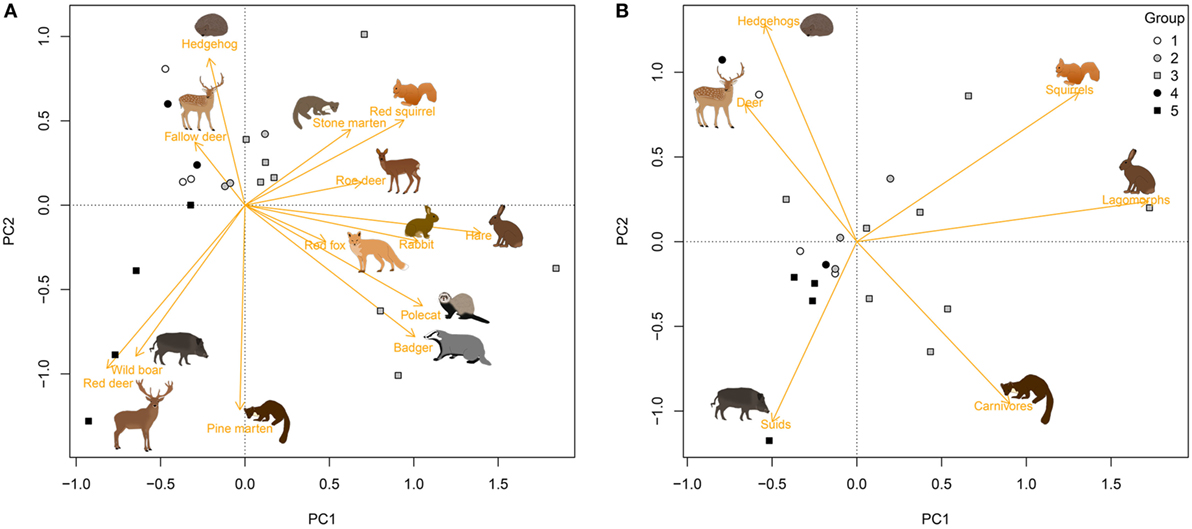
Figure 1. Differences in passage rate of medium- to large-sized mammals among 20 forest plots in the Netherlands, estimated with camera traps placed at 18 random points per plot. Graphs show the first two axes of a Principal Component Analysis (PCA) for (A) species and (B) taxonomic groups (orange vectors). White symbols refer to plots without ungulates, gray symbols to plots in which roe deer (Capreolus capreolus) was the only ungulate species, and black symbols to plots with two to four ungulate species. See Table 2 for an explanation of group numbers.
The density of questing sheep ticks also varied widely across the 20 forest plots. The variation was well described by the first two axes of the PCA (87% of variation explained), where the first axis captured the variation between plots with very low tick densities for all three stages and plots with high tick densities for all three stages. The second axis separated plots with high densities of larvae from plots with high densities of nymphs and adults (Figure 2). Plots without deer (Group 1) had the lowest tick densities, plots with high passage rates of ungulates the highest (Figure 2). At the level of host species, differences in tick density between forest plots were best explained by the passage rates of red fox (p = 0.06, R2 = 0.28) and red deer (p = 0.12, R2 = 0.22) (Figure 2A). At the level of taxonomic groups of hosts, differences in tick density were best explained by passage rates of carnivores (p = 0.08, R2 = 0.25), and deer (p = 0.21, R2 = 0.15): tick density increased with passage rates of deer and decreased with passage rates of carnivores (Figure 2B).
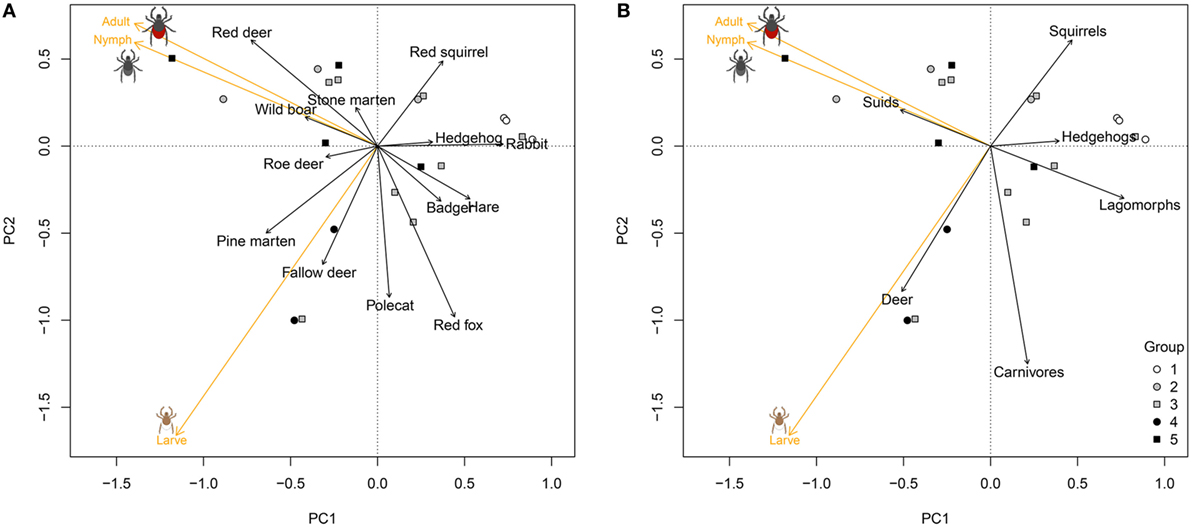
Figure 2. Variation in estimated density of three life stages of the sheep tick (Ixodes ricinus) across 20 forest plots in the Netherlands, estimated with drag sampling, in relation to the passage rates of medium- to large-sized mammals in the same plots. Graphs show the first two axes of a principal component analysis (PCA) of differences in tick density across plots by life stage (orange vectors), correlated with the passage rates of host species (A), and taxonomic groups of vertebrates (B) (black vectors). Symbols as in Figure 1.
Discussion
Quantifying the availability of vertebrate hosts to ticks is important for our understanding of the dynamics of ticks and tick-borne diseases but has been challenging in field settings. Here, we have described a procedure in which host availability to ticks is estimated as the rate at which hosts pass randomly placed camera traps. In a field test of this procedure across 20 forest plots in the Netherlands, passage rates largely reflected the mammal assemblage that was expected based on habitat preference and published distribution maps of the species. Moreover, densities of the sheep tick (Ixodes ricinus) were correlated with passage rates of hosts in a manner expected based on literature. Therefore, we conclude that measuring host passage rates with camera traps is an effective method to quantify the relative availability of hosts to ticks.
Camera trapping recorded all thirteen species of mammal that we expected to find (Table 2). Large species such as red deer (Cervus elaphus) and wild boar (Sus scrofa), which have a restricted range in the Netherlands (25), were recorded in all sites where they were expected to occur. However, smaller species such as red squirrel (Sciurus vulgaris), hedgehog (Erinaceus europaeus), rabbit (Oryctolagus cuniculus), and polecat (Mustela putorius) were often missed in plots where they were expected based on habitat preference and distribution. This may be partly due to the relatively small size of these species, giving lower detection distance (Table 3), and so lower overall probability of detection. However, there are likely additional, species-specific reasons for this result. Red squirrels only occasionally visit the ground (37), which means that they are rarely available for detection by camera traps. However, this also means that they effectively have low availability as hosts to ticks, which is precisely what the passage rates reflect. The other three species prefer half-open landscapes and enter forest only occasionally (25), which might explain the low passage rates or non-detection in multiple plots. In other words, passage rate appeared to accurately reflect the effective local availability of mammalian hosts to ticks.
Sheep tick density correlated with host passage rate in a manner that was consistent with expectations (Figure 2). Sheep tick density was higher in areas with higher availability of deer—red deer, roe deer (Capreolus capreolus), and fallow deer (Dama dama)—which agrees with previous studies that found a positive correlation between the number of ticks and densities of roe deer and red deer (8, 16). Our finding that sheep tick density was lower in areas with a high availability of red fox (Vulpes vulpes) was consistent with a study that found a negative correlation between densities of the black-legged tick (Ixodes scapularis) and foxes in north–western USA (38).
The presented method considers variation in host availability to ticks in two dimensions. However, the availability of hosts to ticks will also vary in a third dimension: the height relative to the ground surface. The three life-stages of the sheep tick quest at different heights: 0–29 cm for larvae, 30–59 cm for nymphs, and 60–79 cm for adults (32), which is also dependent on vegetation height. Camera traps mounted at 40-cm height most likely capture all animals passing from ground level up to approximately 2 m high. Only small animals (<40 cm high) that pass right before the camera might be missed, but this can be incorporated in the detection probability function for estimating the detection distance rcam (23). Therefore, camera traps likely capture all animals that are available, but not all animals passing will be available for all life stages of the ticks. Performing analyses per tick life stage, including only species that are available at the height at which the life stage quests might resolve this issue, but remains to be tested.
More in general, camera traps work well to measure passage rates of medium-sized and large mammals, but miss small mammals and birds when mounted at knee level. This is unfortunate, because small mammals are key hosts for the larval stage of the sheep tick (24). Camera traps in our field test rarely captured small mammals, although live trapping showed that rodents were present in all but one plot (39). This is likely due to their small size, which makes it difficult for the passive infrared sensor of the camera traps to detect them (15). Alternative camera set-ups to study small mammals exist, either using the camera in combination with a conventional live trap (40) or using the camera in a specifically constructed box (41), but these yield estimates that cannot simply be combined with passage rates of larger hosts. A possible solution is to simply mount the camera traps closer to the ground, which increases the probability of detecting small mammals and birds (23, 42). This would allow measuring passage frequencies of all hosts with a single method. One drawback, however, is that placement closer to the soil surface is at the cost of depth in the view, which will make the estimation of rcam and θcam for larger species harder.
The method could be further improved by considering movement patterns of hosts. For now, we have weighted every animal passage equally. However, the opportunity for a tick to contact a host will differ between animals running past in a matter of seconds, and animals foraging in front of the camera, moving back and forth for several minutes. This difference could be taken into account by measuring the actual movement distance and/or time spent in front of the camera, as was done by Rowcliffe et al. (43). Such refinement should further increase the value of the passage rate as an estimate of host availability to ticks.
Our example setup did not allow us to determine fluctuations in host availability over the seasons, because the number of camera traps present in each site at any one moment was too low while the deployment time of each camera trap was rather long. Thus, we could only analyze yearly averages, and missed fluctuations in host availability or tick density throughout the season. This could be improved by increasing the number of camera traps per site and by shortening the deployment time for each individual camera trap, to for example 7 days rather than 28 days, in order to increase the number of deployments in a site. In that way, bias due to camera placement within each season is reduced and analyses can be performed on a temporal scale.
Our index of passage rate assumes that ticks are randomly distributed compared to the movement of their hosts. As ticks quest close to the spot where they dropped off the host during their previous blood meal or the blood meal of their mother, this assumption might not be valid in relation to the species of host of that previous blood meal. However, for very generalist species such as the sheep tick, the distribution of ticks in relation to the movement of all other host species might be random. More studies relating the distribution of questing ticks to the movement of hosts are needed to further test this assumption.
Furthermore, while we have demonstrated that passage rates give sensible results as an index of the strength of interaction between ticks and their hosts, the approach also has potential as a quantitative estimator of contact rate, a key parameter needed in models of tick population dynamics (44, 45). This could be done by using equations 3 or 4 with an estimate of rtick (distance of approach between host and tick required for a tick to attach to the host) to predict host-tick contact rate. This potentially offers a new way of parameterizing disease transmission models. However, for this approach to be credible, further work is required to derive robust estimates of host-tick detection distance.
In conclusion, the availability of medium- to large-sized mammalian hosts to ticks can be estimated using randomly-placed camera traps. We show that these passage rates are directly proportional to the encounter rate between hosts and ticks, which can be used to model tick population dynamics in situations with differing host availability. Passage rates estimated with camera traps also have potential as estimates of host availability to other parasites or pathogens that are encountered in the environment, such as Francisella tularensis or Puumala hanta virus (46, 47). Furthermore, the camera-trap data that must be acquired to estimate passage rates can also be used to estimate other parameters relevant to disease transmission such as the probability of different host species meeting in space or time (48).
Author Contributions
TH and PJ jointly designed the study, performed the analyses, and wrote the manuscript; TH collected the data; JR provided the theoretical underpinning of the method; all authors approved the final version of the manuscript.
Conflict of Interest Statement
The authors declare that the research was conducted in the absence of any commercial or financial relationships that could be construed as a potential conflict of interest.
Acknowledgments
We thank Wouter Koenders and Frans Jacobs for their help during fieldwork; all land owners for permissions; Hein Sprong and Sip van Wieren for discussions; and Yorick Liefting for help with the management of camera trap data. We would like to thank two anonymous reviewers for their constructive comments on an earlier version of this manuscript.
Funding
This study was financed by the Netherlands Ministry of Health, Welfare and Sport.
Supplementary Material
The Supplementary Material for this article can be found online at https://www.frontiersin.org/article/10.3389/fvets.2017.00115/full#supplementary-material.
References
1. Jongejan F, Uilenberg G. The global importance of ticks. Parasitology (2004) 129:S3–14. doi:10.1017/s0031182004005967
2. Randolph SE. Tick ecology: processes and patterns behind the epidemiological risk posed by ixodid ticks as vectors. Parasitology (2004) 129:S37–65. doi:10.1017/s0031182004004925
3. Van Buskirk J, Ostfeld RS. Controlling Lyme disease by modifying the density and species composition of tick hosts. Ecol Appl (1995) 5(4):1133–40. doi:10.2307/2269360
4. Wilson GJ, Delahay RJ. A review of methods to estimate the abundance of terrestrial carnivores using field signs and observation. Wildl Res (2001) 28(2):151–64. doi:10.1071/WR00033
5. Gray JS. The ecology of ticks transmitting Lyme borreliosis. Exp Appl Acarol (1998) 22(5):249–58. doi:10.1023/a:1006070416135
6. LoGiudice K, Ostfeld RS, Schmidt KA, Keesing F. The ecology of infectious disease: effects of host diversity and community composition on Lyme disease risk. Proc Natl Acad Sci U S A (2003) 100(2):567–71. doi:10.1073/pnas.0233733100
7. Tufto J, Andersen R, Linnell J. Habitat use and ecological correlates of home range size in a small cervid: the roe deer. J Anim Ecol (1996) 65(6):715–24. doi:10.2307/5670
8. Gilbert L, Maffey GL, Ramsay SL, Hester AJ. The effect of deer management on the abundance of Ixodes ricinus in Scotland. Ecol Appl (2012) 22(2):658–67. doi:10.1890/11-0458.1
9. Ruiz-Fons F, Fernandez-de-Mera IG, Acevedo P, Gortazar C, de la Fuente J. Factors driving the abundance of Ixodes ricinus ticks and the prevalence of zoonotic I. ricinus-borne pathogens in natural foci. Appl Environ Microbiol (2012) 78(8):2669–76. doi:10.1128/aem.06564-11
10. Neff DJ. The pellet-group count technique for big game trend, census, and distribution: a review. J Wildl Manage (1968) 32(3):597–614. doi:10.2307/3798941
11. Birks J, Messenger J, Braithwaite T, Davison A, Brookes R, Strachan C. Are scat surveys a reliable method for assessing distribution and population status of pine martens? In: Harrison DJ, Fuller AK, Proulx G, editors. Martens and Fishers (Martes) in Human-Altered Environments: An International Perspective. Boston, MA: Springer US (2005). p. 235–52.
12. Welbourne DJ, Claridge AW, Paull DJ, Lambert A. How do passive infrared triggered camera traps operate and why does it matter? Breaking down common misconceptions. Remote Sens Ecol Conserv (2016) 2(2):77–83. doi:10.1002/rse2.20
13. Carbone C, Christie S, Conforti K, Coulson T, Franklin N, Ginsberg JR, et al. The use of photographic rates to estimate densities of tigers and other cryptic mammals. Anim Conserv (2001) 4(1):75–9. doi:10.1017/S1367943001001081
14. Mccoy KD, Léger E, Dietrich M. Host specialization in ticks and transmission of tick-borne diseases: a review. Front Cell Infect Microbiol (2013) 3:57. doi:10.3389/fcimb.2013.00057
15. Hofmeester TR, Rowcliffe JM, Jansen PA. A simple method for estimating the effective detection distance of camera traps. Remote Sens Ecol Conserv (2017) 3(2):81–9. doi:10.1002/rse2.25
16. Tagliapietra V, Rosa R, Arnoldi D, Cagnacci F, Capelli G, Montarsi F, et al. Saturation deficit and deer density affect questing activity and local abundance of Ixodes ricinus (Acari, Ixodidae) in Italy. Vet Parasitol (2011) 183(1–2):114–24. doi:10.1016/j.vetpar.2011.07.022
17. Balashov YS. Bloodsucking Ticks (Ixodoidea) – Vectors of Diseases of Man and Animals. Leningrad: Nauka Publishers (1968).
18. Carroll JF, Mills GD, Schmidtmann ET. Patterns of activity in host-seeking adult Ixodes scapularis (Acari: Ixodidae) and host-produced kairomones. J Med Entomol (1998) 35(1):11–5. doi:10.1093/jmedent/35.1.11
19. Gerritsen J, Strickler JR. Encounter probabilities and community structure in zooplankton: a mathematical model. J Fish Res Board Can (1977) 34(1):73–82. doi:10.1139/f77-008
20. Rowcliffe JM, Field J, Turvey ST, Carbone C. Estimating animal density using camera traps without the need for individual recognition. J Appl Ecol (2008) 45(4):1228–36. doi:10.1111/j.1365-2664.2008.01473.x
21. Lucas TCD, Moorcroft EA, Freeman R, Rowcliffe JM, Jones KE. A generalised random encounter model for estimating animal density with remote sensor data. Methods Ecol Evol (2015) 6:500–9. doi:10.1111/2041-210x.12346
22. Caravaggi A, Zaccaroni M, Riga F, Schai-Braun SC, Dick JTA, Montgomery WI, et al. An invasive-native mammalian species replacement process captured by camera trap survey random encounter models. Remote Sens Ecol Conserv (2016) 2(1):45–58. doi:10.1002/rse2.11
23. Rowcliffe JM, Carbone C, Jansen PA, Kays R, Kranstauber B. Quantifying the sensitivity of camera traps: an adapted distance sampling approach. Methods Ecol Evol (2011) 2(5):464–76. doi:10.1111/j.2041-210X.2011.00094.x
24. Hofmeester TR, Coipan EC, van Wieren SE, Prins HHT, Takken W, Sprong H. Few vertebrate species dominate the Borrelia burgdorferi s.l. life cycle. Environ Res Lett (2016) 11(4):043001. doi:10.1088/1748-9326/11/4/043001
25. Broekhuizen S, Spoelstra K, Thissen JBM, Canters KJ, Buys JC. Atlas van de Nederlandse Zoogdieren. Zeist: KNNV Uitgeverij (2016).
26. Anderson JF, Magnarelli LA. Epizootiology of Lyme disease-causing borreliae. Clin Dermatol (1993) 11:339–51. doi:10.1016/0738-081X(93)90088-T
27. Gassner F, van Vliet AJH, Burgers S, Jacobs F, Verbaarschot P, Hovius EKE, et al. Geographic and temporal variations in population dynamics of Ixodes ricinus and associated Borrelia infections in the Netherlands. Vector Borne Zoonotic Dis (2011) 11(5):523–32. doi:10.1089/vbz.2010.0026
28. Kays R, Kranstauber B, Jansen P, Carbone C, Rowcliffe M, Fountain T, et al., editors. Camera traps as sensor networks for monitoring animal communities. 2009 IEEE 34th Conference on Local Computer Networks, LCN 2009. Zurich (2009).
29. Jones KE, Bielby J, Cardillo M, Fritz SA, O’Dell J, Orme CDL, et al. PanTHERIA: a species-level database of life history, ecology, and geography of extant and recently extinct mammals. Ecology (2009) 90(9):2648. doi:10.1890/08-1494.1
30. Takken W, van Vliet AJH, Verhulst NO, Jacobs FHH, Gassner F, Hartemink N, et al. Acarological risk of Borrelia burgdorferi sensu lato infections across space and time in The Netherlands. Vector Borne Zoonotic Dis (2017) 17(2):99–107. doi:10.1089/vbz.2015.1933
31. Tack W, Madder M, De Frenne P, Vanhellemont M, Gruwez R, Verheyen K. The effects of sampling method and vegetation type on the estimated abundance of Ixodes ricinus ticks in forests. Exp Appl Acarol (2011) 54(3):285–92. doi:10.1007/s10493-011-9444-6
32. Mejlon HA, Jaenson TGT. Questing behaviour of Ixodes ricinus ticks (Acari: Ixodidae). Exp Appl Acarol (1997) 21(12):747–54. doi:10.1023/a:1018421105231
33. Oksanen J, Blanchet FG, Friendly M, Kindt R, Legendre P, McGlinn D, et al. vegan: Community Ecology Package (2016). Available from: https://CRAN.R-project.org/package=vegan
34. R Core Team. R: A Language and Environment for Statistical Computing. Vienna, Austria: R Foundation for Statistical Computing (2015).
35. Meyer NFV, Esser HJ, Moreno R, van Langevelde F, Liefting Y, Ros Oller D, et al. An assessment of the terrestrial mammal communities in forests of Central Panama, using camera-trap surveys. J Nat Conserv (2015) 26:28–35. doi:10.1016/j.jnc.2015.04.003
36. Jongman RHG, Ter Braak CJF, van Tongeren OFR. Data Analysis in Community and Landscape Ecology. Wageningen, the Netherlands: Centre for Agricultural Publishing and Documentation (Pudoc) (1987).
37. Wauters L, Swinnen C, Dhondt AA. Activity budget and foraging behaviour of red squirrels (Sciurus vulgaris) in coniferous and deciduous habitats. J Zool (1992) 227(1):71–86. doi:10.1111/j.1469-7998.1992.tb04345.x
38. Levi T, Kilpatrick AM, Mangel M, Wilmers CC. Deer, predators, and the emergence of Lyme disease. Proc Natl Acad Sci U S A (2012) 109(27):10942–7. doi:10.1073/pnas.1204536109
39. Hofmeester TR, Jansen PA, Wijnen HJ, Coipan EC, Fonville M, Prins HHT, et al. Cascading effects of changes in vertebrate assemblages on rodent-transmitted tick-borne pathogens. Proc R Soc B (in press). doi:10.1098/rspb.2017.0453
40. Villette P, Krebs CJ, Jung TS, Boonstra R. Can camera trapping provide accurate estimates of small mammal (Myodes rutilus and Peromyscus maniculatus) density in the boreal forest? J Mammal (2016) 97:32–40. doi:10.1093/jmammal/gyv150
41. Soininen EM, Jensvoll I, Killengreen ST, Ims RA. Under the snow: a new camera trap opens the white box of subnivean ecology. Remote Sens Ecol Conserv (2015) 1(1):29–38. doi:10.1002/rse2.2
42. O’Brien TG, Kinnaird MF. A picture is worth a thousand words: the application of camera trapping to the study of birds. Bird Conserv Int (2008) 18(Suppl S1):S144–62. doi:10.1017/S0959270908000348
43. Rowcliffe JM, Jansen PA, Kays R, Kranstauber B, Carbone C. Wildlife speed cameras: measuring animal travel speed and day range using camera traps. Remote Sens Ecol Conserv (2016) 2:84–94. doi:10.1002/rse2.17
44. Dobson ADM, Finnie TJR, Randolph SE. A modified matrix model to describe the seasonal population ecology of the European tick Ixodes ricinus. J Appl Ecol (2011) 48(4):1017–28. doi:10.1111/j.1365-2664.2011.02003.x
45. Rosa R, Pugliese A. Effects of tick population dynamics and host densities on the persistence of tick-borne infections. Math Biosci (2007) 208(1):216–40. doi:10.1016/j.mbs.2006.10.002
46. Gyuranecz M, Rigó K, Dán A, Földvári G, Makrai L, Dénes B, et al. Investigation of the ecology of Francisella tularensis during an inter-epizootic period. Vector Borne Zoonotic Dis (2011) 11(8):1031–5. doi:10.1089/vbz.2010.0091
47. Kallio ER, Klingström J, Gustafsson E, Manni T, Vaheri A, Henttonen H, et al. Prolonged survival of Puumala hantavirus outside the host: evidence for indirect transmission via the environment. J Gen Virol (2006) 87(8):2127–34. doi:10.1099/vir.0.81643-0
Keywords: contact rate, forest wildlife, gas theory, tick-borne disease, passage rate, host availability, Ixodes ricinus, remote sensing
Citation: Hofmeester TR, Rowcliffe JM and Jansen PA (2017) Quantifying the Availability of Vertebrate Hosts to Ticks: A Camera-Trapping Approach. Front. Vet. Sci. 4:115. doi: 10.3389/fvets.2017.00115
Received: 20 April 2017; Accepted: 03 July 2017;
Published: 19 July 2017
Edited by:
Joaquin Vicente, Universidad de Castilla-La Mancha, SpainReviewed by:
Gerardo Acosta-Jamett, Austral University of Chile, ChileAndrew William Byrne, Agri Food and Biosciences Institute, United Kingdom
Copyright: © 2017 Hofmeester, Rowcliffe and Jansen. This is an open-access article distributed under the terms of the Creative Commons Attribution License (CC BY). The use, distribution or reproduction in other forums is permitted, provided the original author(s) or licensor are credited and that the original publication in this journal is cited, in accordance with accepted academic practice. No use, distribution or reproduction is permitted which does not comply with these terms.
*Correspondence: Tim R. Hofmeester, t.hofmeester@gmail.com