Lateral Saturated Hydraulic Conductivity of Soil Horizons Evaluated in Large-Volume Soil Monoliths
by
 , , and
Mario Pirastru
1,* ,
,
Roberto Marrosu
1,
Simone Di Prima
1,
Saskia Keesstra
2, 
Filippo Giadrossich
1 and
and
Marcello Niedda
1 1
Agricultural Department, University of Sassari, Viale Italia, 39, 07100 Sassari, Italy
2
Soil Physics and Land Management Group, Wageningen University, Droevendaalsesteeg 4, 6708PB Wageningen, The Netherlands
*
Author to whom correspondence should be addressed.
Water 2017, 9(11), 862; https://doi.org/10.3390/w9110862
Submission received: 26 September 2017
/
Revised: 21 October 2017
/
Accepted: 2 November 2017
/
Published: 6 November 2017
(This article belongs to the Special Issue Soil Water Conservation: Dynamics and Impact)
Abstract
:Evaluating the lateral saturated hydraulic conductivity, Ks,l, of soil horizons is crucial for understanding and modelling the subsurface flow dynamics in many shallow hill soils. A Ks,l measurement method should be able to catch the effects of soil heterogeneities governing hydrological processes at the scale of interest, in order to yield Ks,l representative values over large spatial scales. This study aims to develop a field technique to determine spatially representative Ks,l values of soil horizons of an experimental hillslope. Drainage experiments were performed on soil monoliths of about 0.12 m3 volume, encased in situ with polyurethane foam. Median Ks,l of 2450 mm·h−1 and 552 mm·h−1 were estimated in the A and B horizon, respectively. In the upper part of the B horizon, the median Ks,l was 490 mm·h−1, whereas it mostly halved near the underlying restricting layer. The decline of Ks,l values with depth was consistent with the water-table dynamics observed at the same site in previous studies. Moreover, the Ks,l from the monoliths were in line with large spatial-scale Ks,l values reported from the hillslope in a prior investigation based on drain data analysis. This indicated that the large-scale hydrological effects of the macropore network were well represented in the investigated soil blocks. Our findings suggest that performing drainage experiments on large-volume monoliths is a promising method for characterizing lateral conductivities over large spatial scales. This information could improve our understanding of hydrological processes and can be used to parameterize runoff-generation models at hillslope and catchment scale.
1. Introduction
In many hillslopes with shallow steep soils, the spatial and temporal dynamics of the perched water table are dominated by the lateral (namely slope-parallel) saturated subsurface flow. These water tables often originate from infiltrated precipitation that is hindered from further downwards percolation by restrictive layers beneath soils, e.g., fragipan in [1], argillic Bt horizon in [2], and weathered granite in [3]. Then, the water flows towards the footslope, where it can reach the surface once again and produces runoff [4,5,6]. In most cases, the preferential flow via macropores controls this runoff-generation process [1,3,7,8]. The lateral saturated hydraulic conductivity, Ks,l, is the soil property that influences transmission rate of the lateral subsurface water flow [9,10].
In layered soils on hillslopes, soil horizons can differ in hydraulic conductivity by orders of magnitude [9,10,11]. Evaluating the hydraulic conductivity of each soil horizon is fundamental to understanding the subsurface flow dynamics of these hillslopes. Moreover, it is necessary to characterize the vertical variability of the hydraulic conductivity in order to model consistently the spatial and temporal soil hydrological dynamics. The vertical architecture of the permeability also controls the dynamics of nutrients and pollutants, as revealed by a number of tracer experiments in natural and agricultural landscapes [12,13,14]. Many modelling applications assume saturated hydraulic conductivities exponentially declining with depth [15]. As reported by Ameli et al. [16] changing the rate of the exponential Ks,l decline significantly affects model simulation of soil water and solute storage, mixing, and releasing in hillslopes. Hence, the lack of information about the vertical variability of the hydraulic conductivity in soils can be one of the major limitations in the numerical modelling of the hydrological behaviour of hillslopes.
Despite the acknowledged importance of a detailed hydraulic characterization of the soils, few methods have been specifically developed to assess Ks,l values in the field, particularly for steep soils. Therefore, in most cases only laboratory-derived conductivity values are available. Furthermore, it is difficult to obtain Ks,l data that can be representative of large spatial scales, from tens to hundreds of square meters, as the typical cell extents of the grid-based hydrological models. Consequently, some modelers consider the Ks,l as a calibration parameter, without any experimental evaluation (as for example in [17]). In other cases (e.g., [18,19]) runoff-generation models use Ks,l values obtained through methodologies inducing flow processes mainly vertically oriented. Instead, the hydraulic conductivity should be determined in agreement with the modelled flow direction. In fact, anisotropy can cause saturated conductivity to greatly differ with flow direction (e.g., [20,21]).
A useful approach for determining representative Ks,l values of macroporous soil is to perform drainage experiments in large-volume soil blocks, or monoliths, encased in situ with impermeable material. These experiments constrain the water flow along a prescribed direction through the soil, in order to define unambiguously the terms of Darcy’s law [22,23]. Field procedures for evaluating the Ks,l in large soil samples are reported, among others, by Blanco-Canqui et al. [24] and Mendoza and Steenhuis [23]. The latter described a device called a “hillslope infiltrometer” by which the lateral drainage from each horizon of a layered soil was collected. The drainage rates were used to compute specific Ks,l values of the soil horizons.
Both Blanco-Canqui et al. [24] and Mendoza and Steenhuis [23] in their field applications used steel plates to enclose and hydraulically isolate the soil blocks. In some cases, metal-sheet insertion may be too cumbersome, especially in stony soils. Expandable polyurethane foam can be more conveniently used in situ as material encasing the soil blocks. The foam is used as waterproof material to obtain soil bulk density data with the excavation method [25,26,27], and to study the hydraulic soil anisotropy by measuring hydraulic conductivities in the laboratory on small cubes [28,29] or on large soil cores [30]. To our knowledge, the suitability of the expandable polyurethane foam for support in situ Ks,l experimental investigations has not been tested until now. The foam is purchased in pressurized cans, which are easy to transport to the field. It is waterproof, fast to apply, and it adheres to the irregular soil surfaces preventing bypass flow at the edges of the samples.
This paper focuses on field experiments aimed at evaluating the Ks,l of the shallow soil of a steep hillslope. The measurements were carried out on monoliths encased in situ with expandable polyurethane foam. The soil surface and volume of the monoliths were on average about 0.4 m2 and 0.12 m3, respectively. Hence, the sample soil sizes were larger than the commonly sampled sizes through laboratory and field methods, with the exception of studies based on either drain or trench measurements. By saturating decreasing soil thicknesses during each experiment, the Ks,l for each soil horizon was detected. Using the method illustrated in this paper, we aim to obtain, with a sustainable effort, field soil data that are useful for interpreting the hydrological response of hillslopes, and that can be used to parameterize hydrological models. The specific objectives of the research are: (1) to design a method to determine in field soil Ks,l values; (2) to assess the Ks,l variability in the soil vertical profile, in order to obtain Ks,l values for each soil horizon; (3) to evaluate spatially representative Ks,l values for the soil horizons in the studied hillslope.
2. Material and Methods
2.1. Location
The experiments were carried out in the Baratz Lake watershed, in north-west Sardinia, Italy. The study site (Figure 1a) is the steep side of a hill (40°41′53.36″ N, 8°14′4.15″ E) with elevations ranging from 50 m to 65 m a.s.l. and mean slope of 30%. The area is a firebreak about 60 m long and 15 m wide with a mainly herbaceous coverage, bounded by Mediterranean maquis [31]. The soil is a sandy loam Lithic Haploxerepts, ranging in depth from 30 cm to 40 cm. The soil horizons are Ap (0–15 cm), BW and C [32]. The latter is a dense altered Permian sandstone acting as restrictive layer. In the remainder of the text, A, B and “restrictive layer” are substituted for the Ap, BW and “C horizon”, respectively. The climate is semiarid Mediterranean, with mild winters, warm summers and high water deficit from April to September. The average annual precipitation is about 600 mm, mainly falling from autumn to spring. The potential evapotranspiration is around 1000 mm per year [33].
2.2. Soil Monolith Preparation
In winter 2017 four soil monoliths, represented by letters MA, MB, MC and MD, were carved out on selected locations on the hillslope. Soil blocks, each approximately 50 cm wide, 105 cm long and 70 cm deep (Figure 1b), extending for about 40 cm within the restrictive layer, were obtained by hand digging 20 cm-wide enclosing trenches. Vegetation at the monolith surfaces was preserved and the roots spreading out from the exposed faces were gently cut. Expandable polyurethane foam was injected to fill about 70% of the trench volume. Pressurized cans of 750 mL, each providing 0.05 m3 of expanded foam, were used. Wooden boards were placed on top of the trenches to constrain the foam expansion. The boards forced the foam expansion towards the trench and monolith sides in order to achieve a tight contact between the foam and the irregular block surfaces. This was essential for minimizing leakages between the soil and the foam at the monolith edges during the drainage experiments. After 24 h, the expanded foam completely backfilled the trenches, and any foam excess was cut off. Consequently, two 16 cm-wide pits were excavated to the depth of the restrictive layer at the uphill and downhill internal sides of the foam barriers. Inflow and outflow pits were, therefore, created, hereby noted as IP and OP respectively (Figure 1b). At the end, the resulting monoliths had soil volumes ranging from 0.1 m3 to 0.16 m3. Table 1 reports the dimensions of each sampled monolith.
2.3. Instrumentation
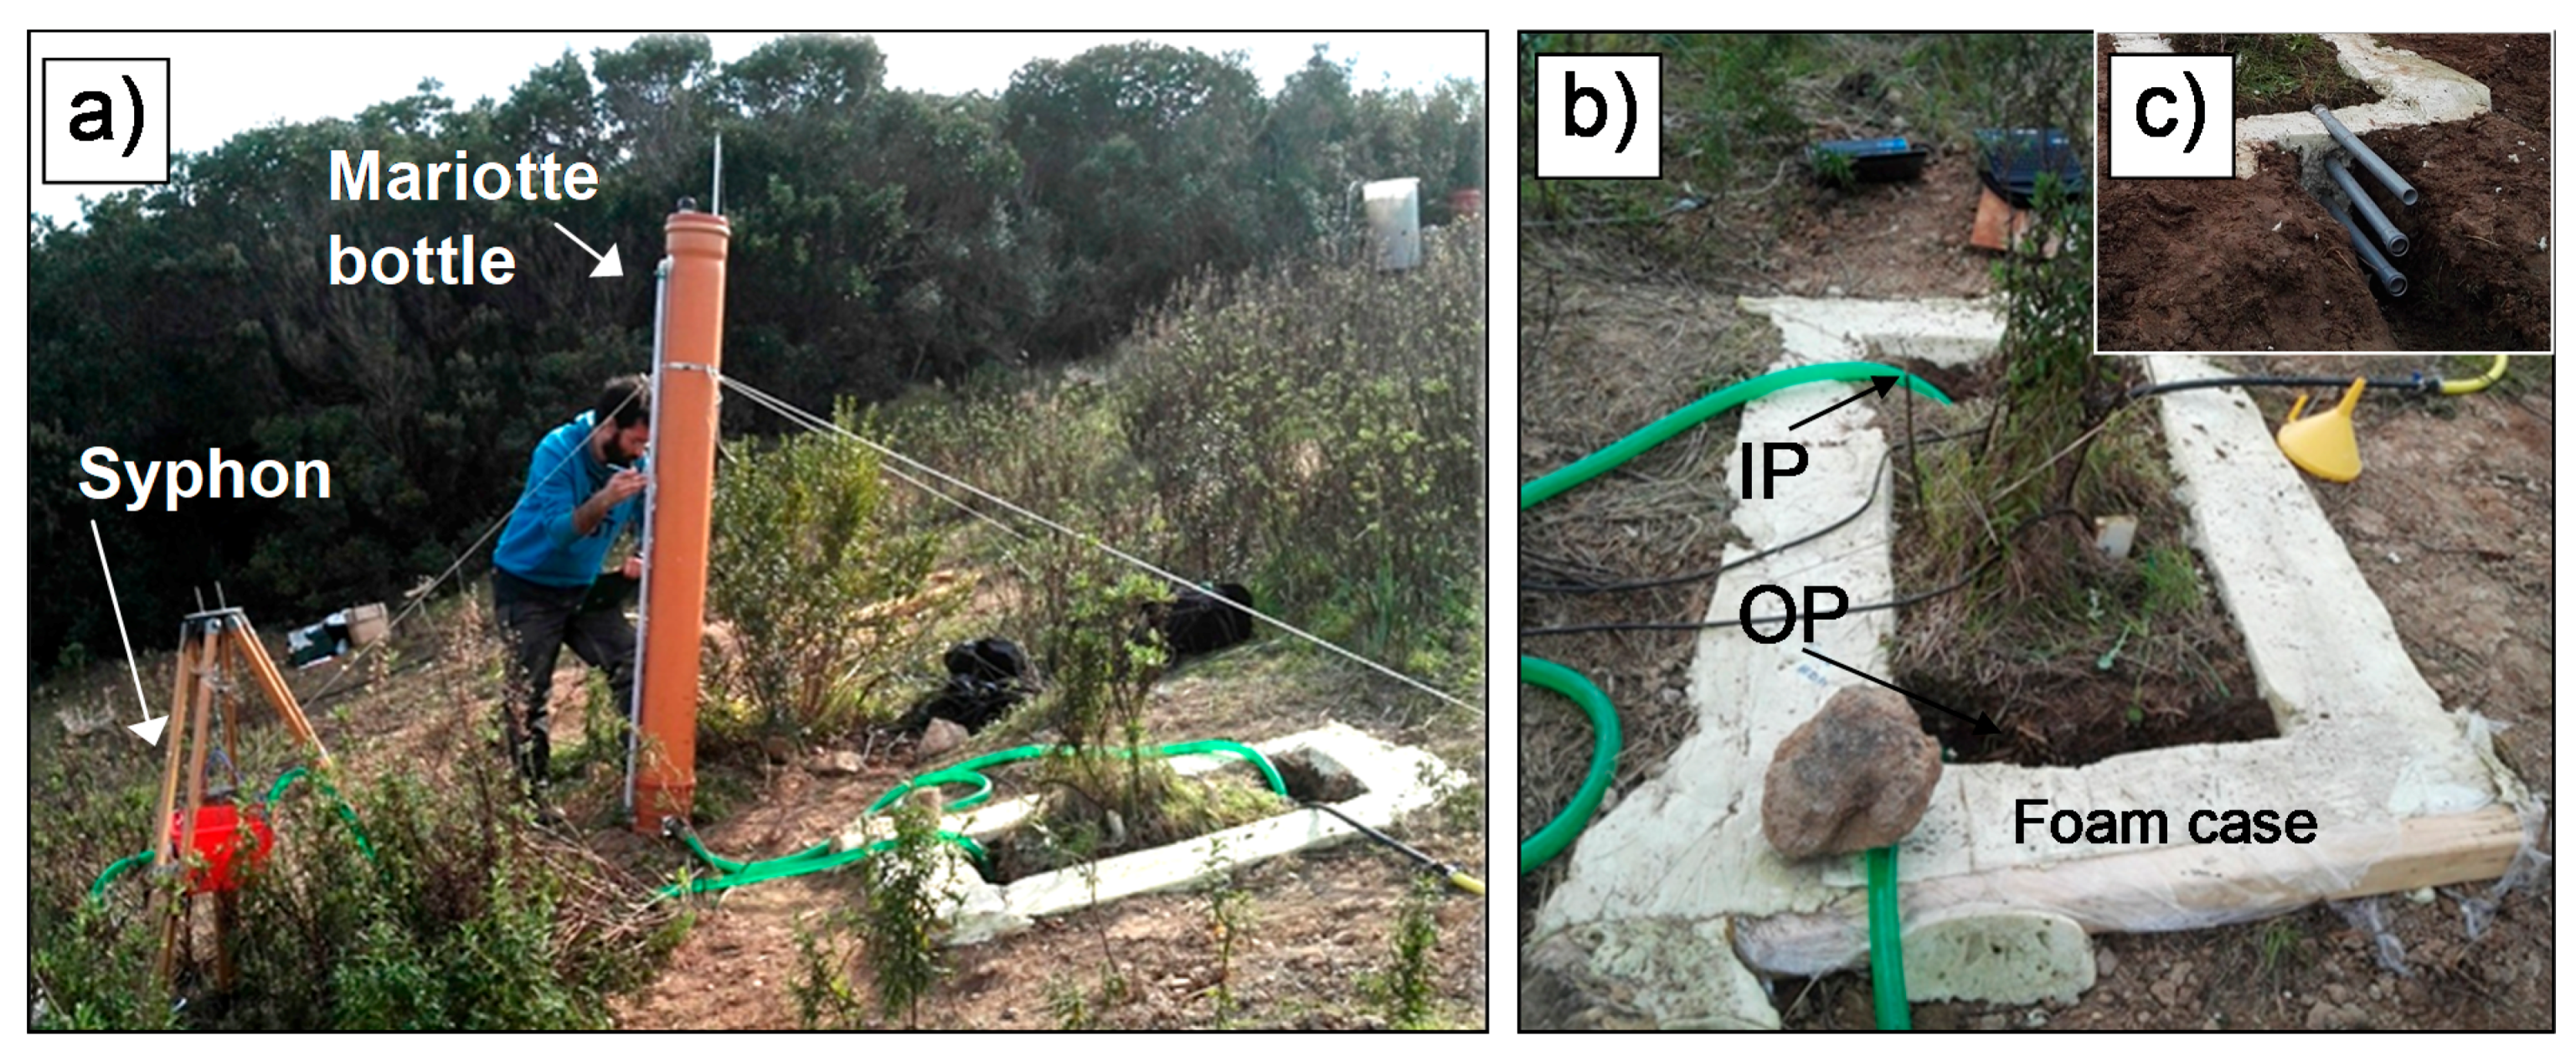
A custom-built Mariotte bottle supplied water and regulated the water level in the IP during the experiments (Figure 1a and Figure 2). It was a 2 m-high PVC pipe with the capacity of about 0.06 m3. The water level in the IP was set by adjusting in height the air-entry tube inlet of the bottle. The bottle discharged into the IP within a fissured PVC pipe wrapped with geotextile to minimize flow turbulence when the bottle outlet-tap was turned on. The discharged volume was computed from the lowering water level measured in the transparent level gauge of the bottle, which had a resolution of 1 mm (28.6 mL·mm−1). Accuracy of the Mariotte device was tested for several discharge rates (from 0.6–4.1 L·min−1, the maximum discharge allowed by the bottle) by measuring the water volumes flowing from the bottle outlet. The mean relative error among the collected volumes and the estimated ones with the readings taken at the bottle was 0.6%, which was considered acceptable for the purposes of this study.
At the MA, MB and MC monoliths, a syphon system was used both to maintain the prescribed water levels into the OP and to measure the outgoing drainage. The syphon system consisted of a vacuum tube connecting the pit to a small water tank with spillway. The tank hung from a tripod by a rope and pulley, so as to finely tune the reservoir elevation and the water level within the OP accordingly. For a prescribed elevation, the outflow from the spillway was the drainage through the soil monoliths. The outgoing flow discharged into a bucket and was weighted with a scale (5 g of resolution). In monolith MD, the system was slightly different as for the water level control and the collection of the drainage, since pipes through the foam were inserted as spillways in OP (Figure 1c). This was done by removing the resting soil from the outside-down foam wall of the OP. The foam was holed in order to place three spillway pipes at prescribed levels, then any gap between the pipes and foam was resealed.
2.4. Drainage Experiments
At first, water was poured into the IP from a storage reservoir located at the top of the hillslope. The water level was slowly increased until it reached the depth of 5 cm below the soil surface. The same water-level depth (WLD) was achieved in the OP by the water that flowed through the soil monolith. At the WLD of 5 cm in the OP, water started flowing in the vacuum tube of the syphon system (monoliths MA to MC), or through the spillway inserted in the foam at that depth (MD). At that moment, we started to feed the IP through the Mariotte bottle and to measure the flow rates. This procedure of soil saturation from below was chosen because it was similar to the bottom-up saturation process that took place during the natural rainfall events, as reported in Pirastru et al. [32] for the same area. Moreover, visual inspection of the exposed seepage soil face in the OP at the beginning of the drainage reveals the dominant flow processes, i.e., preferential or uniform flows, which helps data interpretation.
For each monolith, the WLDs of 5 cm, 15 cm and 25 cm in both inflow and outflow pits were sequentially imposed. The top 5 cm of soil was excluded to avoid water-table cross depressions at the soil surface. The water levels were changed when either the flows became steady or the time of the stage with a prescribed level lasted over 1.5 h. The inflows and outflows were considered steady once the rate variations were below the instrumental resolutions for more than at least 30 min. The WLD transitions were achieved by first lowering the level in the OP, then waiting for equilibration in the IP until the prescribed depth, over which the bottle restarted supplying water. To measure the low flow rates accurately, the inflows and outflows were monitored by increasing time intervals, namely every 5 min, 10 min and 15 min for WLDs of 5 cm, 15 cm and 25 cm.
2.5. Ks,l Calculation
The Ks,l of the saturated soil layers were estimated by Darcy’s formula:
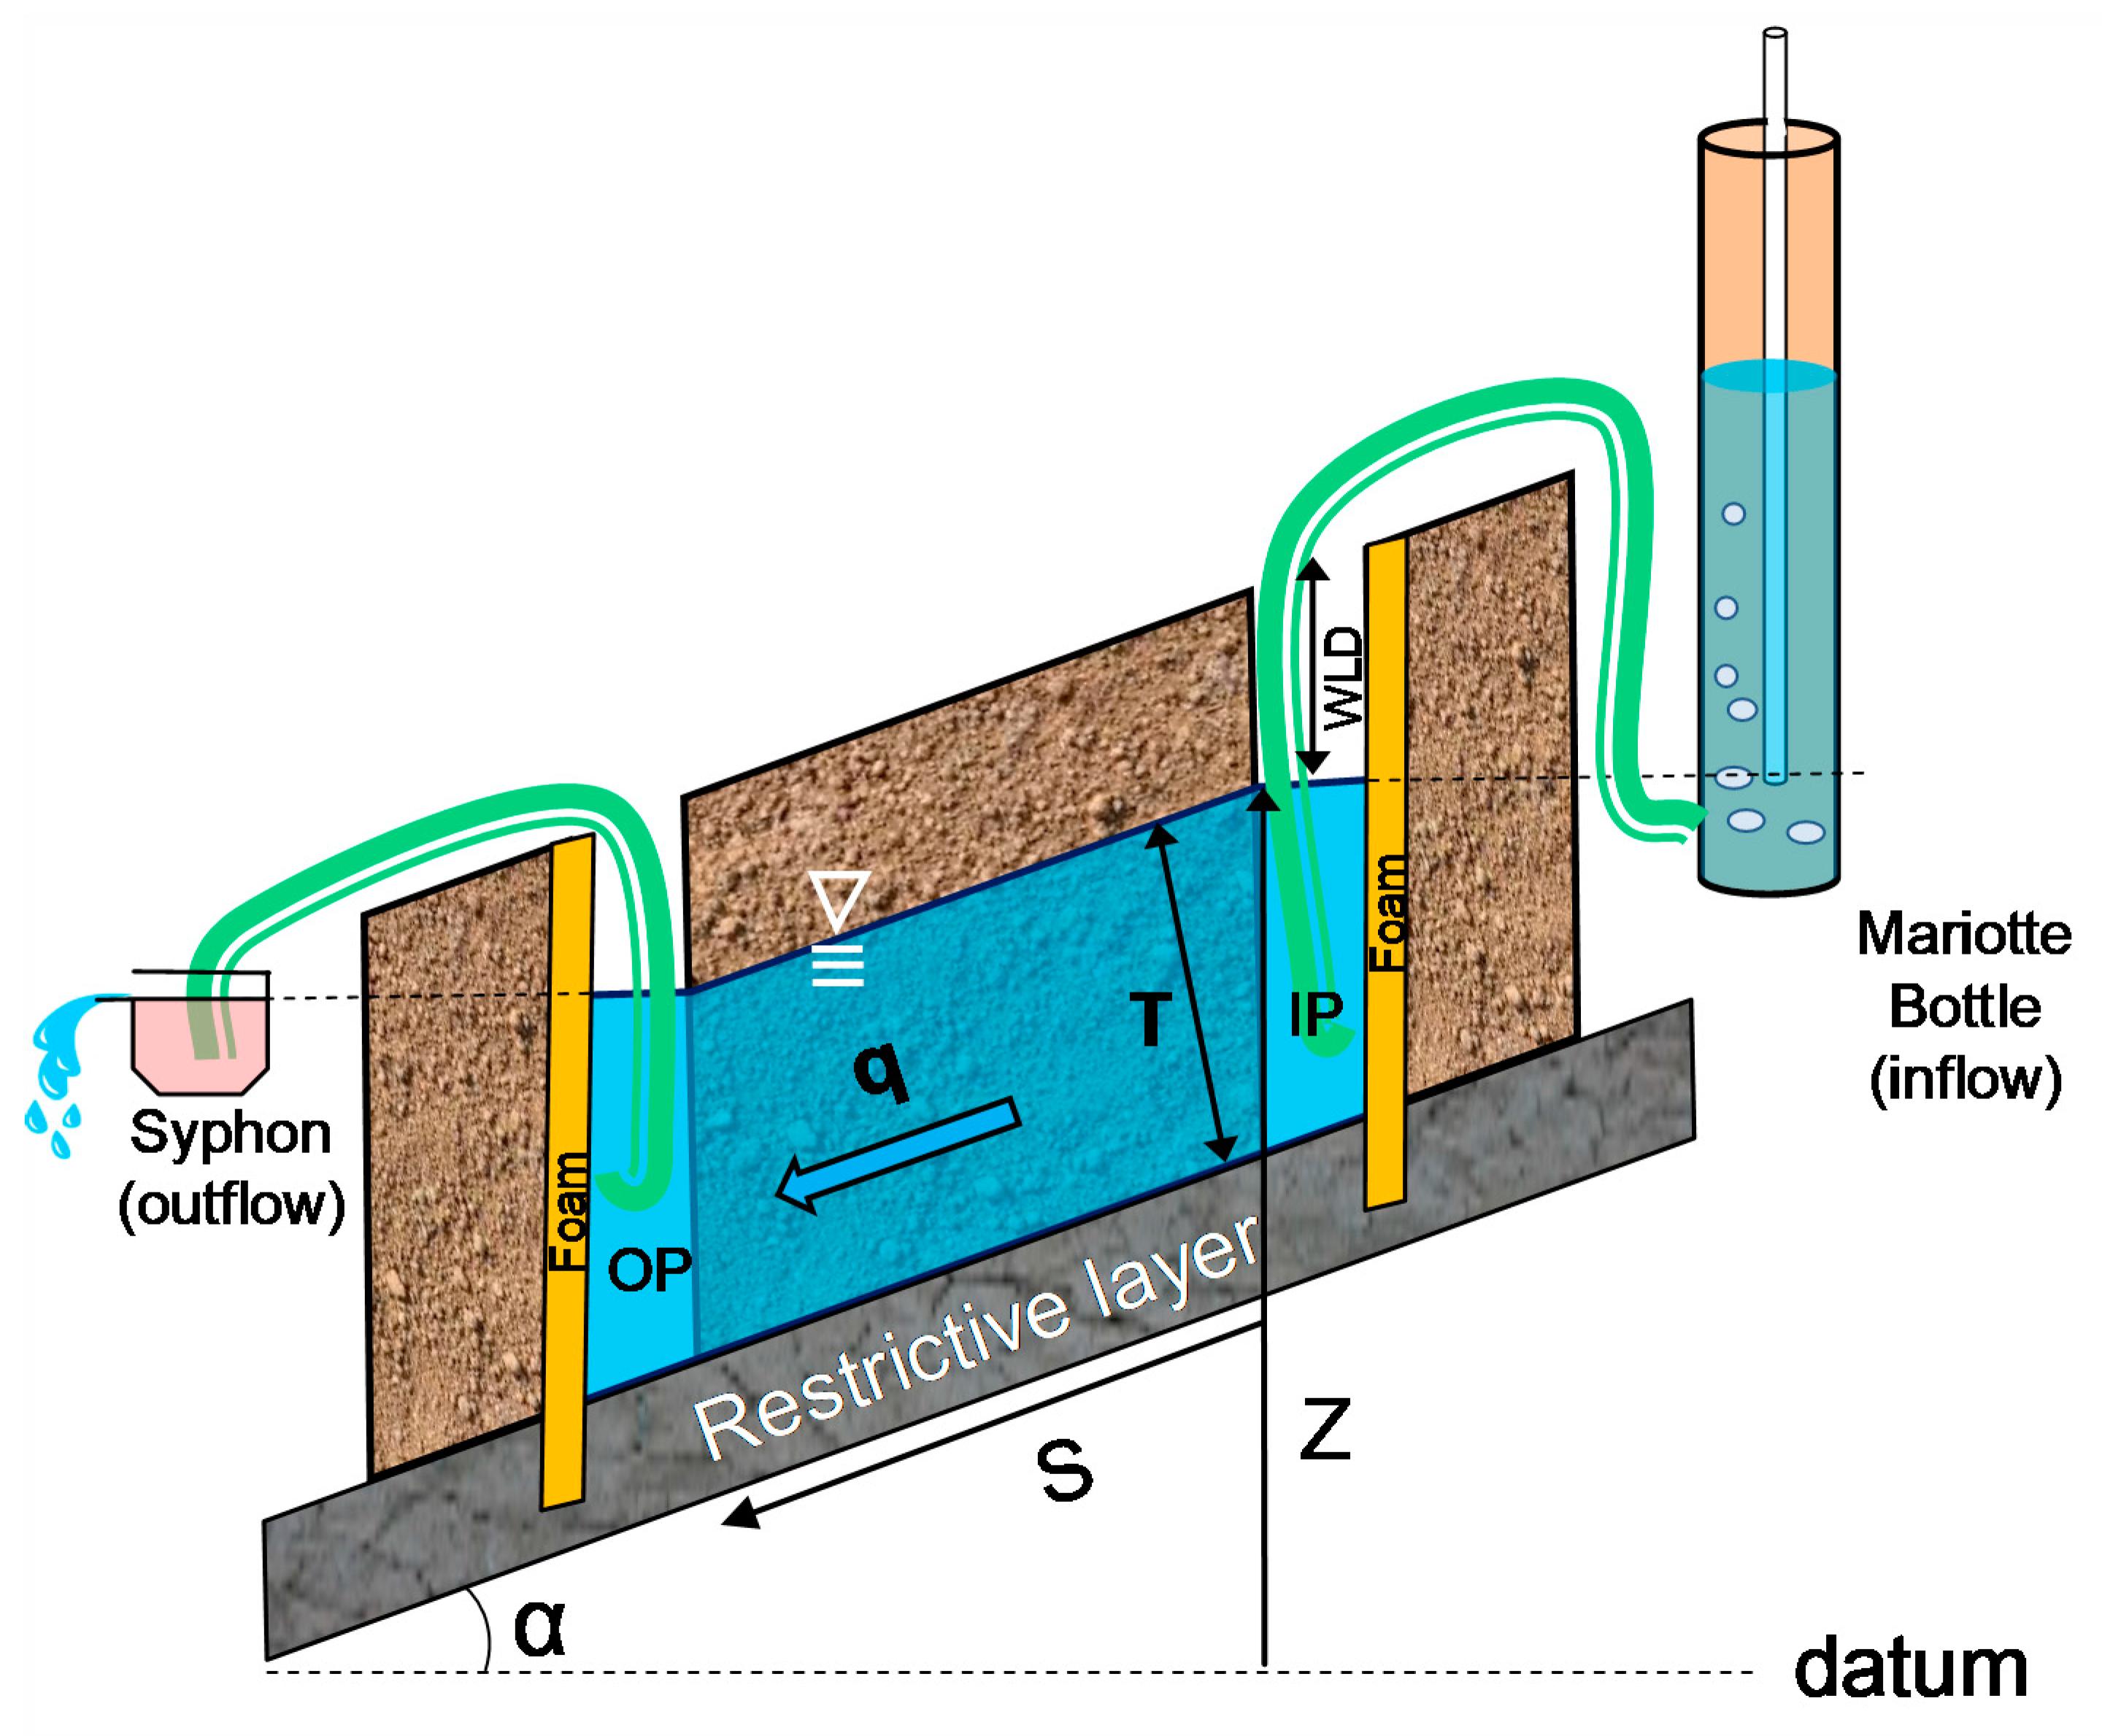
where q [L2·T−1] was the outflow rate per unit width of the monoliths, computed as the mean of the rates over the last half-hour of a stage with a prescribed water level; T was the thickness of the saturated layers, measured perpendicularly to the sloping restrictive layer; and grad φ was the total hydraulic gradient, negative along the flow direction.
The Ks,l value determined by Equation (1) represented the average value of lateral saturated hydraulic conductivities, Ks(z), at a specific elevation z within the soil profile that was saturated [9]. By definition, Ks,l is related to Ks(z) by the following relation:
where z0 and Z are, respectively, the elevation of the restrictive layer and of the water table above an arbitrary datum. The numerator of Equation (2) is the transmissivity of the saturated layer above the restrictive layer, and the denominator is the saturated thickness.
By imposing decreasing water levels in the monolith pits during the drainage experiments, the Ks,l values of three decreasing saturated soil thicknesses on the restrictive layer were computed for each monolith by using Equation (1). These values are denoted by Ks,l WLD5, Ks,l WLD15 and Ks,l WLD25 with reference to the water-level depths sequentially applied. These Ks,l values are then used to calculate the specific Ks,l values of the individual soil layers in each monolith: (i) A horizon, approximately as large as the root zone, from 5 cm to 15 cm of depth; (ii) upper layer of the B horizon, from 15 cm to 25 cm of soil depth; (iii) lower layer of the B horizon profile, from 25 cm to the depth of the restrictive layer. Differentiation in the B horizon was done in order to detect the Ks,l changes in proximity of the restrictive layer. For computing the specific Ks,l of the A horizon, both Ks,l WLD5 and Ks,l WLD15 were used. By denoting with zWLD5 and zWLD15 the elevations above the datum of the water levels 5 cm and 15 cm deep, respectively, the Ks,l of the A horizon was:
The same procedure was applied to compute the specific Ks,l for the upper part of the B profile, but for this layer the Ks,l WLD15 and Ks,l WLD25 values and the proper water-level elevations were used. Finally, the specific Ks,l for the lower part of the B horizon profile was Ks,l WLD25.
3. Results
3.1. Observed Inflow and Outflow Rates
The mean inflow and outflow rates computed over the last 30 min of stages with the three prescribed water levels are shown in Table 2. The greatest decrease in drainage rates with depth was recorded in MC, varying by about two orders of magnitude when it was going from a WLD of 5 cm to 25 cm. For this monolith in particular, we observed quick flow through macropores at the seepage face in the OP when the water level was near the soil surface during the saturation stage, whereas uniform matrix flow dominated the drainage for small saturated soil thicknesses on the restrictive layer (WLD > 15 cm). This was different in MB, where for the same water level variation the outflow decreased by 79%. This monolith gave the highest outflow rates among the monoliths for each set WLD. During the saturation stage, we observed a macropore gushing copiously at the interface between the soil and the restrictive layer. This contributed to sustaining a high soil water transmissivity, despite the lowering of water level.
In the monolith MD, the removal of soil from the downhill foam wall of the outflow pit to permit the spillways insertion caused water leakage below the lower end of the foam, from the OP reservoir towards the surrounding soil. This resulted in a poor outflow collection, although the leakage did not hinder setting of the prescribed water levels throughout the experiment time. At the end of the run, the soil resting against the external walls of the foam was removed, in order to check for traces of leakages around the monolith. Signs of water leakage were not found along the external sides, except for the lower foam edge of the OP. This suggested that the supplied water flowed unaffected through the whole soil sample. Therefore, in the monolith MD the measured inflow was used in place of the outflow in Equation (1) for computing Ks,l.
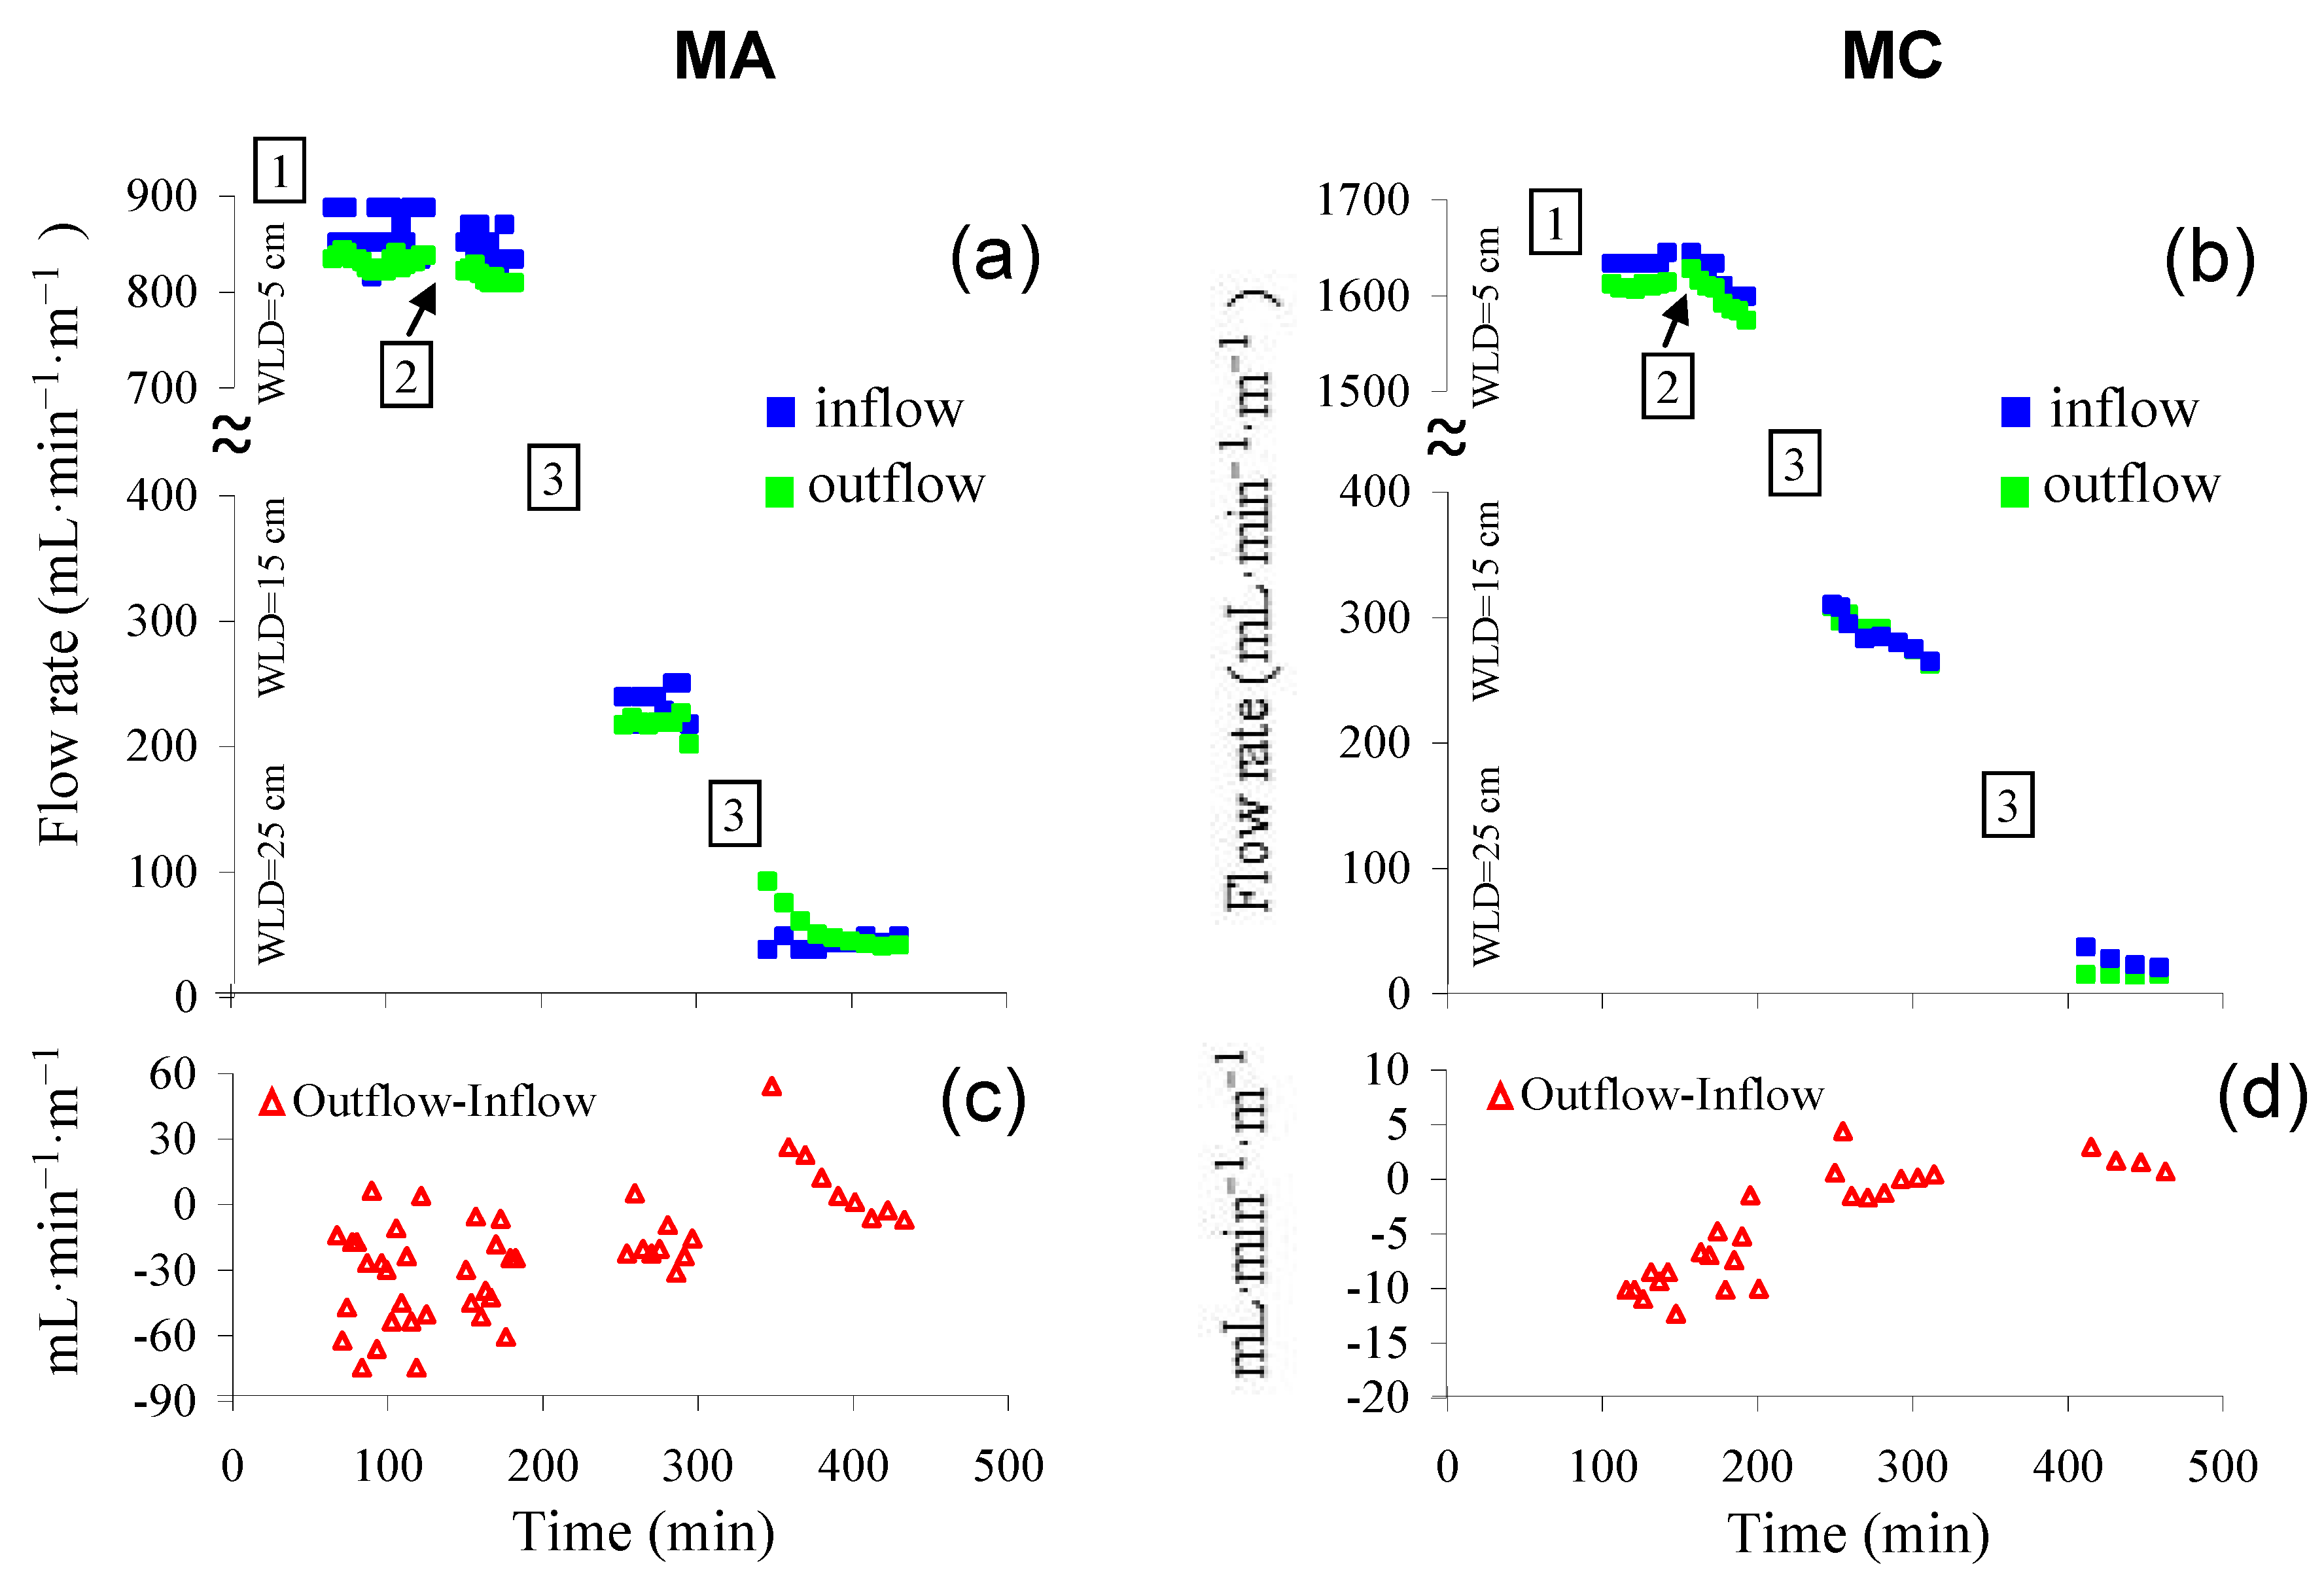
Figure 3a,b show two representative examples of the temporal dynamics of the inflow and outflow rates measured during the drainage experiments. In MA (Figure 3a), the inflows for the water-level depths of 5 cm, 15 cm and 25 cm were almost immediately stable at the beginning of the measurement. The same was true for the outflow rates, except for the imposed WLD of 25 cm. In MC (Figure 3b), for WLD = 5 cm the flows were nearly stable at the start of the measurement, but approximately 140 min after the start of the experiment linearly decreased, and became 3% lower than the initial values after half an hour. A decreasing rate was observed with WLD set to 15 cm as well. Declining flow rates were also observed in MB and MD monoliths when WLD was 5 cm, and in the MD trough at the stage with WLD set to 15 cm. In this last case, a steady-state condition was reached at the end of the stage.
Initially in all the drainage experiment stages with WLD set to 25 cm, the outflow was observed to be in excess of inflow and progressively was converging towards these latter, as shown in Figure 3a,b for MA and MC. This was because the outflow included inflow and vertical drainage from the upper unsaturated soil. The vertical drainage decreased over time due to the progressive desaturating of the unsaturated zone until this approached the hydrostatic equilibrium state.
The differences between the mean rates of outflows and inflows at each end stage of the drainage runs and for the three imposed water levels (Table 2) were on average 11 mL·min−1·m−1 for monoliths MA, MB and MC. The partials of the differences between outflows and inflows through drainage experiments were at the maximum at the start of the runs, and decreased with time, as illustrated in Figure 3c,d for MA and MC, respectively. The scattering of the outflow/inflow difference data points was caused by measuring errors due to both the instrument resolutions and the difficulty of taking accurate readings at the bottle level gauge, particularly when high water rates were supplied.
3.2. Lateral Saturated Soil Hydraulic Conductivities
The estimated Ks,l values in the soil monoliths for WLD of 5 cm, 15 cm and 25 cm are reported in Table 3. In MC the Ks,l decreased by 15 times in the passage from WLD of 5 cm to 25 cm. Smaller reductions with depth were found in the other monoliths, with the exception of MB, where at 25 cm the Ks,l increased to 2750 mm·h−1. This was the highest value found among all the experiments. The variability of the Ks,l estimates (Table 3) increased with depth, because soil heterogeneity effects were averaged over progressively smaller soil volumes. The median values roughly halved going from 5 cm to 15 cm. At WLD of 25 cm, the median Ks,l value reduced further, and was 40% lower than the median determined at 15 cm of depth. However, this result was largely affected by very high Ks,l found in MB. As can be seen in Table 3 and in Figure 4, it clearly appeared as an outlier in comparison to the rest of the Ks,l assessments. Without considering this monolith, the median Ks,l at WLD = 25 cm became about 70% lower than that estimated at the depth of 15 cm.
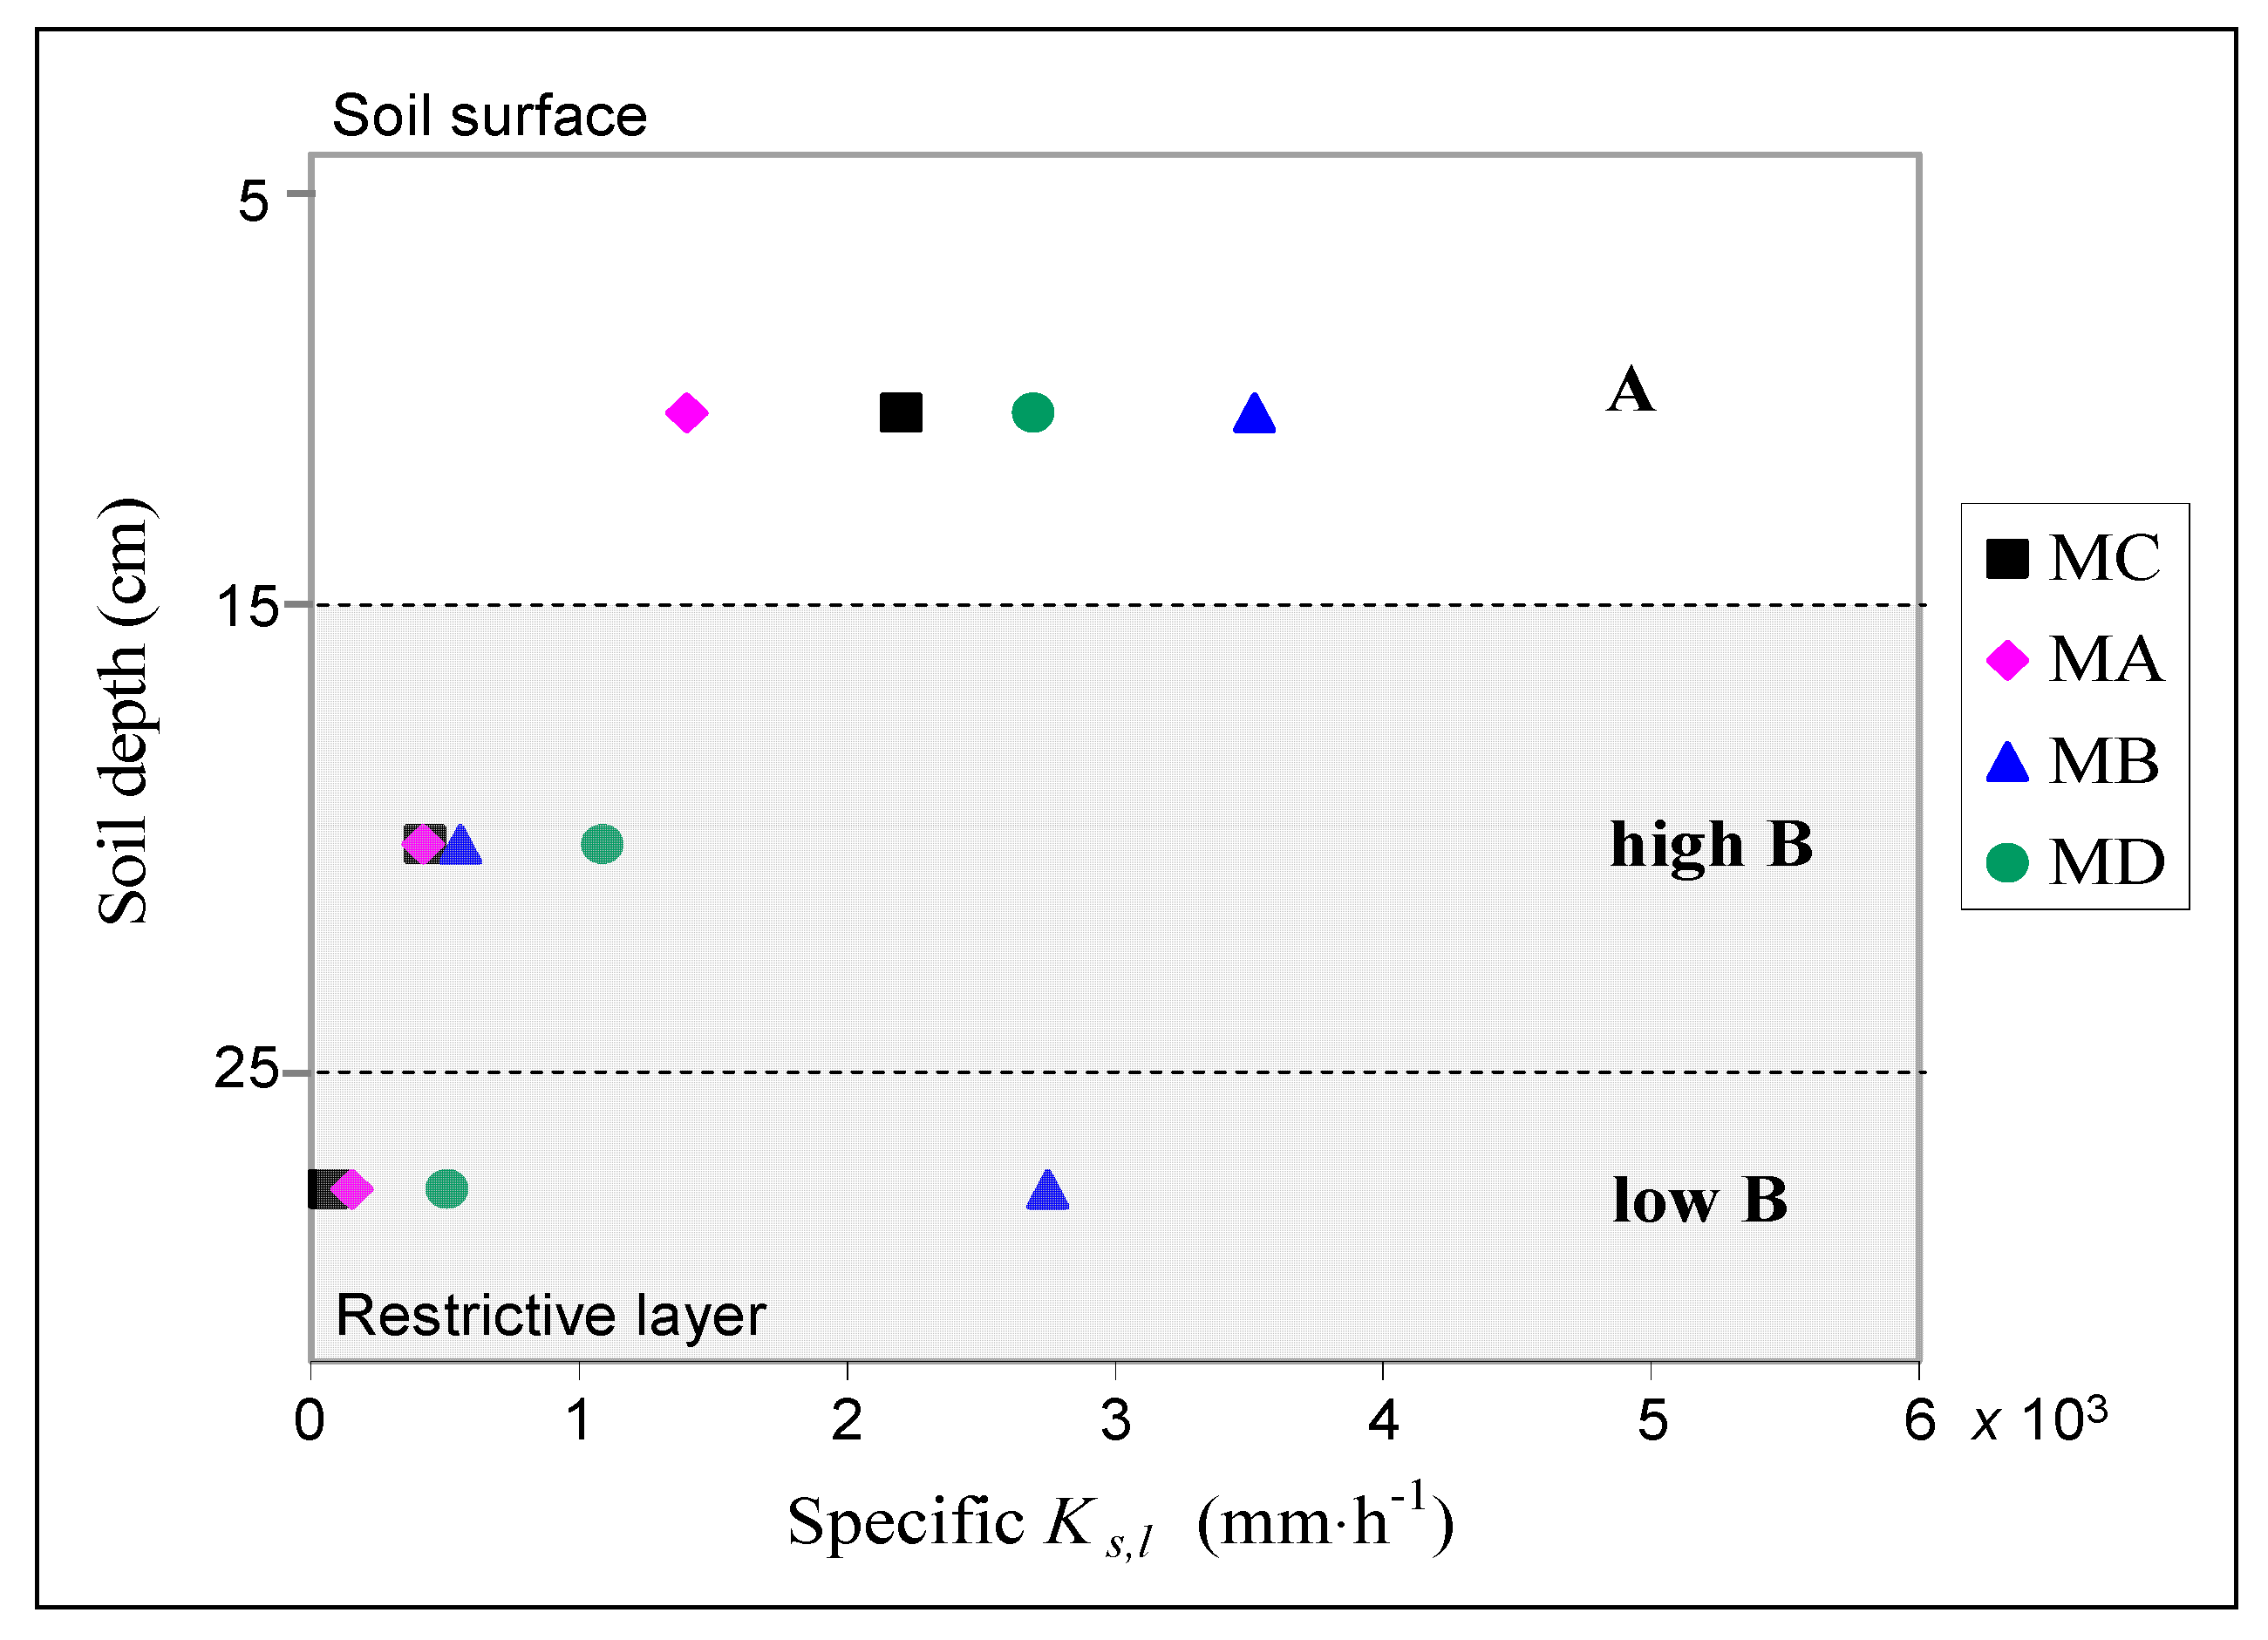
The specific Ks,l values calculated for the A horizon in the soil monoliths, and for the upper and lower layers of the B horizon, are shown in Figure 4. The median value of the specific Ks,l was around 2450 mm·h−1 in the A horizon. This value reduced by 80% in the upper layer of the B horizon. The ratio of the median Ks,l of the lower and upper B layers was 0.67 or 0.31, depending on whether or not the monolith MB was included in the calculation.
4. Discussion
4.1. Benefits of the Proposed Field Soil Ks,l Assessment Tool
The soil block methodology employed by Blanco et al. [24] to assess the soil Ks,l was modified in order to obtain accurate conductivity values of individual layers in a vertical soil profile, as well as to simplify field procedures. The self-built Mariotte bottle and the syphon system allowed easy and accurate setting of the sequence of descending water levels within the inflow and outflow pits, respectively. The developed procedure appeared simpler than lateral flow collectors embedded in the soil profile in order to yield separately the drainage from each horizon, as undertaken, for instance, by Mendoza and Steenhuis [23]. The procedure illustrated is certainly more practical for investigations in soils with widespread stoniness, where the rock fragments could prevent the collectors from being placed correctly (e.g., in [34]).
The water heads overlying the restrictive layer in both up and downhill pits of the monoliths defined first-type, or Dirichlet, boundary conditions to the flow spatial domain. The positive pressure diagrams at the monolith faces were like those determined by groundwater that built up on the restrictive layer when the soil was saturated by rainfall. Mainly for the downhill seepage face of the monoliths, digging pits to store water has advantages in comparison with other drainage-collecting systems, such as the aforementioned insertion of lateral flow collectors in the soil profile. In fact, from the latter, water had to be quickly removed to allow measurement, in this way establishing an atmospheric pressure boundary condition at the exfiltration surface.
All the hydrological processes of water leakage, vertical unsaturated flow and air spilling determined the temporal dynamics of the differences between outflows and inflows observed during the drainage experiments. Water leakages were due to percolation in the low-permeable subsoil and leakage at the bottom foam edges. These two processes were expected to decrease sharply over time with progressive subsoil saturation and for the lowering of the hydraulic head settings throughout the experiments. For WLDs set to 5 cm leakages in particular, we expected to account for the greatest part of the differences between outflows and inflows. Water movement from the unsaturated soil zone towards the water table in the monoliths increased the lateral saturated flow. The rates of vertical flow were related to the unsaturated zone thicknesses, and thus were lower at the starting WLD of 5 cm as compared to the other WLDs. Furthermore, at a prescribed WLD, the decrease over time of unsaturated drainage was due to unsaturated zone depletion, as can be deduced from Figure 3a,b for WLDs of 25 cm. The soil–air spill process, which was caused by the air–water dissolution and by the drag forces induced by the lateral water flow, contributed to reducing the differences between outflow and inflow during the experiments. However, this process was expected to have the least effect as compared with the water leakages and unsaturated vertical flow. In fact, the initial procedure of soil saturation by slowly increasing the water table level from below, without water ponding on the soil surface, should have facilitated the upward spilling of most entrapped soil air.
The q term of Equation (1) was the flow that perpendicularly was crossing the saturated soil sections throughout the monolith’s extent. Hence, in order to obtain reliable estimates of q, the groundwater equipotential lines had to be kept as parallel as possible in the flow spatial domain. First, this was done by imposing equal water-level depths in the pits, which also allowed evaluation with sufficient certainty the flow cross sections and hydraulic gradients to be used in Equation (1). However, within the monoliths, water leakages and unsaturated vertical drainages could have caused deviations from the right conditions, so that both processes had to be minimized in order to apply Darcy’s law properly. In the monoliths MA, MB and MC for the WLDs of 5 cm and 15 cm, and in MB for WLD = 25 cm, at the end of the stages outflows differed negligibly from inflows (Table 2). This indicated that the restrictive layer limited the deep-water percolation in a satisfactory way and the polyurethane expandable foam sufficiently sealed all sides of the monoliths. Furthermore, at the end of the stage, the unsaturated vertical drainage rates were negligible in comparison with the high lateral saturated flow rates. Consequently, the q flow terms were evaluated accurately in all the cases we referred to above. The recorded outflows in monolith MD, which were much lower than inflows (Table 2), did not account for a fair picture of the flow dynamics within the monolith. In this case, there was field evidence of localized water leakage at the bottom foam edge at the OP, while the hydraulic sealing was preserved in the inflow pit and at the lateral sides of the monolith. Furthermore, the encouraging results from the experiments in MA, MB and MC provided more weight to the idea that, in MD also, the restrictive layer and the undisturbed polyurethane foam efficiently encased the soil block. In addition, the unsaturated vertical flow was also expected to be a negligible fraction of the outflow rate in this monolith at all the investigated WLDs. Therefore, to use inflow instead of outflow in Equation (1) was a reasonable assumption in order to obtain reliable determinations of Ks,l. Very slow lateral flows were measured in monoliths A and C during the experimental stages with a WLD of 25 cm. In these cases, it could not be excluded that both leakages and unsaturated vertical flows had affected the final outflow values. Therefore, in these experiments, the Ks,l evaluations for the highest imposed WLD should be less certain in percentage terms compared to the remaining cases.
Steady-state flows were not achieved in some stages of the experiments with WLD set to 5 cm and 15 cm. In the illustrated case of the MC monolith for WLD = 5 cm (Figure 3b), transient ending flows were measured despite the fact that in an early stage of the process steady-state conditions were detected. Similar circumstances were reported in Alagna et al. [35] for the recorded infiltration rates during prolonged runs. The same behavior also was pointed out by Bagarello et al. [29] in long-time drainage experiments on small (0.001 m3) undisturbed soil samples. Dikinya et al. [36] observed that when water moved in two repacked soil columns, the hydraulic conductivities decreased up to one order of magnitude from the start until the shutdown of the flow experiments. These authors argued that this was due to particle mobilization and pore-clogging processes. It is probable that in the monoliths, the observed decline of flow rates revealed pore-structure rearrangements, as plausibly caused by the high drainage rates in the soil layers close to the surface. In fact, the fast flow in macropores might have weakened the bonds of fine soil particles. This resulted in the detachment and delivery of particles through the soil, and clogging in the flow path. The choice to vary the water level, despite the fact that the steady-state flow was not always reached, was made in order to limit the ongoing soil rearrangement processes during the experiments. The Ks,l values computed for the WLDs of 5 cm and 15 cm by the mean flow measurements from the first half-hour of the experiment stages were on average 12% greater than Ks,l calculated from the final mean flow measurements (Table 2). This suggested that the soil rearrangement processes did not have significant impacts on the results of the experiments.
4.2. Ks,l Values of Individual Soil Horizons
Median Ks,l of 2450 mm·h−1 was computed for the A soil horizon averaging the specific Ks,l values determined through Equation (3) for each soil monolith (Figure 4). The high median Ks,l indicated that macropores governed the lateral drainage processes in this horizon. Decayed roots and micro- and mesofauna activities were probably most responsible for the slope-parallel macropore network, which was observed close to the soil surface. Similar findings were reported by Brooks et al. [9], which estimated Ks,l values up to 600 mm·h−1 in the macro-porous A horizon of their study site. Also Appels et al. [37] measured topsoil Ks,l values over 1900 mm·h−1. Dusek et al. [3] used Ks,l values of several thousands of mm·h−1 to simulate water flow in macropores in the superficial soil layers in an experimental hillslope. The median Ks,l value, 552 mm·h−1 (Table 3), of the B horizon of the monoliths (from 15 cm of depth to the restrictive layer), was about 78% lower than that of the A horizon. In particular, in the upper layer of the B horizon (15–25 cm of depth) specific Ks,l values spanning from around 400–1000 mm·h−1 indicated that macropores here dominated the flow processes. In the lower B layer, estimated specific Ks,l values ranging from tens to thousands of mm·h−1 suggested that, in some cases, the flow was dominated by the soil matrix and in the rest by macropore flow. Overall, median specific values of Ks,l were reduced by a factor of 0.20 passing from the A to the upper B layer, and further decreased in the lower B horizon compared to the upper B. This indicated that there was a vertical gradient of macropore density. Instead, the increase of matrix porosity with depth could be excluded, based on a previous investigation in the same site [32] reporting the invariance of the bulk density along the vertical soil profile.
Pirastru et al. [32] determined average soil vertical hydraulic conductivities of 139 mm·h−1 and 94 mm·h−1 in the A and B horizons, respectively, with a single-ring infiltrometer (see Table 2 in [32], winter measurements). Therefore, the saturated soil hydraulic conductivities were much greater in the sub-horizontal direction compared to the vertical conductivity. Pirastru et al. [32] and Pirastru et al. [38] observed, in piezometers augered to the restrictive layer, the water table rapidly depleted when it rose in the A horizon. Even under the heaviest rainfall, the water table never reached the soil surface, with the exception of the wells located at the foot slope, close to the stream. Conversely, the water table persisted in the lower part of the B soil profile throughout the inter-storm periods during the rainy winters, and completely ran out from the hillslope only at the beginning of the dry periods in spring. The hydromorphic signs as greyish, brown and reddish soil color anomalies, commonly found in this part of the profile, also confirm that here the soil is prone to waterlogging. The very high Ks,l values computed for the near soil surface in the monoliths can explain the reported groundwater hydrological dynamics in the A horizon of the hill. In fact, the high lateral permeability of this horizon caused the swift downslope delivery of the soil water, resulting in the rapid depletion of the water table when it approached the soil surface. This hindered the saturation of the whole soil profile, even during intense precipitation. In the lower B horizon, the persistence of the water table for long periods across the hillslope indicated the lower permeability of the soil near the restrictive layer. This hydrological behavior, which was in contrast to that observed in the A horizon, was consistent with the remarkable decreasing of the median Ks,l value along the vertical soil profile, as determined through the drainage experiments in the soil monoliths.
Another objective of the research was to investigate the effectiveness of the drainage experiments in large soil-volume monoliths in order to evaluate spatially representative Ks,l values for the soil horizons in the analysed hillslope. For this reason, we took the relationship between Ks,l and water-table depths reported in Pirastru et al. [38] for the same site as a benchmark. The authors estimated soil average Ks,l by combining measurements of drainage rates from a 2.5 m-long drain and water-table levels from two well transects extending 10 m upslope of the drain. Therefore, this relationship was considered representative for the soil over a large area of the hillslope. Although specific Ks,l values for soil horizons are not shown in Pirastru et al. [38], these can easily be gathered by applying Equation (3) with the Ks,l values of the large-scale relationship coupled with the prescribed soil depths and the corresponding water-table elevations. Having done this, mean specific large-scale Ks,l values of 8000 mm·h−1, 780 mm·h−1 and 180 mm·h−1 were calculated for the A, upper B and lower B soil layers, respectively. Compared to these values, the median Ks,l values of the same soil layers in the monoliths differed by factors of 0.3, 0.6 and 1.8, respectively. Hence, the Ks,l values in the soil monoliths were similar in magnitude to the large-scale Ks,l determinations. Brooks et al. [9] reported hillslope-scale estimations in soil horizons within one and two orders of magnitude greater than the available values from Guelph permeameter measurements. Montgomery and Dietrich [10] evaluated the Ks,l of an A horizon both by falling-head tests in wells and by yielding discharge from a gully cut, which had shown evidence of macropore flow. They estimated Ks,l values from the falling-head tests ranging between 10−1 cm·s−1 to 10−2 cm·s−1, and large-scale Ks,l values comparable only with the high end of the range of conductivities obtained in the wells. Chappell and Lancaster [39] reported large-scale Ks,l values by trench percolation tests on average 37 times larger than the mean conductivity obtained by slug tests made in piezometers adjacent to their trenches. Therefore, in comparison to these studies, in our investigation we detected a more satisfactory agreement between the estimated Ks,l in the monoliths and the values available from the large spatial scale investigation.
For the lower B soil layer, the median Ks,l value measured in soil monoliths is more consistent with the large-scale value from the drain when the high Ks,l value estimated in MB (2750 mm·h−1) is excluded from the computation. In fact, in this case the median Ks,l value of the lower B layer was just 15% lower than the large-scale value. This result suggested that in the monolith MB the characteristics of lateral drainage for small-saturated soil thicknesses of the hillslope were probably not fairly represented. Also, the water-table dynamics reported for the B horizon of this site by Pirastru et al. [32] and Pirastru et al. [38] further supported the idea that in MB the characteristics of soil lateral drainage were misrepresented. During the saturation phase of the experiment, we observed that an isolated, large pore located at the soil-restrictive layer interface quickly drained when water was initially supplied to the inflow pit. We assume that this macropore ran thought the entire length of the sample. Instead, such macropores in the field are commonly constrained in their extent by the surrounding soil matrix. By converting this macropore into a continuous pipe within the sample, the soil Ks,l may have been significantly overestimated.
In a modeling study assessing the climate and land-use change effects in the water balance at the Baratz lake catchment, Niedda et al. [40] used a maximum value of the Ks,l parameter of 1000 mm·h−1 at the soil surface, then it decreased in depth. They efficiently simulated the discharge at the catchment outlet. The median Ks,l values (Table 3) found in the soil monoliths were in line with the parameter values used in simulations. This suggests that drainage experiments in large-volume soil monoliths can potentially be used to obtain parameter values for the hydrological models, in order to simulate the runoff-generation processes at catchment scale.
5. Conclusions
The lateral saturated hydraulic conductivities in the soil horizons of the shallow steep soil of a hillslope was evaluated in situ by drainage experiments in monoliths ranging in volume from 0.1 m3 to 0.16 m3. The expandable polyurethane foam used to encase the samples on the field made the hydraulic isolation of the soil blocks easy. Moreover, the removal of the foam from the field was easy, allowing a reduction of the impact on the experimental area. Minimizing leakages along the sides of the foam barriers allowed evaluation of the flow rate, cross-section area and hydraulic gradient terms of Darcy’s law, in order to obtain reliable Ks,l values. Thanks to the large volume sampled in each experiment, soil macropores were included in the measurements and sufficiently characterized. The information about the lateral permeability of the soil horizons that was obtained was consistent with the groundwater dynamics observed during previous investigations in the hillslope studied. Likewise, the median values of the Ks,l obtained in the soil horizons of monoliths were comparable with large spatial-scale Ks,l values computed through drain flow measurements in the same site. This indicated that the hydrological large-scale effects of the soil macropore network of the hillslope were sufficiently represented in the large-volume soil samples. Currently, drainage measurements are ongoing at an 8.5 m-long drain, in order to yield Ks,l values that could be more representative for the hillslope scale. A future comparison with these values will give us further indications about the suitability of the drainage experiments in the soil monoliths for characterizing hydrological processes and determining hydraulic conductivities at the hillslope-scale.
It took four days to prepare the setup and perform the drainage experiment on each soil monolith in order to determine the Ks,l. Considering the effort required and the need to maintain a field campaign of reasonable duration, a limited number of samples were investigated. Despite this, Ks,l values sufficiently representative for the soil in the hillslope were achieved. The Ks,l discrepancies between the monoliths and the drain were smaller in comparison with those reported by other authors who have compared small- and large-scale Ks,l values. Therefore, the methodology described in this study appears to represent a step forward in the possibility of detecting, through a low number of experiments, representative hydraulic conductivities of soil horizons over large spatial scales. Hence, such experimentation will allow, through a sustainable effort, valuable information for interpreting hydrological processes and parameterizing runoff-generation models both at the hillslope and catchment scale to be obtained.
Acknowledgments
This research was funded by the program: “Promotion of the scientific research and technological innovation in Sardinia (IT), RL7/2007”, specific project “Anthropogenic and climate impacts in the hydrologic cycle at basin and hillslope scales”.
Author Contributions
M.P., R.M. and S.D.P. carried out the experimental work and write the paper. All authors designed the work and analyzed the results.
Conflicts of Interest
The authors declare no conflict of interest.
References
- McDaniel, P.A.; Regan, M.P.; Brooks, E.; Boll, J.; Barndt, S.; Falen, A.; Young, S.K.; Hammel, J.E. Linking fragipans, perched water tables, and catchment-scale hydrological processes. CATENA 2008, 73, 166–173. [Google Scholar] [CrossRef]
- Du, E.; Rhett Jackson, C.; Klaus, J.; McDonnell, J.J.; Griffiths, N.A.; Williamson, M.F.; Greco, J.L.; Bitew, M. Interflow dynamics on a low relief forested hillslope: Lots of fill, little spill. J. Hydrol. 2016, 534, 648–658. [Google Scholar] [CrossRef]
- Dusek, J.; Vogel, T.; Dohnal, M.; Gerke, H.H. Combining dual-continuum approach with diffusion wave model to include a preferential flow component in hillslope scale modeling of shallow subsurface runoff. Adv. Water Resour. 2012, 44, 113–125. [Google Scholar] [CrossRef]
- Alaoui, A.; Caduff, U.; Gerke, H.H.; Weingartner, R. A Preferential Flow Effects on Infiltration and Runoff in Grassland and Forest Soils. Vadose Zone J. 2011, 10, 367. [Google Scholar] [CrossRef]
- Van Schaik, N.L.M.B.; Schnabel, S.; Jetten, V.G. The influence of preferential flow on hillslope hydrology in a semi-arid watershed (in the Spanish Dehesas). Hydrol. Process. 2008, 22, 3844–3855. [Google Scholar] [CrossRef]
- Wienhöfer, J.; Zehe, E. Predicting subsurface stormflow response of a forested hillslope—The role of connected flow paths. Hydrol. Earth Syst. Sci. 2014, 18, 121–138. [Google Scholar] [CrossRef] [Green Version]
- Schmocker-Fackel, P.; Naef, F.; Scherrer, S. Identifying runoff processes on the plot and catchment scale. Hydrol. Earth Syst. Sci. 2007, 11, 891–906. [Google Scholar] [CrossRef]
- Weiler, M.; McDonnell, J.J.; Tromp-van Meerveld, I.; Uchida, T. Subsurface Stormflow. In Encyclopedia of Hydrological Sciences; Anderson, M.G., McDonnell, J.J., Eds.; John Wiley & Sons, Ltd.: Chichester, UK, 2006; ISBN 0471491039, 9780471491033, 0470848944, 9780470848944. [Google Scholar]
- Brooks, E.S.; Boll, J.; McDaniel, P.A. A hillslope-scale experiment to measure lateral saturated hydraulic conductivity. Water Resour. Res. 2004, 40, W04208. [Google Scholar] [CrossRef]
- Montgomery, D.R.; Dietrich, W.E. Hydrologic Processes in a Low-Gradient Source Area. Water Resour. Res. 1995, 31, 1–10. [Google Scholar] [CrossRef]
- McGuire, K.J.; McDonnell, J.J. Hydrological connectivity of hillslopes and streams: Characteristic time scales and nonlinearities. Water Resour. Res. 2010, 46. [Google Scholar] [CrossRef]
- Starr, J.L.; Sadeghi, A.M.; Pachepsky, Y.A. Monitoring and Modeling Lateral Transport through a Large In Situ Chamber. Soil Sci. Soc. Am. J. 2005, 69, 1871. [Google Scholar] [CrossRef]
- Stutter, M.I.; Deeks, L.K.; Billett, M.F. Transport of conservative and reactive tracers through a naturally structured upland podzol field lysimeter. J. Hydrol. 2005, 300, 1–19. [Google Scholar] [CrossRef]
- Van Verseveld, W.J.; McDonnell, J.J.; Lajtha, K. The role of hillslope hydrology in controlling nutrient loss. J. Hydrol. 2009, 367, 177–187. [Google Scholar] [CrossRef]
- Ambroise, B.; Beven, K.; Freer, J. Toward a Generalization of the TOPMODEL Concepts: Topographic Indices of Hydrological Similarity. Water Resour. Res. 1996, 32, 2135–2145. [Google Scholar] [CrossRef]
- Ameli, A.A.; Amvrosiadi, N.; Grabs, T.; Laudon, H.; Creed, I.F.; McDonnell, J.J.; Bishop, K. Hillslope permeability architecture controls on subsurface transit time distribution and flow paths. J. Hydrol. 2016, 543, 17–30. [Google Scholar] [CrossRef]
- Matonse, A.H.; Kroll, C.N. Applying hillslope-storage models to improve low flow estimates with limited streamflow data at a watershed scale. J. Hydrol. 2013, 494, 20–31. [Google Scholar] [CrossRef]
- Maneta, M.; Schnabel, S.; Jetten, V. Continuous spatially distributed simulation of surface and subsurface hydrological processes in a small semiarid catchment. Hydrol. Process. 2008, 22, 2196–2214. [Google Scholar] [CrossRef]
- Van Schaik, N.L.M.B.; Bronstert, A.; De Jong, S.M.; Jetten, V.G.; Van Dam, J.C.; Ritsema, C.J.; Schnabel, S. Process-based modelling of a headwater catchment in a semi-arid area: The influence of macropore flow: Process-based modelling of a headwater catchment. Hydrol. Process. 2014, 28, 5805–5816. [Google Scholar] [CrossRef]
- Bathke, G.R.; Cassel, D.K. Anisotropic Variation of Profile Characteristics and Saturated Hydraulic Conductivity in an Ultisol Landscape. Soil Sci. Soc. Am. J. 1991, 55, 333. [Google Scholar] [CrossRef]
- Beckwith, C.W.; Baird, A.J.; Heathwaite, A.L. Anisotropy and depth-related heterogeneity of hydraulic conductivity in a bog peat. I: Laboratory measurements. Hydrol. Process. 2003, 17, 89–101. [Google Scholar] [CrossRef]
- Vepraskas, M.J.; Williams, J.P. Hydraulic Conductivity of Saprolite as a Function of Sample Dimensions and Measurement Technique. Soil Sci. Soc. Am. J. 1995, 59, 975. [Google Scholar] [CrossRef]
- Mendoza, G.; Steenhuis, T.S. Determination of hydraulic behavior of hillsides with a hillslope infiltrometer. Soil Sci. Soc. Am. J. 2002, 66, 1501. [Google Scholar] [CrossRef]
- Blanco-Canqui, H.; Gantzer, C.J.; Anderson, S.H.; Alberts, E.E.; Ghidey, F. Saturated Hydraulic Conductivity and Its Impact on Simulated Runoff for Claypan Soils. Soil Sci. Soc. Am. J. 2002, 66, 1596. [Google Scholar] [CrossRef]
- Brye, K.R.; Morris, T.L.; Miller, D.M.; Formica, S.J.; Van Eps, M.A. Estimating Bulk Density in Vertically Exposed Stoney Alluvium Using a Modified Excavation Method. J. Environ. Qual. 2004, 33, 1937. [Google Scholar] [CrossRef] [PubMed]
- Muller, R.N.; Hamilton, M.E. A simple, effective method for determining the bulk density of stony soils. Commun. Soil Sci. Plant Anal. 1992, 23, 313–319. [Google Scholar] [CrossRef]
- Page-Dumroese, D.S.; Brown, R.E.; Jurgensen, M.F.; Mroz, G.D. Comparison of Methods for Determining Bulk Densities of Rocky Forest Soils. Soil Sci. Soc. Am. J. 1999, 63, 379. [Google Scholar] [CrossRef]
- Bagarello, V.; Sgroi, A. Testing Soil Encasing Materials for Measuring Hydraulic Conductivity of a Sandy-Loam Soil by the Cube Methods. Soil Sci. Soc. Am. J. 2008, 72, 1048. [Google Scholar] [CrossRef]
- Bagarello, V.; Sferlazza, S.; Sgroi, A. Testing laboratory methods to determine the anisotropy of saturated hydraulic conductivity in a sandy–loam soil. Geoderma 2009, 154, 52–58. [Google Scholar] [CrossRef]
- Germer, K.; Braun, J. Determination of Anisotropic Saturated Hydraulic Conductivity of a Macroporous Slope Soil. Soil Sci. Soc. Am. J. 2015, 79, 1528. [Google Scholar] [CrossRef]
- Castellini, M.; Iovino, M.; Pirastru, M.; Niedda, M.; Bagarello, V. Use of BEST Procedure to Assess Soil Physical Quality in the Baratz Lake Catchment (Sardinia, Italy). Soil Sci. Soc. Am. J. 2016, 80, 742. [Google Scholar] [CrossRef]
- Pirastru, M.; Niedda, M.; Castellini, M. Effects of maquis clearing on the properties of the soil and on the near-surface hydrological processes in a semi-arid Mediterranean environment. J. Agric. Eng. 2014, 45, 176. [Google Scholar] [CrossRef]
- Giadrossich, F.; Niedda, M.; Cohen, D.; Pirastru, M. Evaporation in a Mediterranean environment by energy budget and Penman methods, Lake Baratz, Sardinia, Italy. Hydrol. Earth Syst. Sci. 2015, 19, 2451–2468. [Google Scholar] [CrossRef]
- Day, R.L.; Calmon, M.A.; Stiteler, J.M.; Jabro, J.D.; Cunningham, R.L. Water balance and flow patterns in a fragipan using in situ soil block. Soil Sci. 1998, 163, 517–528. [Google Scholar] [CrossRef]
- Alagna, V.; Bagarello, V.; Di Prima, S.; Giordano, G.; Iovino, M. Testing infiltration run effects on the estimated water transmission properties of a sandy-loam soil. Geoderma 2016, 267, 24–33. [Google Scholar] [CrossRef]
- Dikinya, O.; Hinz, C.; Aylmore, G. Decrease in hydraulic conductivity and particle release associated with self-filtration in saturated soil columns. Geoderma 2008, 146, 192–200. [Google Scholar] [CrossRef]
- Appels, W.M.; Graham, C.B.; Freer, J.E.; McDonnell, J.J. Factors affecting the spatial pattern of bedrock groundwater recharge at the hillslope scale: Spatial Patterns of Bedrock Groundwater Recharge. Hydrol. Process. 2015, 29, 4594–4610. [Google Scholar] [CrossRef]
- Pirastru, M.; Bagarello, V.; Iovino, M.; Marrosu, R.; Castellini, M.; Giadrossich, F.; Niedda, M. Subsurface flow and large-scale lateral saturated soil hydraulic conductivity in a Mediterranean hillslope with contrasting land uses. J. Hydrol. Hydromech. 2017, 65. [Google Scholar] [CrossRef]
- Chappell, N.A.; Lancaster, J.W. Comparison of methodological uncertainties within permeability measurements. Hydrol. Process. 2007, 21, 2504–2514. [Google Scholar] [CrossRef]
- Niedda, M.; Pirastru, M.; Castellini, M.; Giadrossich, F. Simulating the hydrological response of a closed catchment-lake system to recent climate and land-use changes in semi-arid Mediterranean environment. J. Hydrol. 2014, 517, 732–745. [Google Scholar] [CrossRef]
Figure 1.
(a) Field equipment to determine lateral saturated soil hydraulic conductivities in the monoliths MA, MB and MC; (b) soil monolith encased with polyurethane foam, with signed inflow (IP) and outflow (OP) pits; (c) spillway pipes inserted in the OP foam of the monolith MD to set the water level and collect the drainage.

Figure 2.
Experimental design to estimate the lateral saturated hydraulic conductivity of soil horizons from drainage of large-volume soil monoliths. The sketch represents the syphon system used in the MA, MB and MC monoliths to set the water levels and collect the drainage.
Figure 2.
Experimental design to estimate the lateral saturated hydraulic conductivity of soil horizons from drainage of large-volume soil monoliths. The sketch represents the syphon system used in the MA, MB and MC monoliths to set the water levels and collect the drainage.

Figure 3.
(a,b) Time series of the inflow and outflow rates measured during the experiments in the soil monoliths MA and MC; (c,d) computed differences between outflows and inflows. Note the difference in flow rate scale in the graphics. Numbers in squares indicate the following experiment stages: (1) soil saturation; (2) Mariotte bottle refilling; (3) water-level depth transition.

Figure 4.
Computed specific Ks,l values in the A horizon and in the upper and lower layers of the B horizon. The shaded area is the soil B horizon.
Figure 4.
Computed specific Ks,l values in the A horizon and in the upper and lower layers of the B horizon. The shaded area is the soil B horizon.


Table 1.
Dimensions of the soil monoliths sampled in the drainage experiments.
| Monolith | Length (cm) | Width (cm) | Soil Depth (cm) | Soil Volume (m3) | Surface Slope |
|---|---|---|---|---|---|
| MA | 80 | 52.5 | 31 | 0.13 | 0.27 |
| MB | 69 | 50.0 | 29 | 0.10 | 0.35 |
| MC | 68 | 50.0 | 30 | 0.10 | 0.42 |
| MD | 85 | 54.0 | 35 | 0.16 | 0.36 |
Table 2.
Arithmetic means of the outflow and inflow rates calculated over the last 30 min of the stages for each prescribed water-level depth. Inflows are in parentheses. The rates are in mL·min−1·m−1.
Table 2.
Arithmetic means of the outflow and inflow rates calculated over the last 30 min of the stages for each prescribed water-level depth. Inflows are in parentheses. The rates are in mL·min−1·m−1.
| Monolith | Water-Level Depth (WLD) | ||
|---|---|---|---|
| 5 cm | 15 cm | 25 cm | |
| MA | 810 (838) | 218 (236) | 42 (47) |
| MB | 2660 (2671) | 851 (864) | 565 (565) |
| MC | 1581 (1595) | 273 (272) | 21 (15) |
| MD | 307 (2308) | 98 (867) | 23 (286) |
Table 3.
Lateral saturated soil hydraulic conductivities, Ks,l (mm·h−1), estimated from the drainage experiments in the five soil monoliths for the water-level depths (WLD) of 5 cm, 15 cm and 25 cm from the soil surface.
Table 3.
Lateral saturated soil hydraulic conductivities, Ks,l (mm·h−1), estimated from the drainage experiments in the five soil monoliths for the water-level depths (WLD) of 5 cm, 15 cm and 25 cm from the soil surface.
| Monolith | Water-Level Depth | ||
|---|---|---|---|
| 5 cm | 15 cm | 25 cm | |
| MA | 724 | 313 | 153 |
| MB | 2157 | 1184 | 2750 |
| MC | 1066 | 307 | 70 |
| MD | 1416 | 791 | 509 |
| Median | 1241 | 552 | 331 |
© 2017 by the authors. Licensee MDPI, Basel, Switzerland. This article is an open access article distributed under the terms and conditions of the Creative Commons Attribution (CC BY) license (http://creativecommons.org/licenses/by/4.0/).
Share and Cite
MDPI and ACS Style
Pirastru, M.; Marrosu, R.; Di Prima, S.; Keesstra, S.; Giadrossich, F.; Niedda, M. Lateral Saturated Hydraulic Conductivity of Soil Horizons Evaluated in Large-Volume Soil Monoliths. Water 2017, 9, 862. https://doi.org/10.3390/w9110862
AMA Style
Pirastru M, Marrosu R, Di Prima S, Keesstra S, Giadrossich F, Niedda M. Lateral Saturated Hydraulic Conductivity of Soil Horizons Evaluated in Large-Volume Soil Monoliths. Water. 2017; 9(11):862. https://doi.org/10.3390/w9110862
Chicago/Turabian StylePirastru, Mario, Roberto Marrosu, Simone Di Prima, Saskia Keesstra, Filippo Giadrossich, and Marcello Niedda. 2017. "Lateral Saturated Hydraulic Conductivity of Soil Horizons Evaluated in Large-Volume Soil Monoliths" Water 9, no. 11: 862. https://doi.org/10.3390/w9110862
Note that from the first issue of 2016, this journal uses article numbers instead of page numbers. See further details here.