 Ningyi Zhang
 Gang Li1†
 Weihong Luo
 Xinyou Yin
- 1College of Agriculture, Nanjing Agricultural University, Nanjing, China
- 2Center for Crop Systems Analysis, Department of Plant Sciences, Wageningen University & Research, Wageningen, Netherlands
- 3Horticulture and Product Physiology Group, Department of Plant Sciences, Wageningen University & Research Centre, Wageningen, Netherlands
Accurately predicting photosynthesis in response to water and nitrogen stress is the first step toward predicting crop growth, yield and many quality traits under fluctuating environmental conditions. While mechanistic models are capable of predicting photosynthesis under fluctuating environmental conditions, simplifying the parameterization procedure is important toward a wide range of model applications. In this study, the biochemical photosynthesis model of Farquhar, von Caemmerer and Berry (the FvCB model) and the stomatal conductance model of Ball, Woodrow and Berry which was revised by Leuning and Yin (the BWB-Leuning-Yin model) were parameterized for Lilium (L. auratum × speciosum “Sorbonne”) grown under different water and nitrogen conditions. Linear relationships were found between biochemical parameters of the FvCB model and leaf nitrogen content per unit leaf area (Na), and between mesophyll conductance and Na under different water and nitrogen conditions. By incorporating these Na-dependent linear relationships, the FvCB model was able to predict the net photosynthetic rate (An) in response to all water and nitrogen conditions. In contrast, stomatal conductance (gs) can be accurately predicted if parameters in the BWB-Leuning-Yin model were adjusted specifically to water conditions; otherwise gs was underestimated by 9% under well-watered conditions and was overestimated by 13% under water-deficit conditions. However, the 13% overestimation of gs under water-deficit conditions led to only 9% overestimation of An by the coupled FvCB and BWB-Leuning-Yin model whereas the 9% underestimation of gs under well-watered conditions affected little the prediction of An. Our results indicate that to accurately predict An and gs under different water and nitrogen conditions, only a few parameters in the BWB-Leuning-Yin model need to be adjusted according to water conditions whereas all other parameters are either conservative or can be adjusted according to their linear relationships with Na. Our study exemplifies a simplified procedure of parameterizing the coupled FvCB and gs model that is widely used for various modeling purposes.
Introduction
In the past decades, many crop models have been developed for predicting yield in response to changing environments. Some studies evaluated the performance of different crop models under different growth conditions such as different temperature, water supply and soil fertility (Jamieson et al., 1998; Adam et al., 2011; Palosuo et al., 2011). Surprisingly, when testing these models under a large land scale or long time span, the yield predictions in most models turned out to be an artifact of the balance between incorrect predictions of assimilation and leaf area index (Jamieson et al., 1998) or between biomass production and harvest index (Palosuo et al., 2011). The radiation-use efficiency approach that was taken in many crop models may over-simplify underlying processes and a more detailed approach, based on quantitative functional relationships for underlying processes, is needed in order to capture the effects of high temperature and high radiation intensities on crop growth under changing environments (Challinor et al., 2009; Adam et al., 2011). While detailed models usually require more effort in terms of model parameterization, some parameters and functional relationships are found to change very little (i.e., are conservative) among crop types (von Caemmerer et al., 2009) and environmental conditions (Yin, 2013). Therefore, it is important to test the conservative level of commonly used functional relationships, so as to balance between the level of detail in these models and the efforts needed for model parameterization.
Photosynthesis is the primary physiological process that drives crop growth and productivity and influences many plant quality traits, and is strongly affected by environmental factors. Accurately predicting photosynthesis is the first step toward predicting crop growth, yield and quality in response to environmental changes. Water and nitrogen variations frequently occur in crop fields. The effects of water and nitrogen on photosynthesis have been extensively and separately studied (Grassi et al., 2002; Xu and Baldocchi, 2003; Gu et al., 2012). The combined effect of water and nitrogen on photosynthesis, however, has received less attention.
Previous modeling studies have shown that the use of empirical factors to capture the effect of stresses, does not model photosynthesis reliably in many cases (Jamieson et al., 1998). The effects of environmental factors on leaf photosynthesis can be best investigated by use of the biochemical model of Farquhar, von Caemmerer and Berry (the FvCB model hereafter) (Farquhar et al., 1980) combined with diffusion models. The FvCB model has been widely used to describe photosynthesis in response to multiple environmental changes (Harley et al., 1992; Grassi et al., 2002; Xu and Baldocchi, 2003; Monti, 2006; Qian et al., 2012). The model describes photosynthesis as the minimum of the Rubisco-limited rate and the electron transport-limited rate. Major parameters in this model are the maximum Rubisco carboxylation rate (Vcmax, definitions of all model variables hereafter are listed in Table 1), the maximum electron transport rate (Jmax) and the mitochondrial day respiration (Rd). These biochemical parameters have been found to be linearly correlated with leaf nitrogen content per unit leaf area (Na) under environmental changes such as various nitrogen supply (Grassi et al., 2002; Yin et al., 2009) and elevated CO2 (Harley et al., 1992; Yin, 2013), as well as seasonal changes (Zhu et al., 2011). However, whether or not the linear relationships between these biochemical parameters and Na exist under drought is debatable, mainly due to inconsistent effect of drought on Na (Díaz-Espejo et al., 2006; Damour et al., 2008, 2009).
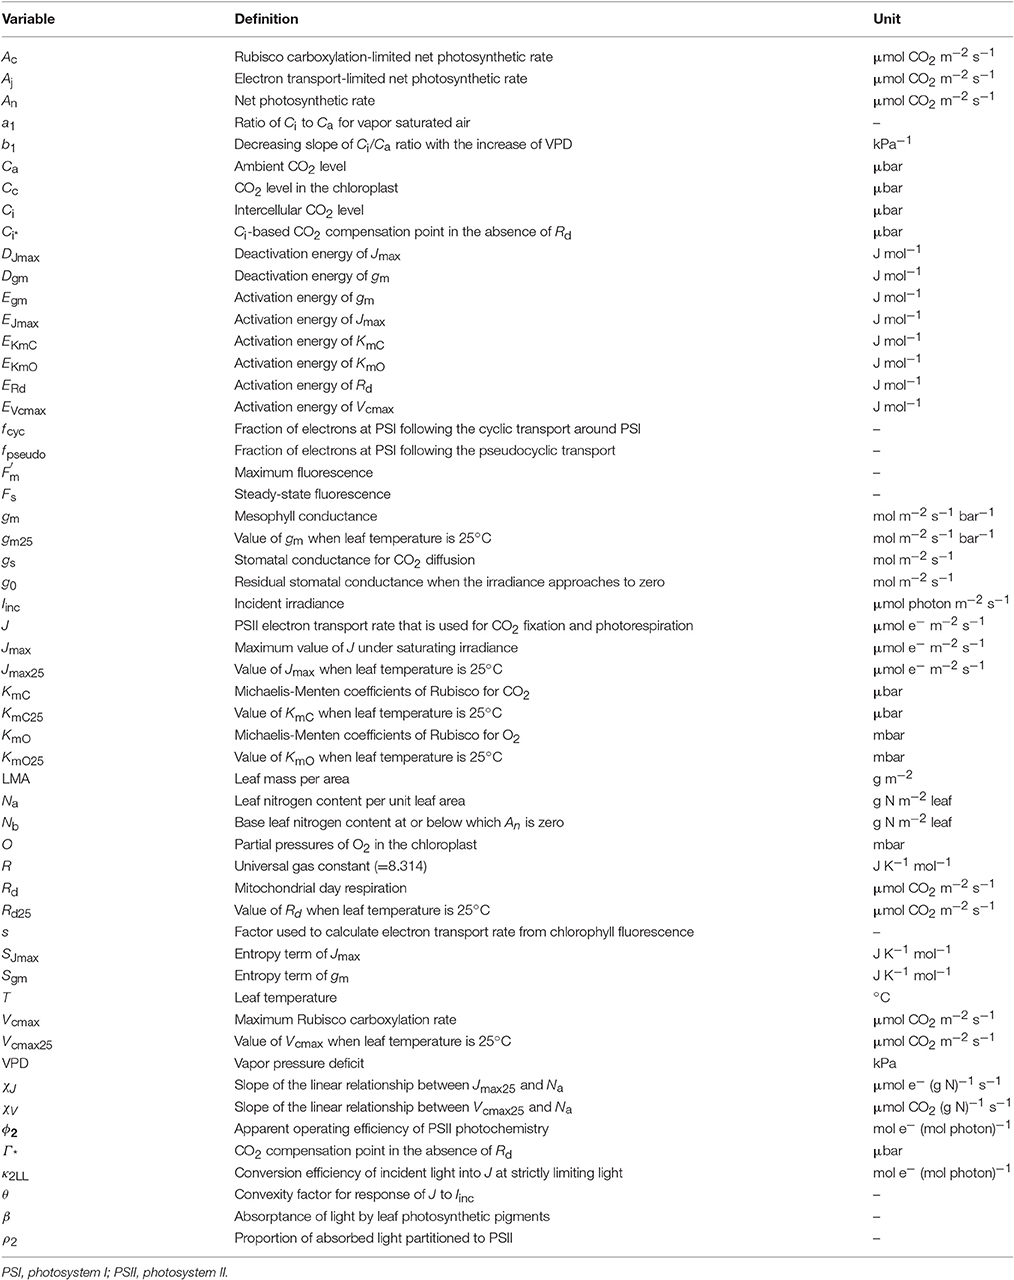
Table 1. List of model variables and their definitions and units.
The FvCB model itself requires the CO2 concentration in the chloroplast (Cc) as an input variable. To this end, estimating stomatal conductance (gs) and mesophyll conductance (gm) is necessary to enable the FvCB model to predict photosynthesis using the atmospheric CO2 level (Ca) as input. The stomatal conductance model of Ball et al. (1987) (the BWB-type model hereafter), as one of the most commonly used models of gs, is often coupled with the FvCB model (Harley et al., 1992; Kosugi et al., 2003). In the BWB-type model, gs responds to net photosynthetic rate, relative humidity and CO2 concentration at the leaf surface. Although it is phenomenological, the BWB-type model is widely used to model gs at leaf level (e.g., Leuning, 1995) and is the most feasible yet biologically robust tool for extrapolating gs at the field or forest stand level (Misson et al., 2002; Alton et al., 2007). The original BWB-type model does not capture stomatal responses to soil water status, thus some efforts were made toward modifying the BWB-type model to predict gs under drought. Either the slope used in the BWB-type model (describing the response of gs to photosynthetic rate, relative humidity or vapor pressure deficit (VPD) and CO2 concentration) (Tuzet et al., 2003; Maseyk et al., 2008; Héroult et al., 2013) or the residual stomatal conductance (the value of gs when irradiance approaches to zero) (Misson et al., 2004) was reported to decrease under drought, and was related to soil moisture or leaf water potential (Baldocchi, 1997; Wang and Leuning, 1998; Misson et al., 2004; Keenan et al., 2010; Egea et al., 2011; Li et al., 2012; Zhou et al., 2013; Müller et al., 2014). In another study, however, neither of these two parameters was affected by drought (Xu and Baldocchi, 2003). So far, there is no consensus as to how to adjust the BWB-type model parameters to properly model gs under drought. Moreover, there are very few studies that investigated the responses of these parameters to nitrogen supply and to the combination of water and nitrogen supply.
gm has been considered as infinite in most early studies, in which intercellular CO2 concentration (Ci) was used to substitute Cc in the FvCB model (Harley et al., 1992; Kosugi et al., 2003). However, this assumption has later been proved not true since Cc is lower than Ci (Warren, 2004). Ignoring gm leads to the underestimation of Vcmax, especially under stress conditions such as drought (Monti, 2006). gm has been found to decrease under water-deficit conditions and low nitrogen availability in many previous studies (reviewed in Flexas et al., 2008). There have been only a few attempts to incorporate the effect of drought on gm in the photosynthesis model by using a dependence of gm on gs (Cai et al., 2008) based on the observation of a close correlation between gs and gm in response to water-deficit conditions (Flexas et al., 2002; Warren, 2008; Perez-Martin et al., 2009) or by including an empirical soil moisture dependent function for gm (Keenan et al., 2010). Given that so far no consensus exists, more investigations are needed to incorporate the responses of gm to water and nitrogen variations into the photosynthesis model.
When applying the combined FvCB, gs and gm model for predicting photosynthetic responses to fluctuating environmental variables, inevitably many parameters need to be quantified. Information about which parameters are conservative and which are variable depending on the treatment is extremely useful for predicting photosynthesis under diverse environmental conditions. Given the previous experience that the FvCB model parameters, once expressed as a function of Na, are not altered by environmental variables such as elevated [CO2] (Yin, 2013), we are particularly interested in examining whether the responses of FvCB, gs and gm model parameters to water and nitrogen stress can be modeled using a single set of parameters when they are related to leaf nitrogen content. The objectives of this study are (i) to test whether or not water and nitrogen stress combinations change the linear relationships between photosynthetic biochemical parameters and leaf nitrogen content, and (ii) to investigate the responses of stomatal conductance model parameters and mesophyll conductance to different water and nitrogen conditions and to quantify these responses for the purpose of model simplicity. To this end, we used Lilium (L. auratum × speciosum “Sorbonne”) as the test plant, as this plant is commonly grown under low-investment greenhouses where plants are frequently subject to different water and nitrogen regimes.
Materials and Methods
Plant Materials and Experimental Design
Four experiments with the same type of water and nitrogen treatments were conducted in different growth seasons in a plastic greenhouse located at Nanjing, China (32°N, 118°E) during 2009 to 2011 (Table 2). The greenhouse, covered by anti-drop polyvinyl chloride film, was composed of two spans and east-west oriented with a length of 28 m, span width of 8 m, gutter height of 3 m and arch height of 5 m. Heating pipes were installed during winter season. During summer season, the greenhouse was cooled through natural ventilation and an inner shading screen installed at the position with a distance of 1.0-1.4 m to the top. Temperature, VPD and photosynthetically active radiation are shown in the Supplementary Data (Figures S1–S3). No CO2 enrichment was applied, and standard cultivation practices for disease and pest control were used as is common for commercial Lilium production in China. Lilium bulbs, with a circumference of 14-16 cm, were planted in plastic pots filled with substrates of sand, turf and soil (3:1:1). The physicochemical properties of the substrate are shown in Table 2. The pots, with a depth of 14 cm, upper diameter of 18 cm and bottom diameter of 12 cm, were put on seedling beds (l × w × h = 25.0 m × 1.7 m × 1.0 m) and arranged at a density of 36 plants m−2.
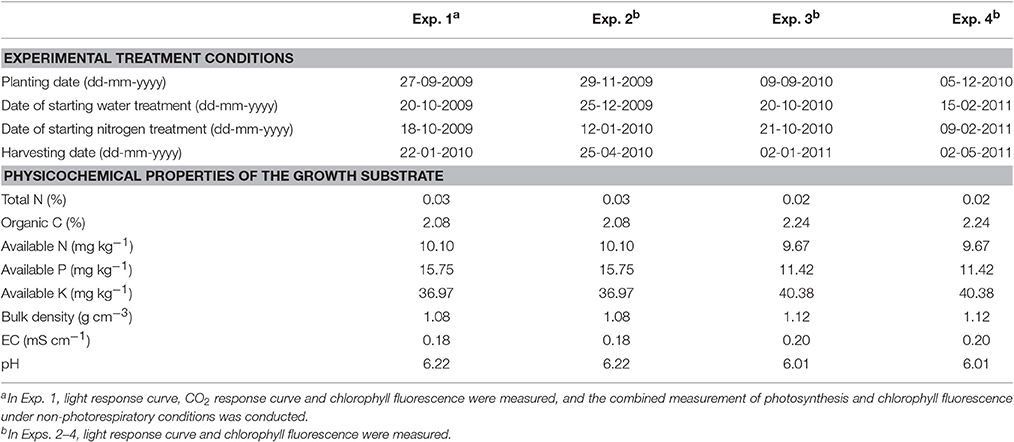
Table 2. Detailed information of experimental treatment conditions, physicochemical properties of the growth substrate and measurements.
Two water levels were used: well-watered conditions, with a soil water potential (SWP) of −4 to −15 kPa according to Li et al. (2012), and water-deficit conditions, with a SWP of −20 to −40 kPa. The SWP at 0.1 m below the soil surface was monitored using tensiometers (SWP-100, Institute of Soil Science, Chinese Academy of Sciences) with three replicates per water level. When the SWP reached its designed lower limit value, plants were irrigated until it reached the designed upper limit value. The SWP at 0.1 m below the soil surface and the corresponding gravimetric soil water content were measured to establish calibration curves. These curves were then used to determine the amount of water required for irrigation. The dates of starting water treatment in the four experiments are shown in Table 2.
At each water level, there were four levels of nitrogen supply: 25, 45, 65, and 85 mg available nitrogen per kg substrate (hereafter N25, N45, N65, and N85, respectively). Nitrogen was added in the substrate as urea taking into account that urea can be converted into nitrate within 1 or 2 days (Harper, 1984). The amount of urea needed was calculated based on the targeted treatment level and the amount of available nitrogen in the substrate (Table 2), and urea was directly spread in the substrate, with the dates shown in Table 2. According to Sun (2013), 65 mg available nitrogen per kg substrate is the optimal level of nitrogen supply in commercial Lilium production for the cultivar used in this study. Treatments, with a plot area of 2.0 × 1.5 m2 and three replicates per treatment, were arranged in a split-plot design with water level assigned to the main plots and nitrogen level to the sub-plots.
Gas Exchange and Chlorophyll Fluorescence Measurements
Gas exchange was measured on newly fully expanded leaf (the 4th leaf counting from the top downward) at flower bud visible stage using the LI-6400 Portable Photosynthesis System (Li-Cor BioScience, Lincoln, NE, USA) under 21% O2. In Experiment 1, both light response curves and Ci response curves were measured in order to identify any differences in photosynthesis parameter estimation by using these two types of curves. For light response curves, incident irradiance (Iinc) in the leaf cuvette was decreased in the series of 1,500, 1,200, 1,000, 600, 400, 200, 100, 50, 20, and 0 μmol m−2 s−1, while keeping Ca at 370 μmol mol−1. For Ci response curves, Ca was increased stepwise: 50, 100, 150, 200, 250, 380, 650, 1,000, and 1,500, while keeping Iinc at 800 μmol m−2 s−1. The microclimate conditions in the leaf chamber were automatically controlled. The CO2 concentration and water vapor between leaf and the reference chamber were automatically matched before data were recorded. We found that photosynthesis parameters estimated from An-Iinc curves and An-Ci curves were similar (see Results). Therefore, in Experiments 2–4, only An-Iinc curves were measured, as measurement of An-Ci curves inevitably involves the problem of CO2 leakage into and out of the leaf cuvette, which would require additional measurements to correct for.
Chlorophyll fluorescence was simultaneously measured using FMS2 (Hansatech Instruments Ltd, UK) at a similar position on the leaf where gas exchange was measured. The steady-state fluorescence (Fs) was measured under natural radiation level (ranged from 0 to 1,200 μmol m−2 s−1) and saturating Iinc (at 1,500 μmol m−2 s−1) after 3–5 min light adaptation, followed by applying a light pulse > 7,000 μmol m−2 s−1 for <1 s to measure maximum fluorescence . The apparent operating efficiency of photosystem II photochemistry (Φ2) was calculated as (Genty et al., 1989).
Due to inadequate environmental control in the low-investment greenhouse, air temperature and VPD hardly stayed constant although they were kept within the range suitable for Lilium growth (Figures S1, S2). Therefore, all gas exchange and chlorophyll fluorescence measurements in the four experiments were subjected to variations of temperature and VPD.
In order to convert chlorophyll fluorescence data on Φ2 into electron transport rate, combined measurement of gas exchange and chlorophyll fluorescence was conducted using the LI-6400XT Portable Photosynthesis System (Li-Cor BioScience, Lincoln, NE, USA) at low oxygen using a gas blend of 2% O2 and 98% N2 in the leaf chamber at flower bud visible stage (Experiment 1). An−Iinc curves were measured while keeping Ca at 1,000 μmol mol−1, to create non-photorespiratory conditions. An at high Ca levels (i.e., 650, 1,000, and 1,500 μmol mol−1) at 2% O2 was also measured while keeping Iinc at 800 μmol m−2 s−1. Φ2 was assessed using the same procedure as described above. In order to establish the correlation of estimating Rd using different methods, combined measurement of gas exchange and chlorophyll fluorescence for An−Iinc curves (under 21% O2, keeping Ca at 370 μmol mol−1) was also conducted in Experiment 1. All gas exchange data wherever the set-point Ca differed from the ambient CO2 level were corrected for CO2 leakage from measurements using thermally killed leaves.
Leaf Characteristics
After gas exchange and chlorophyll fluorescence measurements, the leaves were cut, and leaf area was measured before being put in the oven at 105°C for 30 min and subsequently at 80°C until constant weight. Leaf nitrogen concentration (for organic nitrogen) was measured by using the Kjeldahl digestion method (Sun, 2013). Briefly, leaf dry samples were ground, and a 0.5 g of ground sample was digested with 30% hydrogen peroxide and 5 mL of concentrated sulphuric acid at 340°C. 10 mL of 10 mol L−1 sodium hydroxide was then added for distilling the digested solution. The distillate was titrated using 0.02 mol L−1 sulfuric acid, and bromocresol green-methyl red was used as the indicator. Leaf nitrogen content per unit leaf area (Na, g m−2) was calculated based on leaf nitrogen concentration, leaf dry weight and leaf area.
Estimation of Photosynthetic Model Parameters
The FvCB model (Farquhar et al., 1980) predicts net photosynthetic rate (An) as the minimum of the Rubisco carboxylation-limited rate (Ac) and the electron transport-limited rate (Aj):
where Cc and O are the chloroplast partial pressures of CO2 and O2, respectively; KmC and KmO are the Michaelis-Menten coefficients of Rubisco for CO2 and O2, respectively; Rd is day respiration; Γ* is the CO2 compensation point in the absence of Rd and was calculated as (Yin et al., 2004), derived from the parameter values of Bernacchi et al. (2001); J is the photosystem II electron transport rate that is used for CO2 fixation and photorespiration.
Rd was firstly estimated as the y-axis intercepts of the linear regression plots of An against Iinc (the Kok method hereafter) (Sharp et al., 1984). The Kok method tends to underestimate Rd (Sharp et al., 1984; Yin et al., 2011). Therefore, Rd was also estimated from the linear regression of An against (IincΦ2/4) (the Yin method hereafter) (Yin et al., 2009, 2011) using data available from the combined measurement of gas exchange and chlorophyll fluorescence, in order to establish the calibration relationship between values of Rd estimated by the two methods. As combined gas exchange and chlorophyll fluorescence data were used only in part of our measurements, all the Rd estimated based on the Kok method was then corrected according to the established calibration relationship to obtain Rd estimates for all treatments.
The calculation of Ac or Aj in the FvCB model requires Cc, which is unknown beforehand. Therefore, Aj relevant parameters were estimated based on Yin et al. (2009) using chlorophyll fluorescence data. To convert fluorescence-based data on Φ2 into electron transport rate J, a calibration needs to be made for each water and nitrogen treatment. This was done by linear regression plot of Aj against (IincΦ2/4), using data obtained under non-photorespiratory conditions from low light levels of the An−Iinc curve and three high CO2 levels. The slope s of this linear regression was used as a calibration factor to calculate values of electron transport rate under all conditions: J = sIincΦ2 (Yin et al., 2009). The obtained J was then fitted to the following equation to obtain electron transport parameters of the FvCB model:
where κ2LL is the conversion efficiency of incident light into J at strictly limiting light; Jmax is the asymptotic maximum value of J when Iinc approaches to saturating level; θ is a convexity factor for response of J to Iinc, and was assumed to have a constant value of 0.8 (Yin and Struik, 2015). Since chlorophyll fluorescence measurement was conducted under fluctuating temperature, the value of Jmax at 25 °C (Jmax25) and κ2LL were calculated by combining Equation (4) with Equation (7) (see later) that describes the temperature response of Jmax.
With Jmax25 and κ2LL calculated as described above, Jmax for each An−Iinc curve from gas exchange measurement was derived according to the temperature level during each measurement using Equation (7) (see later). J at each light level in the An−Iinc curve was then derived using Equation (4) based on Jmax and κ2LL calculated before.
With J and Rd calculated, gm was then estimated assuming that gm was constant across the entire light response curve. Whether or not gm is constant across light or CO2 levels remains debatable, but this assumption allows the identification of any differences among water and nitrogen treatments in the actual average gm. For that purpose, a relatively less measurement error-sensitive method, the NRH-A method (Yin and Struik, 2009a), was used to estimate the value of gm as constant, by fitting the following non-rectangular hyperbolic (NRH) equation for the Aj part of the Ci-based FvCB model:
where x1 = J/4 and x2 = 2Γ*; Ci is the intercellular CO2 level. According to our experimental data, Aj-limitation in a light response curve of Lilium usually occurred at or below 1,000 μmol m−2 s−1, as a good linear relationship between An and J was observed within this range (Figure S4). The advantages of the NRH-A method over other existing methods including the most widely used variable-J method in deriving the average gm was fully illustrated by Yin and Struik (2009a).
Equation (5) can also be applied to calculate Ac by setting: x1 = Vcmax and x2 = KmC(1+O/KmO). Vcmax was then estimated by fitting the combined Eqs. (1), (4) and (5) to the entire light response curve or Ci response curve using the already estimated values of Jmax, κ2LL, Rd and gm as input.
Temperature Responses of Photosynthesis Parameters
To account for the effect of the varying temperature during measurement, temperature response functions were introduced so that the estimation of key parameters could be adjusted to the same reference temperature for the comparison among treatments. The temperature responses of Rd and Rubisco kinetic properties (Vcmax, κmC and κmO) were described by an Arrhenius function Equation (6), and the temperature responses of Jmax and gm were described by a peaked Arrhenius function Equation (7), normalized with respect to their values at 25 C:
where X stands for each parameter; X25 is the value of each parameter at 25°C (Rd25, Vcmax25, κmC25, κmO25, Jmax25, and gm25); Ex is the activation energy of each parameter (ERd, EVcmax, EKmC, EKmO, EJmax, and Egm); Sx and Dx are the entropy term and the deactivation energy, respectively (applying to Jmax and gm); T is the leaf temperature; R is the universal gas constant. Since Rubisco kinetic properties are generally assumed conserved among C3 species (von Caemmerer et al., 2009), values of κmC25, κmO25, EKmC, and EKmO were fixed at 272.4 μbar, 165.8 mbar, 80,990 J mol−1, and 23,720 J mol−1, respectively, according to Bernacchi et al. (2002). To avoid over-parameterization, ERd was fixed at 46,390 J mol−1 (Bernacchi et al., 2001); SJmax and DJmax were fixed at 650 J K−1 mol−1 (Harley et al., 1992) and 200,000 J mol−1 (Medlyn et al., 2002), respectively; Egm, Sgm, and Dgm were fixed at 49,600 J mol−1, 1,400 J K−1 mol−1, and 437,400 J mol−1, respectively (Bernacchi et al., 2002).
The Relationships between Biochemical Parameters and Leaf Nitrogen Content
The photosynthetic capacity parameters Vcmax25 and Jmax25 are linearly related to Na (Harley et al., 1992; Braune et al., 2009):
where Nb is the base leaf nitrogen content at or below which An is zero, and a value of 0.35 g N (m2 leaf)−1 was used in this study (Archontoulis et al., 2012); χV is the slope of Vcmax25 against Na, and χJ is the slope of Jmax25 against Na.
Parameterization of the Stomatal Conductance Model
A phenomenological model for stomatal conductance for CO2 transfer was first described by Ball et al. (1987), revised by Leuning (1995), and further revised by Yin and Struik (2009b). Li et al. (2012) called this model the BWB-Leuning-Yin model. In the model, stomatal conductance was described by:
where g0 is the residual stomatal conductance when the irradiance approaches to zero; Ci* is the Ci-based CO2 compensation point in the absence of Rd and was calculated as (Γ*−Rd/gm) using Γ*, Rd and gm calculated before as input; f vpd is a function describing the effect of VPD, which is not yet understood sufficiently and may be described empirically as Yin and Struik (2009b):
where a1 represents the ratio of Ci to Ca for vapor saturated air, and b1 represents the decreasing slope of this ratio with increasing VPD, if g0 approaches to zero. Because of this obvious meaning of a1 and b1, we chose Equation (11), instead of the equation of Leuning (1995), for our analysis of the effect of VPD on gs. Combining Equations (10) and (11), g0, a1 and b1 can be estimated by using the data of An, Ci and VPD obtained from gas exchange measurement. For that, measured stomatal conductance for water vapor transfer was divided by a factor 1.6 to convert it to gs for CO2 transfer that is required for Equation (10).
Statistical and Model Analyses
Using a non-linear regression with the GAUSS method in PROC NLIN of SAS (SAS Institute Inc., Cary, NC, USA), FvCB model parameters (Vcmax25, Jmax25, κ2LL, Rd25, gm25, EVcmax, and EJmax) and BWB-Leuning-Yin model parameters (g0, a1, and b1) were estimated. Whether or not the treatment effect on each estimated parameter was significant was tested using an F-test. Following that, conserved parameter values across treatment classes were also estimated.
With these estimated parameters available, we aimed to test to what extent conserved parameter values could be used to predict An and gs under water and nitrogen stress combinations, for the purpose of simplifying model parameterization. For such, a step-wise procedure was followed. First, we analyzed whether or not water and nitrogen stress combinations change the linear relationships between biochemical parameters and Na, and tested to what extent conserved parameter values in the Ci-based FvCB model (Equation 5) could be used to predict An under different water and nitrogen conditions. Second, we tested to what extent conserved parameter values could be used in the BWB-Leuning-Yin model to predict gs under different water and nitrogen conditions. Third, we explored the coupled FvCB and BWB-Leuning-Yin model (for the analytical solution for this coupled model, see Yin and Struik, 2009b), which allows using Ca as input to predict An. We used this coupled model to assess to what extent conserved parameter values in both the FvCB model and the BWB-Leuning-Yin model could be used to predict An (using Ca as input) across various water and nitrogen treatment regimes.
Results
Model Parameterization
Data of An−Iinc curves showed that both water-deficit conditions and low nitrogen supply decreased An (Figure 1). The initial linear part of these curves was explored to estimate Rd. Values of Rd estimated by the Kok method were generally lower than those estimated by the Yin method (Figure 2). The linear correlation between values of Rd estimated by the two methods (Figure 2) was used to correct all Rd estimated by the Kok method.
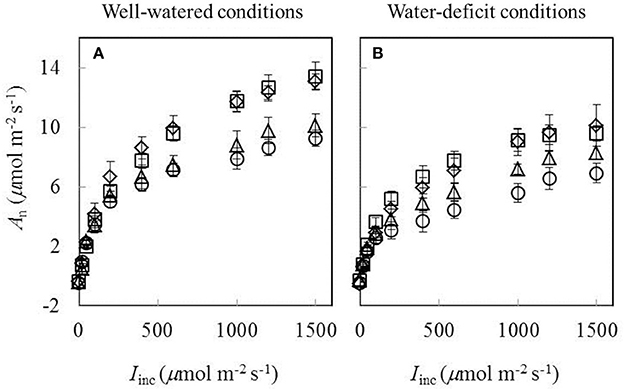
Figure 1. Response curves of net CO2-assimilation rate (An) to incident irradiance (Iinc) obtained under (A) well-watered conditions and (B) water-deficit conditions (N85: diamond; N65: square; N45: triangle; N25: circle. Mean ± standard error of 6 replicated plants). Leaf temperature during measurement = 20 ± 2°C.
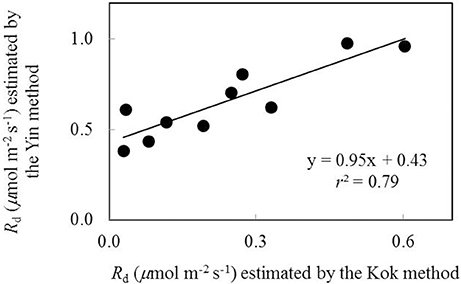
Figure 2. The relationship between values of day respiration (Rd) estimated by Kok and Yin methods (Each point represents the estimate of Rd using the same An-Iinc curve).
The plot of Aj against (Iinc Φ2/4) using data obtained under low O2 condition from low light levels of the An−Iinc curves and three high CO2 levels was essentially linear (Figure 3). Both water and nitrogen conditions affected the value of the linear slope s, the calibration factor used to convert Φ2 into J. The factor decreased by low nitrogen supply and by water-deficit conditions.
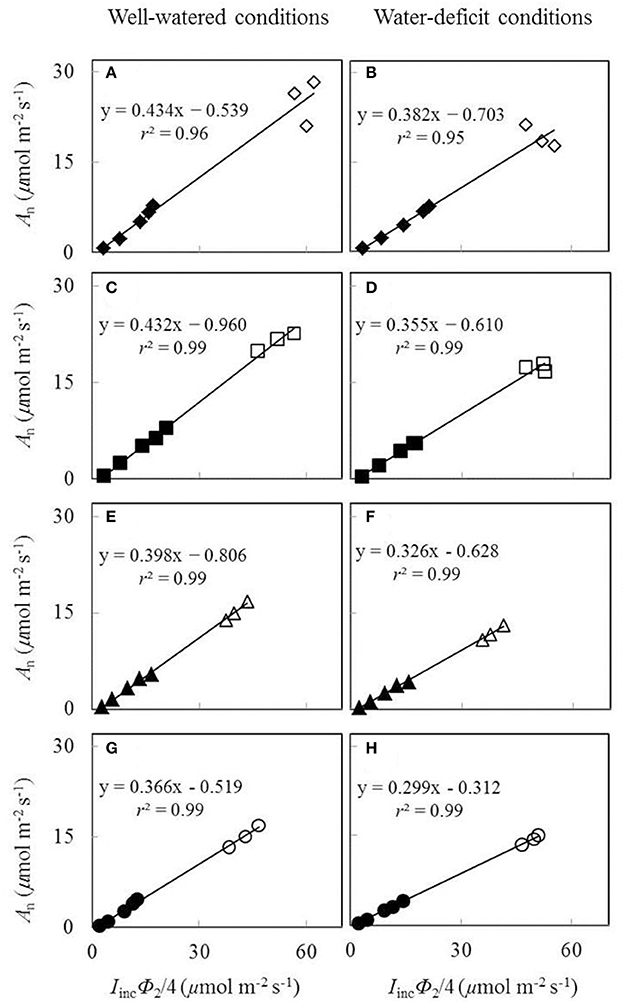
Figure 3. Net CO2-assimialtion rate (An), measured under a non-photorespiratory condition, as a function of IincΦ2/4 under well-watered conditions (A,C,E,G) and water-deficit conditions (B,D,F,H) (N85: A,B; N65: C,D; N45: E,F; N25: G,H. Closed symbols are from low light levels of the An-Iinc curves; open symbols are from three high CO2 levels at the same Iinc of 800 μmol m−2 s−1; data for open symbols and closed symbols in the same panel were measured on the same leaf; see the text).
Vcmax estimated from An-Iinc curves and from available An-Ci curves under the same measurement conditions were very similar when using the same input values of Jmax, κ2LL, Rd, and gm (Figure 4). This suggested the reliability of using An-Iinc curves to estimate Vcmax. The estimated parameter values of the FvCB model for each treatment are listed in Table 3, and those of the BWB-Leuning-Yin model and gm are listed in Table 4. All parameters were reliably estimated, as the standard error values of the estimates were relatively small (Tables 3, 4).
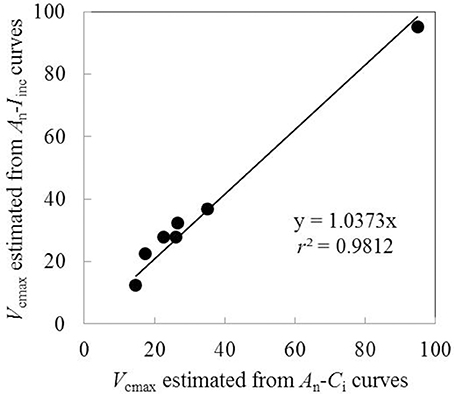
Figure 4. Comparison of Vcmax estimated from An-Iinc curves and An-Ci curves using the same input values of Jmax, κ2LL, Rd and gm (Each point represents value of Vcmax estimated from An-Iinc curve or An-Ci curve measured on the same leaf).
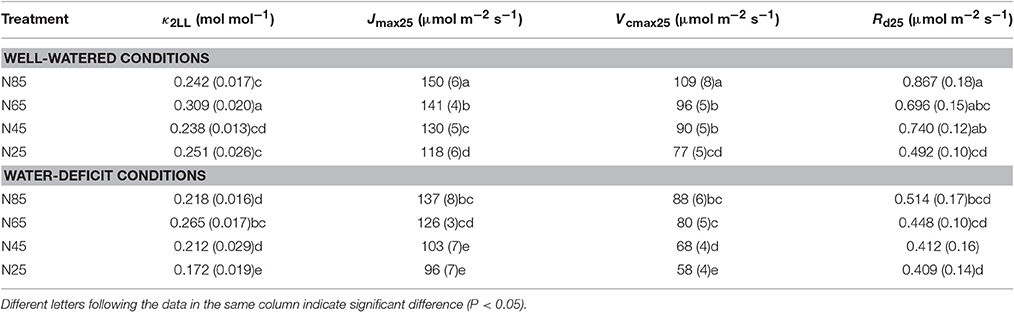
Table 3. List of parameter values (standard error of estimate in brackets if available) estimated for the FvCB model under different water and nitrogen treatments.
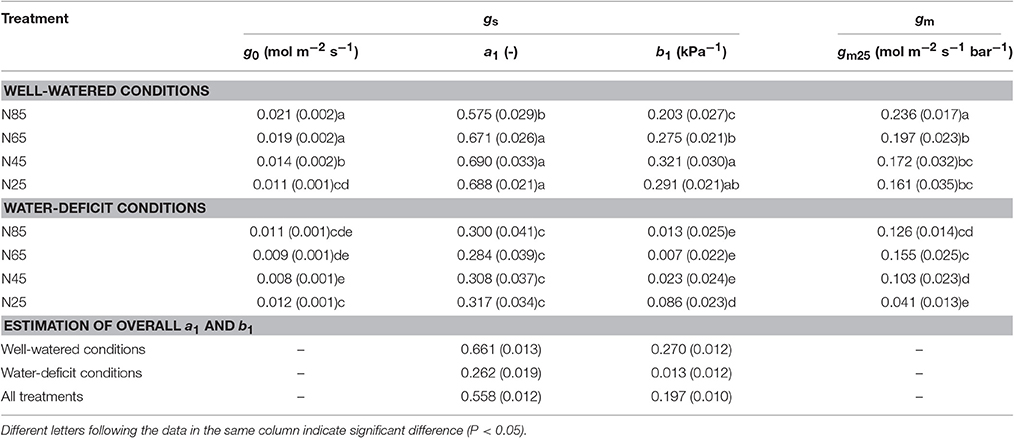
Table 4. List of parameter values (standard error of estimate in brackets if available) estimated for parameters in the BWB-Leuning-Yin model of stomatal conductance (gs) and for mesophyll conductance (gm).
The Response of Estimated Parameter Values to Water and Nitrogen Treatments
Water-deficit conditions significantly decreased Vcmax25, Jmax25, k2LL, and Rd25 at all nitrogen levels (Table 3). Vcmax25, Jmax25, and Rd25 decreased with decreasing of nitrogen availability whereas κ2LL showed such a response to a much less clear extent under both water-deficit conditions and well-watered conditions (Table 3). Vcmax25, Jmax25, and κ2LL were significantly lower in the combined water deficit and low nitrogen availability treatments than in other treatments (Table 3). Neither EJmax nor EVcmax was significantly affected by water and nitrogen treatments (Table S1).
Water-deficit conditions significantly decreased g0, a1, b1, and gm25 at all nitrogen levels (Table 4). g0 and gm25 decreased with decreasing nitrogen availability whereas a1 and b1 responded little to nitrogen treatments under both water-deficit conditions and well-watered conditions (Table 4). gm25 was significantly lower under the combined water deficit and the lowest nitrogen availability treatment than in other treatments (Table 4).
The Relationships between Estimated Parameter Values and Leaf Nitrogen Content
Under both water-deficit conditions and well-watered conditions, Vcmax25, Jmax25, κ2LL, Rd25, gm25, and g0 linearly increased with increasing Na (Figure 5). XV and XJ were determined as 62 μmol (g N)−1 s−1 and 93 μmol (g N)−1 s−1, respectively (Figures 5A,C). The Na-dependent relationship was relatively less clear for other parameters (Figures 5B,D-F), but an F-test revealed that water and nitrogen treatments did not significantly alter the linear relationships in all the six parameters. Linear relationship existed between Vcmax25 and Jmax25 with a slope of 1.49 under different water and nitrogen treatments (Figure 6).
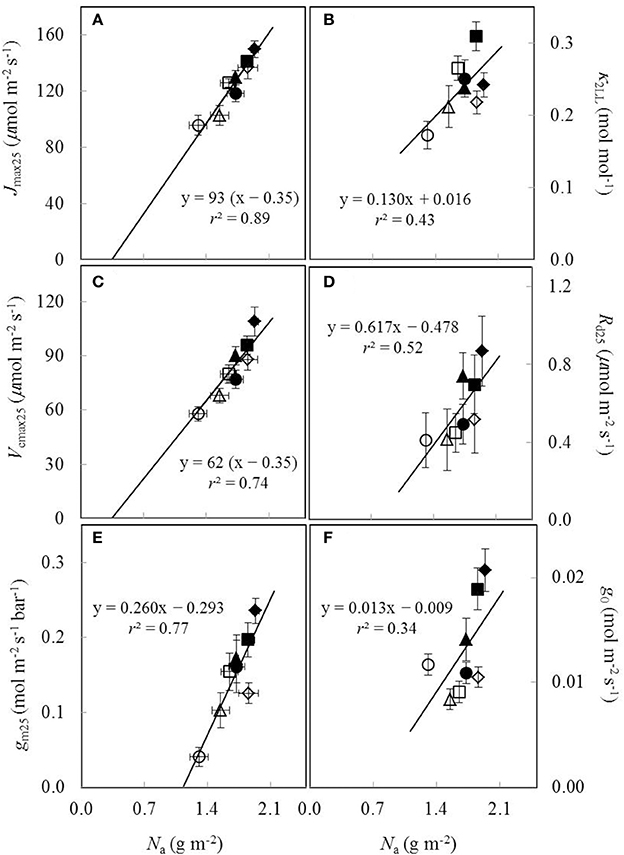
Figure 5. The estimated parameters values for (A) the maximum electron transport rate (Jmax25), (B) the conversion efficiency of limiting incident light into linear electron transport of photosystem II (κ2LL), (C) the maximum Rubisco carboxylation rate (Vcmax25), (D) day respiration (Rd25), (E) mesophyll conductance (gm25), and (F) residual stomatal conductance when the irradiance approaches to zero (g0), all as a function of leaf nitrogen content (Na) under different water and nitrogen treatments (Well-watered conditions: closed symbols; water-deficit conditions: open symbols. N85: diamond; N65: square; N45: triangle; N25: circle. Vertical error bar indicates standard error of estimate; horizontal error bar indicates standard error of the mean measured value).
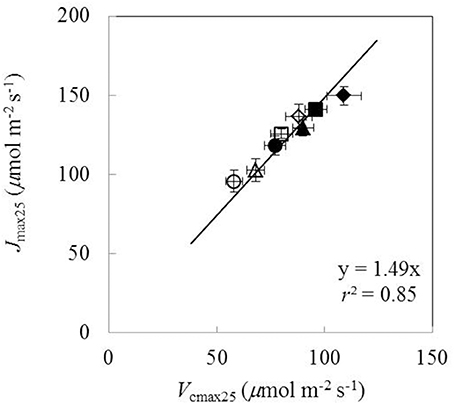
Figure 6. The relationship between the maximum Rubisco carboxylation rate (Vcmax25) and the maximum electron transport rate (Jmax25) under different water and nitrogen treatments (Well-watered conditions: closed symbols; water-deficit conditions: open symbols. N85: diamond; N65: square; N45: triangle; N25: circle. Error bars indicate standard error of estimate).
Comparison between Model Predictions and Measured Values for An and gs
Since the linear relationships between biochemical parameters and Na were found to exist under different treatment combinations (Figure 5), we further tested to what extent conserved parameter values could be used in the FvCB model to predict An under different water and nitrogen conditions. Two sets of comparisons between the measured An and the predicted An were conducted, (i) using treatment-specific parameter values (i.e., using specific parameter values obtained under each treatment) (Figures 7A,B), and (ii) using shared parameter values (i.e., incorporating the Na-dependent linear relationships and using overall EJmax and EVcmax values) (Figures 7C,D). For this second set of comparison, the overall values of EJmax and EVcmax for all treatments were estimated (Table S1) by incorporating the linear relationships between parameters (Vcmax25, Jmax25, κ2LL, Rd25, and gm25) and Na. The coefficient of determination (r2) between estimated and measured An in both comparisons ranged from 0.85 to 0.94 (Figure 7).
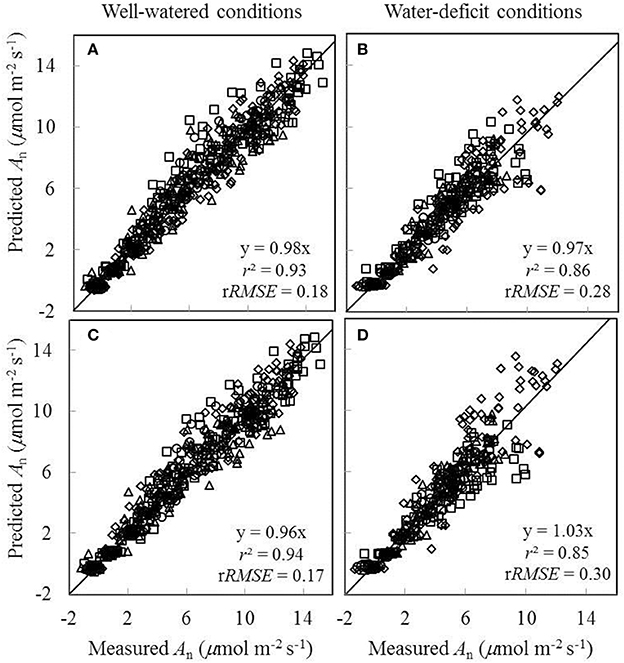
Figure 7. Comparisons between the measured net CO2-assimilation rate (An) and the predicted An by the Ci-based FvCB model either using treatment-specific parameter values (A,B), or using shared parameter values (C,D) (Well-watered conditions: A,C; water-deficit conditions: B,D. N85: diamond; N65: square; N45: triangle; N25: circle). The equation in each panel represents the linear regression of predicted (y) vs. measured values (x) by forcing the line through the origin, r2 is the determination coefficient of the regression, and rRMSE is the relative root-mean-square error (= , where n is the number of data points, and is the mean of the measured values).
We also tested to what extent conserved parameter values could be used in the BWB-Leuning-Yin model (Equations 10 and 11) to predict gs under different water and nitrogen conditions. Since nitrogen had been found to have little effect on a1 and b1 (Table 4) and g0 could be linearly correlated with Na under both well-watered conditions and water-deficit conditions (Figure 5F), we tested to what extent conserved values of a1, b1, and g0 can be used. For this purpose, we incorporated the linear relationships between model parameters (g0 and gm25) and Na, and estimated overall values of a1 and b1 for all treatments (Table 4). Three sets of comparisons between the measured gs and the predicted gs were conducted, (i) using treatment-specific parameter values (Figures 8A,B), (ii) using shared parameter values for each water treatment (i.e., incorporating the Na-dependent linear relationships and using overall values of a1 and b1 for each water treatment group given in Table 4) (Figures 8C,D), and (iii) using shared parameter values for all treatments (i.e., incorporating the Na-dependent linear relationships and using overall values of a1 and b1 for all treatments given Table 4) (Figures 8E,F). Using treatment-specific parameter values in the BWB-Leuning-Yin model, the r2 between estimated and measured gs was 0.61 under well-watered conditions and 0.57 under a water deficit (Figures 8A,B); using shared parameter values for each water treatment, the r2 was 0.55 for well-watered plants and 0.43 under a water deficit (Figures 8C,D). When shared parameters were used for all treatments, gs was appreciably underestimated under well-watered conditions (Figure 8E), but overestimated under a water deficit (Figure 8F). This third set of predictions of gs, when compared with the first set of predictions, underestimated gs by 9% under well-watered conditions and overestimated gs by 13% under water-deficit conditions.
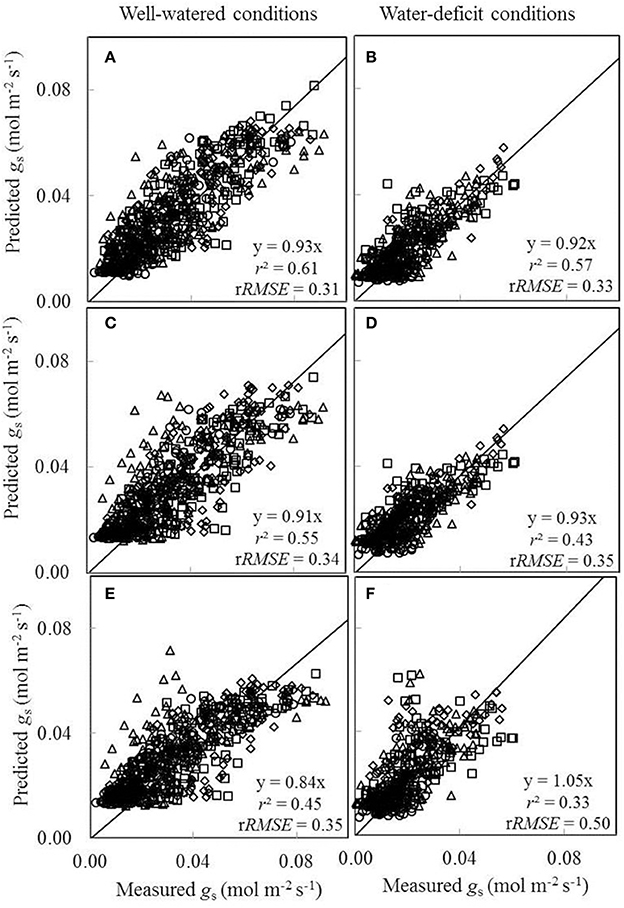
Figure 8. Comparisons between the measured stomatal conductance for CO2 diffusion (gs) and the predicted gs by the BWB-Leuning-Yin model either using treatment-specific parameter values (A,B), or using shared parameter values for each water treatment (C,D), or using shared parameter values for all treatments (E,F) (Well-watered conditions: A,C,E; water-deficit conditions: B,D,F. N85: diamond; N65: square; N45: triangle; N25: circle). For further details, see Figure 6.
As gs was either underestimated or overestimated by the BWB-Leuning-Yin model using shared parameter values for all treatments (Figures 8E,F), we further assessed the impact of this inaccurate estimation of gs on the prediction of An. Two sets of comparisons between the measured An and the predicted An were conducted. In the first comparison, shared values of the FvCB model parameters for all treatments and shared values of the BWB-Leuning-Yin model parameters for each water treatment were used in the coupled model; the r2 between estimated and measured An was 0.89 under well-watered conditions and 0.80 under water-deficit conditions (Figures 9A,B). In the second comparison, shared values of both the FvCB model parameters and the BWB-Leuning-Yin model parameters for all treatments were used; the r2 was 0.89 under well-watered conditions (Figure 9C), but An was overestimated by 9% under water-deficit conditions (Figure 9D).
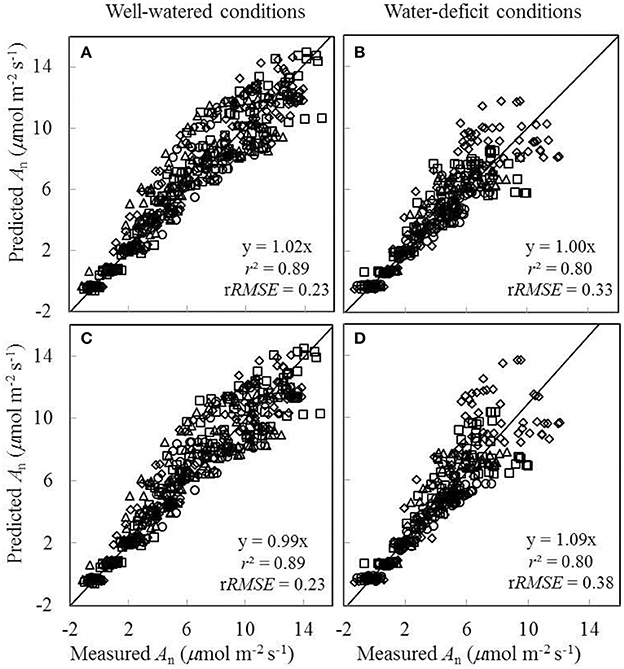
Figure 9. Comparisons between the measured net CO2-assimilation rate (An) and the predicted An by the coupled FvCB and BWB-Leuning-Yin model using shared values of the FvCB model parameters for all treatments combined either with shared values of the BWB-Leuning-Yin model parameters for each water treatment (A,B), or with shared values of the BWB-Leuning-Yin model parameters for all treatments (C,D) (Well-watered conditions: A,C; water-deficit conditions: B,D. N85: diamond; N65: square; N45: triangle; N25: circle). For further details, see Figure 6.
Discussion
Methodology to Estimate Photosynthetic Parameters
In our study, all model parameters were estimated based on the An-Iinc curves, instead of An-Ci curves, for estimating the FvCB parameters. We tested that the estimated Vcmax values by using these two types of curves were quite similar (Figure 4), as also shown in a previous study (Archontoulis et al., 2012). The approach of using An-Iinc curves provides an alternative to the prevailing approach of using An-Ci curves and has its own advantages. First, the FvCB model is commonly used to predict leaf photosynthesis in canopies under field conditions, where it is the light level, not the CO2 level, that fluctuates most significantly in space and in time. This suggests that the FvCB parameters estimated from An-Iinc curves should more closely represent field situations, relative to those based on An-Ci curves. Second, using An-Ci curve is known to have problems of CO2 leakage and down-regulation of Rubisco at the low level of CO2 during the measurement. The An-Iinc curve-based approach avoids these problems since the whole response curve is measured under ambient CO2 level. However, using An-Iinc curves also tends to have problems. First, Vcmax cannot always be estimated from An-Iinc curves since the entire An-Iinc curve can be Aj limited sometimes (Archontoulis et al., 2012), especially for field crops that have high light saturating point (e.g., cotton, Wise et al., 2004). Second, the rate of TPU (triose phosphate utilization), if exerting a limitation on photosynthesis, cannot be estimated using An-Iinc curves since like Rubisco limitation, any TPU limitation on An-Iinc curves also happens at high irradiance levels (Archontoulis et al., 2012). Nevertheless, our limited data (Figure 4) show the evidence in support of using An-Iinc curves as an alternative approach to estimate Vcmax. More comparisons between the two approaches using An-Iinc and using An-Ci curves are needed for different crop types and environments.
We adopted some parameter values from the literature as input to avoid over-parameterization of the FvCB model. First, θ (the convexity factor for response of electron transport rate to incident light) was set to a constant value of 0.8 according to Yin and Struik (2015). It is worthy to notice that the actual value of θ could vary across species and environments. In our experiment, θ may be affected by different water and nitrogen treatments, as well as different light environment caused by different growth season. Initial analyses showed that letting θ be fitted as well resulted in enormous unrealistic variation of the estimated Jmax and κ2LL. Since the biological meaning of θ is less obvious than that of Jmax and κ2LL, we decided to set θ as a constant value to avoid biased estimations of Jmax and κ2LL. Equation (4) with θ of 0.8 generates a very similar light response shape as given by the other widely used quadratic hyperbolic equation initially used by Harley et al. (1992). Second, in line with some previous studies (Xu and Baldocchi, 2003; Li et al., 2012), we adopted the activation energy of Rd (ERd) and gm (Egm), the deactivation energy of Jmax (DJmax) and gm (Dgm), and the entropy term of Jmax (SJmax) and gm (Sgm) from literature (Bernacchi et al., 2001, 2002). Whether or not these temperature response parameters change with water and nitrogen conditions is still not clear and further studies are needed. Third, Rubisco kinetic properties (κmC25, κmO25, EKmC, and EKmO) were adopted from Bernacchi et al. (2002). Despite the generally assumption that Rubisco kinetic properties are conserved among C3 species (von Caemmerer et al., 2009), values of these constants reported in the literature are different (Bernacchi et al., 2001, 2002; Dreyer et al., 2001). The choice of Rubisco parameters also affected our FvCB parameter estimation. Since all parameters in the FvCB model are interrelated with each other, potential errors in our parameter estimation exist if parameter values we adopted from the literature were not applicable in our study.
Photosynthetic Biochemical Parameters in Response to Water and Nitrogen Conditions
Our study showed that a long-term mild water deficit and water and nitrogen stress combinations did not have significant effects on the linear relationships between biochemical parameters of the FvCB model (i.e., Jmax25, κ2LL, Vcmax25) and leaf nitrogen content per unit area (Na) (Figure 5). Previous studies showed that a short-term water deficit did not change the linear relationships between biochemical parameters and Na (Díaz-Espejo et al., 2006; Gu et al., 2012), whereas under long-term drought, either the slopes of the relationships between biochemical parameters and Na were changed (Wilson et al., 2000; Díaz-Espejo et al., 2006) or considering the effect of leaf mass per area (LMA) in the linear regressions was needed (Xu and Baldocchi, 2003). A few other studies (Damour et al., 2008, 2009) found that drought totally modified the fundamental relationships between Jmax and Na since Na was either increasing (Damour et al., 2008) or not affected (Damour et al., 2009) under drought whereas Jmax decreased. The discrepancy of the response of Na to drought found in different studies may be caused by different species. Damour et al. (2008) worked with lychee tree and Damour et al. (2009) worked with mango tree, whereas we focused on herbaceous species Lilium and Gu et al. (2012) worked with rice. Besides, different approaches used to estimate FvCB parameters could also affect the results in different studies. First, as stated earlier, we used An-Iinc curves to parameterize the FvCB model. Whether or not the approach of using An-Iinc curves and the approach of using An-Ci curves yield similar results under drought still requires more comparisons. Second, early studies tend to ignore s (the calibration factor for converting fluorescence-based efficiency of photosystem II photochemistry Φ2 into electron transport rate J) and gm (mesophyll conductance) during the estimation of biochemical parameters. This could lead to inaccurate estimation of biochemical parameters since both s (Figure 3) and gm (Table 4; also reviewed in Flexas et al., 2008) decreased under drought.
The calibration factor s used to convert Φ2 into J is actually a lumped physiological parameter (s = ρ2β[1–f pseudo/(1−f cyc)]) that includes the absorptance of light by leaf photosynthetic pigments (β), the proportion of absorbed light partitioned to photosystem (PS) II (ρ2), and the fraction of electrons at PSI following the cyclic transport around PSI (f cyc) and following the pseudocyclic transport (f pseudo) (Yin et al., 2009; Yin and Struik, 2009a). s was found to decrease by low nitrogen supply in previous study (Yin et al., 2009), which is also found in our study (Figure 3). This decrease may be explained by the decreasing of β as a result of the decreased photosynthetic pigments in low-nitrogen leaves (Evans and Terashima, 1987). Interestingly, we found that s was smaller under water-deficit conditions compared to that under well-watered conditions despite the similar Na (e.g., s in N65 under well-watered conditions compared with s in N85 under water-deficit conditions). It has been reported that drought did not change the partitioning of electrons between PSI and PSII (Genty et al., 1987). However, stomatal closure caused by drought results in the decreasing of CO2 concentration in the leaf, and consequently the amount of electrons used for CO2 fixation decreases (Cornic and Briantais, 1991). Excessive electrons need to be consumed by other sinks apart from CO2 fixation by following pseudo-cyclic electron transport (Cornic and Briantais, 1991; Biehler and Fock, 1996), or electrons need to follow cyclic flow around PSI (Kohzuma et al., 2009). Our results for the decreased s under water-deficit conditions independent on Na suggest that drought induced an increase of f pseudo or f cyc or both in our experimental conditions.
Associated with estimating the factor s, mitochondrial day respiration (Rd) was estimated. Water-deficit conditions did not affect Rd in all N treatments, and there were non-significant effects of nitrogen on Rd under both well-watered conditions and water-deficit conditions (Table 3). Nevertheless, water-deficit conditions significantly decreased Rd in N85 and N45 treatments and generally there was a trend showing that drought and decreasing of nitrogen level decreased Rd (Table 3), as also revealed in some previous studies (González-Meler et al., 1997; Huang and Fu, 2000). Therefore, we established an Na-dependent relationship of Rd (Figure 5F) and applied this relationship to capture the changes of Rd under different water and nitrogen conditions. The linear relationship between respiration rate and leaf nitrogen content was also found under different light conditions (Ryan, 1995) and growth locations (Reich et al., 1998).
A relatively stable Jmax25/Vcmax25 ratio among different water and nitrogen treatments was found in our study (Figure 6), in line with some previous studies (Makino et al., 1992; Walcroft et al., 1997; Díaz-Espejo et al., 2006). Some studies simplified the parameterization of the FvCB model by using a fixed value for either the Jmax/Vcmax ratio (Kosugi et al., 2003) or the Jmax25/Vcmax25 ratio (Müller et al., 2005). However, care needs to be taken in setting a constant Jmax/Vcmax ratio. First, when temperature varies, this ratio cannot be constant because Jmax and Vcmax have different temperature response curves. In fact, the Jmax/Vcmax ratio was found to decrease with temperature increase (Walcroft et al., 1997; Medlyn et al., 2002; Díaz-Espejo et al., 2006). When scaled to a common temperature, a better correlation between Jmax and Vcmax was found (Leuning, 1997). Second, gm has a strong influence on this Jmax/Vcmax ratio. In early studies (Grassi et al., 2002) when gm was not considered, a Jmax/Vcmax ratio of ca 2.0 was obtained (Leuning, 1997), which is higher than our estimate where gm was considered (ca 1.5, Figure 6). Finally, some studies found that water and nitrogen conditions also affected the Jmax/Vcmax ratio (Grassi et al., 2002; Gu et al., 2012). Therefore, the approach using a fixed value for the Jmax/Vcmax ratio to parameterize the FvCB model should receive critical reservation (Xu and Baldocchi, 2003; Archontoulis et al., 2012).
In short, our study suggested that it is feasible to incorporate linear relationships between biochemical parameters and Na in the FvCB model to predict photosynthesis under different water and nitrogen conditions, since the FvCB model using shared parameter values for all treatments gave satisfactory predictions of An under different water and nitrogen conditions (Figures 7C,D).
Stomatal Conductance Parameters and Mesophyll Conductance in Response to Water and Nitrogen Conditions
Accurately modeling stomatal conductance (gs) and mesophyll conductance (gm) are necessary steps toward predicting An under changing environments. The BWB-type model of gs takes into account the effects of both environments and plant physiological status on gs, and has been widely tested able to satisfactorily predict gs for well-watered plants (Leuning, 1995; Li et al., 2012). Some efforts have been devoted to predict gs under drought conditions using the BWB-type model by introducing proper approaches to adjust parameter values used in the model. In general, most studies kept g0 (residual stomatal conductance when the irradiance approaches to zero) as a fixed value and adjusted the value for the slope (roughly represents a1 and b1 in the BWB-Leuning-Yin model used in our study) by introducing a modifying factor of soil moisture (Egea et al., 2011; Li et al., 2012), or precipitation and evaporation (Baldocchi, 1997), or predawn xylem water potential (Sala and Tenhunen, 1996), or leaf nitrogen content and leaf water potential (Müller et al., 2014). Leuning (1995) suggested that the BWB-type model should be able to predict gs under water-deficit conditions by only adjusting the value for a1. We found that both a1 and b1 decreased with the decreasing of SWP (Table 4), and without considering these decreases, gs was overestimated under water-deficit conditions (Figure 8F). Further estimation of a1 under water-deficit conditions by using the value for b1 obtained under well-watered conditions resulted in a value of 0.586 for a1, which is much larger than the original value of 0.262 obtained under water-deficit conditions (Table 4). Therefore, values for both a1 and b1 need to be adjusted to properly predict gs under water-deficit conditions. However, a1 and b1 were little affected by nitrogen availability (Table 4) and no correlation between a1 and Na, nor between b1 and Na, under different water and nitrogen conditions was found in our study. The approach introducing a modifying factor of leaf nitrogen content on the slope (Müller et al., 2014) is able to predict gs in response to drought, and this could merely be due to similar responses of leaf nitrogen content and the slope to soil water condition rather than because a functional relationship exists between the slope and leaf nitrogen content. Our study did not present a quantitative relationship of a1 and b1 with water supply conditions since there were only two water-level treatments. Further studies including more water levels would be needed to quantify changes of a1 and b1 under different water and nitrogen conditions.
g0 was affected by both water conditions and nitrogen availability (Table 4), and a linear relationship between g0 and Na (Figure 5F) was used in our study to take into account the changes of g0 under different water and nitrogen conditions. Although this linear relationship is less clear compared to linear relationships between Na and biochemical parameters (e.g., Jmax25 and Vcmax25) (Figure 5), an F test showed that there is no significant difference between using a conserved linear relationship and using separate relationships to describe the Na dependence of g0 in response to water-deficit conditions. Under drought, plants tend to reserve water by reducing water loss, which makes it unlikely that g0 is unaffected by water-deficit conditions. However, few modeling studies considered the change of g0 under drought condition (Misson et al., 2004; Keenan et al., 2010). The reason for using a fixed value for g0 in previous studies could be that changing the value of g0 should not affect the prediction of gs very much for plants with relatively high gs since the value of g0 itself is normally very small and approaches to zero. However, this may not hold true for plants with low gs, as is the case in our study, since the value of g0 may have relatively larger impact on predicting gs.
gm has received growing attentions in modeling photosynthesis (Niinemets et al., 2009), since gm has been found to be finite and vary greatly among environments (Flexas et al., 2008; Yin et al., 2009). Previous studies found that gm decreased under drought and low nitrogen availability (reviewed in Flexas et al., 2008). We found that gm was enhanced by high nitrogen level and strongly decreased by the combination of water deficit and low nitrogen availability (Table 4). A relatively strong linear correlation between gm and Na was found in our study (Figure 5E), as also found in previous studies (von Caemmerer and Evans, 1991; Warren, 2004). Such a correlation may be explained by the surface area of the chloroplasts facing the cell walls, an anatomical determinant of gm (von Caemmerer and Evans, 1991; Evans et al., 1994), which depends on Na.
Our results showed that the relation between gm and Na was hardly changed by water-deficit conditions (Figure 5E). In contrast, Gu et al. (2012) found that the change of gm by water-deficit conditions was not explained by the change of Na but was negatively correlated with LMA. Nevertheless, LMA is generally considered as setting a limitation for the maximum gm (Flexas et al., 2008; Perez-Martin et al., 2009) rather than is used to model gm in response to environments, mainly because the change of LMA results from the long-term environmental adaptation of the plants (Poorter et al., 2009) whereas gm can vary quickly in response to environmental changes (Flexas et al., 2006). This is supported by our result of using the Na-dependent linear relationship to take into account the effects of water and nitrogen on gm. Together with the incorporation of other Na-dependent relationships of biochemical parameters, the model yielded similar results of An prediction compared to those using treatment-specific parameter values (Figure 7).
Some studies incorporated a dependence of gm on gs in the photosynthesis model (Cai et al., 2008) as a close correlation between gs and gm in response to soil water deficit was commonly observed (Flexas et al., 2002; Warren, 2008; Perez-Martin et al., 2009). An approach incorporating the dependence of gm on gs was shown to give better prediction of An of different genotypes than the one incorporating the dependence of gm on leaf nitrogen (Ohsumi et al., 2007). However, the approach has been criticized as having no physiological justification (Niinemets et al., 2009) since gm and gs respond differently to other environmental factors such as VPD (Warren, 2008; Perez-Martin et al., 2009). As there is not yet sufficient physiological knowledge to reliably quantify the variability of gm, some studies merely used a modifying factor of soil water conditions to take into account the effect of water deficit on gm (Keenan et al., 2010; Egea et al., 2011). Whether or not the linear relationship between gm and Na could be a promising step toward modeling the variation of gm needs to be further tested.
The Effect of gs Estimation on the Prediction of An
The coupled FvCB and BWB model has been increasingly used to model photosynthesis in response to environmental changes such as elevated CO2 (Harley et al., 1992) and drought stress (Keenan et al., 2010; Müller et al., 2014) and seasonal changes (Kosugi et al., 2003). Normally in those previous studies, values of the biochemical parameters were related to the leaf nitrogen content and values of the stomatal conductance model parameters were changed according to the CO2 level (Harley et al., 1992), leaf water potential (Müller et al., 2014), or growth season (Kosugi et al., 2003).
Our study showed that considering the decreases of the stomatal conductance model parameters (a1 and b1) by drought was needed, otherwise, the coupled FvCB and BWB-Leuning-Yin model overestimated An under drought (Figure 9D) due to an overestimation of gs (Figure 8F). The strong decrease of a1 by drought (Table 4) indicates the decreasing of Ci/Ca ratio for vapor saturated air. The decrease of b1 by drought (Table 4) suggests a negligible control of VPD on gs under drought condition. These results are in line with previous studies that under drought condition, gs at vapor nearly saturated air tended to be lower and gs was less sensitive to VPD (Forseth and Ehleringer, 1983; Perez-Martin et al., 2009). However, an exceptional case, which gs showed much stronger sensitivity to VPD under drought, was also found in the previous study without an explanation provided (Perez-Martin et al., 2009).
The BWB-Leuning-Yin model without considering the effect of water level on a1 and b1 also underestimated gs under well-watered conditions (Figure 8E). But the subsequent prediction of An was not affected much (Figure 9C). This is probably explained by that under well-watered conditions, Ci is generally high and changing Ci at its high level only slightly affects An according to the diminishing-return relationship of An vs. Ci. Therefore, as shown in Figure 9, the estimation of gs had more effect on the prediction of An under water-deficit conditions than under well-watered conditions.
Concluding Remarks
A previous analysis (Yin, 2013) showed that the relationship of many crop model parameters (including those FvCB biochemical parameters) as a function of plant nitrogen status was little altered by elevated CO2 concentration. Our present study examined whether this assertion could be extended for the water and nitrogen stress combinations. We showed that the Na dependence of biochemical parameters of the FvCB model, g0 of the BWB-Leuning-Yin model and the gm value were little altered by water and nitrogen stress combinations (Figure 5). By incorporating these Na-dependent relationships with the FvCB model and BWB-Leuning-Yin model, parameterization of these models could be simplified while maintaining satisfactory predictions. The obvious exception is parameters a1 and b1 of the BWB-Leuning-Yin model, which depended little on nitrogen treatments but greatly on water treatments (Table 4). This is probably because the BWB-Leuning-Yin model is largely phenomenological, and its related conclusions are only valid for the specific species and conditions examined in this study. While the variation of parameters a1 and b1 had a great impact on the prediction of stomatal conductance, it had a considerably lower impact on the prediction of leaf photosynthesis. Nevertheless, a further study is needed to quantify how these two parameters vary with water-deficit conditions, as they have a stronger bearing on modeling leaf transpiration.
Author Contributions
NZ analyzed the data and drafted the manuscript. GL, SY, DA, and QS carried out the measurements. WL and XY made substantial contributions to conception and experimental design, and critically revised the manuscript.
Conflict of Interest Statement
The authors declare that the research was conducted in the absence of any commercial or financial relationships that could be construed as a potential conflict of interest.
The reviewer DT and handling Editor declared their shared affiliation, and the handling Editor states that the process nevertheless met the standards of a fair and objective review.
Acknowledgments
This research was funded by China Natural Science Foundation (31171453), and was conducted in the framework of collaboration between the College of Agriculture, Nanjing Agricultural University and the Centre for Crop Systems Analysis, Wageningen University & Research. NZ thanks the China Scholarship Council for awarding her a fellowship to conduct this work. We thank Dr. Chuang Cai for the discussion about data analysis and the two reviewers for their critical comments.
Supplementary Material
The Supplementary Material for this article can be found online at: http://journal.frontiersin.org/article/10.3389/fpls.2017.00328/full#supplementary-material
Table S1. Activation energy of Jmax and Vcmax (standard error of estimate in brackets) estimated for each water and nitrogen treatments and their shared values for all treatments. Different letters following the data in the same column indicate significant difference (P < 0.05).
Figure S1. Daily mean, maximal and minimal air temperature at the height of 1.5 m above ground inside the greenhouse during (A) Exp. 1, (B) Exp. 2, (C) Exp. 3, and (D) Exp. 4. Solid curve is daily mean air temperature, dashed curve on top is the daily maximal air temperature, dotted curve at bottom is the daily minimal air temperature.
Figure S2. Vapor pressure deficit (VPD) at the height of 1.5 m above ground inside the greenhouse during (A) Exp. 1, (B) Exp. 2, (C) Exp. 3, and (D) Exp. 4. Curve is daily mean VPD, solid line is the average daily mean VPD during the whole growth period, and dashed lines are the maximal and minimal daily mean VPD during the whole growth period, respectively.
Figure S3. Daily mean photosynthetic active radiation (PAR) above crop canopy inside the greenhouse during (A) Exp. 1, (B) Exp. 2, (C) Exp. 3, and (D) Exp. 4. Curve is daily mean PAR, and line is the average daily mean PAR during the whole growth period.
Figure S4. Relationships between An and J under well-watered conditions (A,C,E,G) and water-deficit conditions (B,D,F,H) (N85: A,B; N65: C,D; N45: E,F; N25: G,H). All data points were chosen from light levels at or below 1,000 μmol m−2 s−1 and leaf temperature at 20 ± 2°C (Vertical error bar indicates standard error of measured An; horizontal error bar indicates standard error of calculated J).
References
Adam, M., Van Bussel, L. G. J., Leffelaar, P. A., Van Keulen, H., and Ewert, F. (2011). Effects of modelling detail on simulated potential crop yields under a wide range of climatic conditions. Ecol. Modell. 222, 131–143. doi: 10.1016/j.ecolmodel.2010.09.001
Alton, P. B., North, P. R., and Los, S. O. (2007). The impact of diffuse sunlight on canopy light-use efficiency, gross photosynthetic product and net ecosystem exchange in three forest biomes. Glob. Chang. Biol. 13, 776–787. doi: 10.1111/j.1365-2486.2007.01316.x
Archontoulis, S. V., Yin, X., Vos, J., Danalatos, N. G., and Struik, P. C. (2012). Leaf photosynthesis and respiration of three bioenergy crops in relation to temperature and leaf nitrogen: how conserved are biochemical model parameters among crop species? J. Exp. Bot. 63, 895–911. doi: 10.1093/jxb/err321
Baldocchi, D. (1997). Measuring and modelling carbon dioxide and water vapour exchange over a temperate broad-leaved forest during the 1995 summer drought. Plant Cell Environ. 20, 1108–1122. doi: 10.1046/j.1365-3040.1997.d01-147.x
Ball, J. T., Woodrow, I. E., and Berry, J. A. (1987). “A model predicting stomatal conductance and its contribution to the control of photosynthesis under different environmental conditions,” in Progress in Photosynthesis Research, ed J. Biggens (Dordrecht: Martinus-Nijhoff Publisher), 221–224.
Bernacchi, C. J., Portis, A. R., Nakano, H., von Caemmerer, S., and Long, S. P. (2002). Temperature response of mesophyll conductance. Implications for the determination of rubisco enzyme kinetics and for limitations to photosynthesis in vivo. Plant Physiol. 130, 1992–1998. doi: 10.1104/pp.008250
Bernacchi, C. J., Singsaas, E. L., Pimentel, C., Portis, A. R. Jr., and Long, S. P. (2001). Improved temperature response functions for models of Rubisco-limited photosynthesis. Plant Cell Environ. 24, 253–259. doi: 10.1111/j.1365-3040.2001.00668.x
Biehler, K., and Fock, H. (1996). Evidence for the contribution of the Mehler-peroxidase reaction in dissipating excess electrons in drought-stressed wheat. Plant Physiol. 112, 265–272. doi: 10.1104/pp.112.1.265
Braune, H., Muller, J., and Diepenbrock, W. (2009). Integrating effects of leaf nitrogen, age, rank, and growth temperature into the photosynthesis-stomatal conductance model LEAFC3-N parameterised for barley (Hordeum vulgare L.). Ecol. Modell. 220, 1599–1612. doi: 10.1016/j.ecolmodel.2009.03.027
Cai, T., Flanagan, L. B., Jassal, R. S., and Black, T. A. (2008). Modelling environmental controls on ecosystem photosynthesis and the carbon isotope composition of ecosystem-respired CO2 in a coastal Douglas-fir forest. Plant Cell Environ. 31, 435–453. doi: 10.1111/j.1365-3040.2008.01773.x
Challinor, A. J., Ewert, F., Arnold, S., Simelton, E., and Fraser, E. (2009). Crops and climate change: progress, trends, and challenges in simulating impacts and informing adaptation. J. Exp. Bot. 60, 2775–2789. doi: 10.1093/jxb/erp062
Cornic, G., and Briantais, J. M. (1991). Partitioning of photosynthetic electron flow between CO2 and O2 reduction in a C3 leaf (Phaseolus vulgaris L.) at different CO2 concentrations and during drought stress. Planta 183, 178–184. doi: 10.1007/BF00197786
Damour, G., Vandame, M., and Urban, L. (2008). Long-term drought modifies the fundamental relationships between light exposure, leaf nitrogen content and photosynthetic capacity in leaves of the lychee tree (Litchi chinensis). J. Plant Physiol. 165, 1370–1378. doi: 10.1016/j.jplph.2007.10.014
Damour, G., Vandame, M., and Urban, L. (2009). Long-term drought results in a reversible decline in photosynthetic capacity in mango leaves, not just a decrease in stomatal conductance. Tree Physiol. 29, 675–684. doi: 10.1093/treephys/tpp011
Díaz-Espejo, A., Walcroft, A. S., Fernández, J. E., Hafridi, B., Palomo, M. J., and Girón, I. F. (2006). Modeling photosynthesis in olive leaves under drought conditions. Tree Physiol. 26, 1445–1456. doi: 10.1093/treephys/26.11.1445
Dreyer, E., Le Roux, X., Montpied, P., Daudet, F. A., and Masson, F. (2001). Temperature response of leaf photosynthetic capacity in seedlings from seven temperate tree species. Tree Physiol. 21, 223–232. doi: 10.1093/treephys/21.4.223
Egea, G., Verhoef, A., and Vidale, P. L. (2011). Towards an improved and more flexible representation of water stress in coupled photosynthesis-stomatal conductance models. Agric. For. Meteorol. 151, 1370–1384. doi: 10.1016/j.agrformet.2011.05.019
Evans, J., and Terashima, I. (1987). Effects of nitrogen nutrition on electron transport components and photosynthesis in spinach. Aust. J. Plant Physiol. 14:59. doi: 10.1071/PP9870059
Evans, J., von Caemmerer, S., Setchell, B., and Hudson, G. (1994). Transfer conductance and leaf anatomy in transgenic tobacco with a reduced content of rubisco. Aust. J. Plant Physiol. 21, 475. doi: 10.1071/PP9940475
Farquhar, G. D., von Caemmerer, S., and Berry, J. A. (1980). A biochemical model of photosynthetic CO2 assimilation in leaves of C3 species. Planta 149, 78–90. doi: 10.1007/BF00386231
Flexas, J., Bota, J., Escalona, J. M., Sampol, B., and Medrano, H. (2002). Effects of drought on photosynthesis in grapevines under field conditions: an evaluation of stomatal and mesophyll limitations. Funct. Plant Biol. 29, 461. doi: 10.1071/PP01119
Flexas, J., Ribas-Carbó, M., Bota, J., Galmés, J., Henkle, M., Martínez-Cañellas, S., et al. (2006). Decreased Rubisco activity during water stress is not induced by decreased relative water content but related to conditions of low stomatal conductance and chloroplast CO2 concentration. New Phytol. 172, 73–82. doi: 10.1111/j.1469-8137.2006.01794.x
Flexas, J., Ribas-Carbó, M., Diaz-Espejo, A., Galmés, J., and Medrano, H. (2008). Mesophyll conductance to CO2: current knowledge and future prospects. Plant. Cell Environ. 31, 602–621. doi: 10.1111/j.1365-3040.2007.01757.x
Forseth, I. N., and Ehleringer, J. R. (1983). Ecophysiology of two solar tracking desert winter annuals. III. Gas exchange responses to light, CO2 and VPD in relation to long-term drought. Oecologia 57, 344–351. doi: 10.1007/BF00377179
Genty, B., Briantais, J. M., and Baker, N. R. (1989). The relationship between the quantum yield of photosynthetic electron transport and quenching of chlorophyll fluorescence. Biochim. Biophys. Acta Gen. Subj. 990, 87–92. doi: 10.1016/S0304-4165(89)80016-9
Genty, B., Briantais, J. M., and Da Silva, J. B. (1987). Effects of drought on primary photosynthetic processes of cotton leaves. Plant Physiol. 83, 360–364. doi: 10.1104/pp.83.2.360
González-Meler, M. A., Matamala, R., and Penuelas, J. (1997). Effects of prolonged drought stress and nitrogen deficiency on the respiratory O2 uptake of bean and pepper leaves. Photosynthetica 34, 505–512. doi: 10.1023/A:1006801210502
Grassi, G., Meir, P., Cromer, R., Tompkins, D., and Jarvis, P. G. (2002). Photosynthetic parameters in seedlings of Eucalyptus grandis as affected by rate of nitrogen supply. Plant Cell Environ. 25, 1677–1688. doi: 10.1046/j.1365-3040.2002.00946.x
Gu, J., Yin, X., Stomph, T. J., Wang, H., and Struik, P. C. (2012). Physiological basis of genetic variation in leaf photosynthesis methylation and chromatin patterning among rice (Oryza sativa L.) introgression lines under drought and well-watered conditions. J. Exp. Bot. 63, 5137–5153. doi: 10.1093/jxb/ers170
Harley, P. C., Thomas, R. B., Reynolds, J. F., and Strain, B. R. (1992). Modeling photosynthesis of cotton grown in elevated CO2. Plant Cell Environ. 15, 271–282. doi: 10.1111/j.1365-3040.1992.tb00974.x
Harper, J. (1984). “Uptake of nitrogen forms by roots and leaves,” in Nitrogen in crop production, ed R. Hauck (American Society of Agronomy), 165−170. Available online at: https://dl.sciencesocieties.org/publications/books/abstracts/acsesspublicati/nitrogenincropp/165
Héroult, A., Lin, Y. S., Bourne, A., Medlyn, B. E., and Ellsworth, D. S. (2013). Optimal stomatal conductance in relation to photosynthesis in climatically contrasting Eucalyptus species under drought. Plant Cell Environ. 36, 262–274. doi: 10.1111/j.1365-3040.2012.02570.x
Huang, B., and Fu, J. (2000). Photosynthesis, respiration, and carbon allocation of two cool-season perennial grasses in response to surface soil drying. Plant Soil 227, 17–26. doi: 10.1023/A:1026512212113
Jamieson, P. D., Porter, J. R., Goudriaan, J., Ritchie, J. T., Van Keulen, H., and Stol, W. (1998). A comparison of the models AFRCWHEAT2, CERES-Wheat, Sirius, SUCROS2 and SWHEAT with measurements from wheat grown under drought. F. Crop. Res. 55, 23–44. doi: 10.1016/S0378-4290(97)00060-9
Keenan, T., Sabate, S., and Gracia, C. (2010). Soil water stress and coupled photosynthesis-conductance models: bridging the gap between conflicting reports on the relative roles of stomatal, mesophyll conductance and biochemical limitations to photosynthesis. Agric. For. Meteorol. 150, 443–453. doi: 10.1016/j.agrformet.2010.01.008
Kohzuma, K., Cruz, J. A., Akashi, K., Hoshiyasu, S., Munekage, Y. N., Yokota, A., et al. (2009). The long-term responses of the photosynthetic proton circuit to drought. Plant Cell Environ. 32, 209–219. doi: 10.1111/j.1365-3040.2008.01912.x
Kosugi, Y., Shibata, S., and Kobashi, S. (2003). Parameterization of the CO2 and H2O gas exchange of several temperate deciduous broad-leaved trees at the leaf scale considering seasonal changes. Plant Cell Environ. 26, 285–301. doi: 10.1046/j.1365-3040.2003.00960.x
Leuning, R. (1995). A critical appraisal of a stomatal-photosynthesis model for C3 plants. Plant, Cell Environ. 18, 339–355. doi: 10.1111/j.1365-3040.1995.tb00370.x
Leuning, R. (1997). Scaling to a common temperature improves the correlation between the photosynthesis parameters J max and V cmax. J. Exp. Bot. 48, 345–347. doi: 10.1093/jxb/48.2.345
Li, G., Lin, L., Dong, Y., An, D., Li, Y., Luo, W., et al. (2012). Testing two models for the estimation of leaf stomatal conductance in four greenhouse crops cucumber, chrysanthemum, tulip and lilium. Agric. For. Meteorol. 165, 92–103. doi: 10.1016/j.agrformet.2012.06.004
Makino, A., Sakashita, H., Hidema, J., Mae, T., Ojima, K., and Osmond, B. (1992). Distinctive responses of ribulose-1,5-bisphosphate carboxylase and carbonic anhydrase in wheat leaves to nitrogen nutrition and their possible relationships to CO2-transfer resistance. Plant Physiol. 100, 1737–1743. doi: 10.1104/pp.100.4.1737
Maseyk, K. S., Lin, T., Rotenberg, E., Grünzweig, J. M., Schwartz, A., and Yakir, D. (2008). Physiology-phenology interactions in a productive semi-arid pine forest. New Phytol. 178, 603–616. doi: 10.1111/j.1469-8137.2008.02391.x
Medlyn, B. E., Dreyer, E., Ellsworth, D., Forstreuter, M., Harley, P. C., Kirschbaum, M. U. F., et al. (2002). Temperature response of parameters of a biochemically based model of photosynthesis. II. A review of experimental data. Plant Cell Environ. 25, 1167–1179. doi: 10.1046/j.1365-3040.2002.00891.x
Misson, L., Panek, J. A., and Goldstein, A. H. (2004). A comparison of three approaches to modeling leaf gas exchange in annually drought-stressed ponderosa pine forests. Tree Physiol. 24, 529–541. doi: 10.1093/treephys/24.5.529
Misson, L., Rasse, D. P., Vincke, C., Aubinet, M., and François, L. (2002). Predicting transpiration from forest stands in Belgium for the 21st century. Agric. For. Meteorol. 111, 265–282. doi: 10.1016/S0168-1923(02)00039-4
Monti, A. (2006). The effect of transient and continuous drought on yield, photosynthesis and carbon isotope discrimination in sugar beet (Beta vulgaris L.). J. Exp. Bot. 57, 1253–1262. doi: 10.1093/jxb/erj091
Müller, J., Eschenröder, A., and Christen, O. (2014). LEAFC3-N photosynthesis, stomatal conductance, transpiration and energy balance model: finite mesophyll conductance, drought stress, stomata ratio, optimized solution algorithms, and code. Ecol. Modell. 290, 134–145. doi: 10.1016/j.ecolmodel.2013.10.036
Müller, J., Wernecke, P., and Diepenbrock, W. (2005). LEAFC3-N: a nitrogen-sensitive extension of the CO2 and H2O gas exchange model LEAFC3 parameterised and tested for winter wheat (Triticum aestivum L.). Ecol. Modell. 183, 183–210. doi: 10.1016/j.ecolmodel.2004.07.025
Niinemets, Ü., Díaz-Espejo, A., Flexas, J., Galmés, J., and Warren, C. R. (2009). Importance of mesophyll diffusion conductance in estimation of plant photosynthesis in the field. J. Exp. Bot. 60, 2271–2282. doi: 10.1093/jxb/erp063
Ohsumi, A., Hamasaki, A., Nakagawa, H., Yoshida, H., Shiraiwa, T., and Horie, T. (2007). A model explaining genotypic and ontogenetic variation of leaf photosynthetic rate in rice (Oryza sativa) based on leaf nitrogen content and stomatal conductance. Ann. Bot. 99, 265–273. doi: 10.1093/aob/mcl253
Palosuo, T., Kersebaum, K. C., Angulo, C., Hlavinka, P., Moriondo, M., Olesen, J. E., et al. (2011). Simulation of winter wheat yield and its variability in different climates of Europe: a comparison of eight crop growth models. Eur. J. Agron. 35, 103–114. doi: 10.1016/j.eja.2011.05.001
Perez-Martin, A., Flexas, J., Ribas-Carbó, M., Bota, J., Tomás, M., Infante, J. M., et al. (2009). Interactive effects of soil water deficit and air vapour pressure deficit on mesophyll conductance to CO2 in Vitis vinifera and Olea europaea. J. Exp. Bot. 60, 2391–2405. doi: 10.1093/jxb/erp145
Poorter, H., Niinemets, U., Poorter, L., Wright, I. J., and Villar, R. (2009). Causes and consequences of variation in leaf mass per area (LMA): a meta-analysis. New Phytol. 182, 565–588. doi: 10.1111/j.1469-8137.2009.02830.x
Qian, T., Elings, A., Dieleman, J. A., Gort, G., and Marcelis, L. F. M. (2012). Estimation of photosynthesis parameters for a modified Farquhar-von Caemmerer-Berry model using simultaneous estimation method and nonlinear mixed effects model. Environ. Exp. Bot. 82, 66–73. doi: 10.1016/j.envexpbot.2012.03.014
Reich, P. B., Walters, M., Tjoelker, M., Vanderklein, D., and Buschena, C. (1998). Photosynthesis and respiration rates depend on leaf and root morphology and nitrogen concentration in nine boreal tree species differing in relative growth rate. Funct. Ecol. 12, 395–405. doi: 10.1046/j.1365-2435.1998.00209.x
Ryan, M. G. (1995). Foliar maintenance respiration of sub-alpine and boreal trees and shrubs in relation to nitrogen-content. Plant Cell Environ. 18, 765–772. doi: 10.1111/j.1365-3040.1995.tb00579.x
Sala, A., and Tenhunen, J. D. (1996). Simulations of canopy net photosynthesis and transpiration in Quercus ilex L. under the influence of seasonal drought. Agric. For. Meteorol. 78, 203–222. doi: 10.1016/0168-1923(95)02250-3
Sharp, R. E., Matthews, M. A., and Boyer, J. S. (1984). Kok effect and the quantum yield of photosynthesis : light partially inhibits dark respiration. Plant Physiol. 75, 95–101. doi: 10.1104/pp.75.1.95
Sun, Q. (2013). Quantifying the Effect of Nitrogen on External Quality of Cut Lily in Greenhouse. (in Chinese with English abstract). Available online at: http://cdmd.cnki.com.cn/Article/CDMD-10307-1014216371.htm
Tuzet, A., Perrier, A., and Leuning, R. (2003). A coupled model of stomatal conductance, photosynthesis. Plant Cell Environ. 26, 1097–1116. doi: 10.1046/j.1365-3040.2003.01035.x
von Caemmerer, S., and Evans, J. (1991). Determination of the average partial pressure of CO2 in chloroplasts from leaves of several C3 plants. Aust. J. Plant Physiol. 18, 287. doi: 10.1071/PP9910287
von Caemmerer, S., Farquhar, G., and Berry, J. (2009). “Biochemical model of C3 photosynthesis,” in Photosynthesis in Silico: Understanding Complexity from Molecules to Ecosystems, Vol. 29. Advances in Photosynthesis and Respiration, eds A. Laisk, L. Nedbal, and Govindjee (Springer Science + Business Media B.V. Netherlands), 209–230. doi: 10.1007/978-1-4020-9237-4_9
Walcroft, A., Whitehead, D., Silvester, W., and Kelliher, F. (1997). The response of photosynthetic model parameters to temperature and nitrogen concentration in Pinus radiate D. Don. Plant, Cell Environ. 20, 1338–1348. doi: 10.1046/j.1365-3040.1997.d01-31.x
Wang, Y. P., and Leuning, R. (1998). A two-leaf model for canopy conductance, photosynthesis and partitioning of available energy I: model description and comparison with a multi-layered model. Agric. For. Meteorol. 91, 89–111. doi: 10.1016/S0168-1923(98)00061-6
Warren, C. R. (2004). The photosynthetic limitation posed by internal conductance to CO2 movement is increased by nutrient supply. J. Exp. Bot. 55, 2313–2321. doi: 10.1093/jxb/erh239
Warren, C. R. (2008). Soil water deficits decrease the internal conductance to CO2 transfer but atmospheric water deficits do not. J. Exp. Bot. 59, 327–334. doi: 10.1093/jxb/erm314
Wilson, K. B., Baldocchi, D. D., and Hanson, P. J. (2000). Spatial and seasonal variability of photosynthetic parameters and their relationship to leaf nitrogen in a deciduous forest. Tree Physiol. 20, 565–578. doi: 10.1093/treephys/20.9.565
Wise, R. R., Olson, A. J., Schrader, S. M., and Sharkey, T. D. (2004). Electron transport is the functional limitation of photosynthesis in field-grown pima cotton plants at high temperature. Plant. Cell Environ. 27, 717–724. doi: 10.1111/j.1365-3040.2004.01171.x
Xu, L., and Baldocchi, D. D. (2003). Seasonal trends in photosynthetic parameters and stomatal conductance of blue oak (Quercus douglasii) under prolonged summer drought and high temperature. Tree Physiol. 23, 865–877. doi: 10.1093/treephys/23.13.865
Yin, X. (2013). Improving ecophysiological simulation models to predict the impact of elevated atmospheric CO2 concentration on crop productivity. Ann. Bot. 112, 465–475. doi: 10.1093/aob/mct016
Yin, X., and Struik, P. C. (2009b). C3 and C4 photosynthesis models: an overview from the perspective of crop modelling. NJAS Wageningen J. Life Sci. 57, 27–38. doi: 10.1016/j.njas.2009.07.001
Yin, X., and Struik, P. C. (2009a). Theoretical reconsiderations when estimating the mesophyll conductance to CO2 diffusion in leaves of C3 plants by analysis of combined gas exchange and chlorophyll fluorescence measurements. Plant. Cell Environ. 32, 1513–1524. doi: 10.1111/j.1365-3040.2009.02016.x
Yin, X., and Struik, P. C. (2015). Constraints to the potential efficiency of converting solar radiation into phytoenergy in annual crops: from leaf biochemistry to canopy physiology and crop ecology. J. Exp. Bot. 66, 6535–6549. doi: 10.1093/jxb/erv371
Yin, X., Struik, P. C., Romero, P., Harbinson, J., Evers, J. B., Van Der Putten, P. E. L., et al. (2009). Using combined measurements of gas exchange and chlorophyll fluorescence to estimate parameters of a biochemical C3 photosynthesis model: a critical appraisal and a new integrated approach applied to leaves in a wheat (Triticum aestivum) canopy. Plant Cell Environ. 32, 448–464. doi: 10.1111/j.1365-3040.2009.01934.x
Yin, X., Sun, Z., Struik, P. C., and Gu, J. (2011). Evaluating a new method to estimate the rate of leaf respiration in the light by analysis of combined gas exchange and chlorophyll fluorescence measurements. J. Exp. Bot. 62, 3489–3499. doi: 10.1093/jxb/err038
Yin, X., Van Oijen, M., and Schapendonk, A. H. C. M. (2004). Extension of a biochemical model for the generalized stoichiometry of electron transport limited C3 photosynthesis. Plant. Cell Environ. 27, 1211–1222. doi: 10.1111/j.1365-3040.2004.01224.x
Zhou, S., Duursma, R. A., Medlyn, B. E., Kelly, J. W. G., and Prentice, I. C. (2013). How should we model plant responses to drought? An analysis of stomatal and non-stomatal responses to water stress. Agric. For. Meteorol. 182–183, 204–214. doi: 10.1016/j.agrformet.2013.05.009
Keywords: mesophyll conductance, model, nitrogen, photosynthesis, stomatal conductance, water
Citation: Zhang N, Li G, Yu S, An D, Sun Q, Luo W and Yin X (2017) Can the Responses of Photosynthesis and Stomatal Conductance to Water and Nitrogen Stress Combinations Be Modeled Using a Single Set of Parameters? Front. Plant Sci. 8:328. doi: 10.3389/fpls.2017.00328
Received: 28 September 2016; Accepted: 24 February 2017;
Published: 28 March 2017.
Edited by:
Gernot Bodner, University of Natural Resources and Life Sciences, AustriaReviewed by:
Georgios Liakopoulos, Agricultural University of Athens, GreeceDaniel Tholen, University of Natural Resources and Life Sciences, Austria
Copyright © 2017 Zhang, Li, Yu, An, Sun, Luo and Yin. This is an open-access article distributed under the terms of the Creative Commons Attribution License (CC BY). The use, distribution or reproduction in other forums is permitted, provided the original author(s) or licensor are credited and that the original publication in this journal is cited, in accordance with accepted academic practice. No use, distribution or reproduction is permitted which does not comply with these terms.
*Correspondence: Weihong Luo, lwh@njau.edu.cn
Xinyou Yin, xinyou.yin@wur.nl
†These authors have contributed equally to this work.