


Folate is a B vitamin that is essential for many aspects of human health. Deficiency of this B vitamin can lead to megaloblastic anemiaReference Herbert1. A suboptimal folate status can increase the risk for women to have a child with a neural tube defect2. Furthermore, low folate status and subsequent elevated concentrations of plasma total homocysteine (tHcy) have been associated with neurocognitive dysfunctionReference Clarke, Smith, Jobst, Refsum, Sutton and Ueland3, colon cancerReference Choi and Mason4 and vascular diseases5. Folate is found in foods such as liver, vegetables, bread, potatoes, dairy products and fruitReference Konings, Roomans, Dorant, Goldbohm, Saris and van den Brandt6. In the Netherlands, the RDA of folate is 300 μg for adults7. However, many Dutch adults do not meet this recommendationReference Konings, Roomans, Dorant, Goldbohm, Saris and van den Brandt6.
There are different methods to assess habitual nutrient intake, but so far there is no gold standard. In large-scale epidemiological studies FFQ are preferred, because they are easy to administer and measure long-term intake. We developed a FFQ to assess folate intake over the past 3 months in Dutch elderly people. Here we describe the development of this questionnaire and subsequent comparison of the folate intake data with blood folate concentrations to assess the validity of the questionnaire. Furthermore long-term reproducibility was assessed.
Subjects
Baseline data of subjects from three different folate supplementation studies undertaken by our group in the past years were combined: (1) The FACIT-studyReference Durga, Bots, Schouten, Kok and Verhoef8, a double blind, randomised, placebo-controlled intervention study on the effect of 3 years supplementation with 0·8 mg folic acid/d on age-related diseases (carotid artery intima-media thickness, cognitive function and hearing); (2) the Dolfin-studyReference van Oort, Melse-Boonstra and Brouwer9, a dose-response trial with a randomised, double blind, parallel-group, placebo-controlled design aiming to find the lowest dose of folic acid that maximally lowers tHcy concentrations, and (3) the CHEF-studyReference Melse-Boonstra, West, Katan, Kok and Verhoef10, a placebo-controlled, randomised parallel trial to study relative bioavailability of polyglutamated folic acid v. monoglutamated folic acid. The study populations consisted of 819, 308 and 182 subjects, respectively. Twenty-three subjects participated in Dolfin as well as in CHEF. We decided to use their data from Dolfin, as in Dolfin MTHFR genotypes, which influence folate status, have also been determined. Five subjects were excluded from further analyses because of missing values on the FFQ. Altogether, complete data of 1281 subjects (861 men, 425 women) were available for analysis. Furthermore, the FFQ was administered for a second time after 3 years in 803 subjects in the FACIT-study, allowing us to study long-term reproducibility.
Subjects from all three studies were recruited from local blood banks and municipal registries in Wageningen and surroundings. Men and post-menopausal women aged 50–70 years (Dolfin < 76 years) were eligible for the studies. Inclusion criteria for all studies were: (1) women's last menstruation had to be longer than 2 years ago and if the uterus was removed they had to be older than 55 years; (2) no thyroid or renal disease; (3) no use of medication that affects folate metabolism and no use of supplements containing folic acid, vitamin B6 or vitamin B12; (4) tHcy levels had to be < 26 μmol/l. For the FACIT-study additional inclusion criteria were: no use of medication that might affect carotid artery intima-media thickness (e.g. lipid-lowering drugs or hormone replacement therapy), tHcy concentrations >13 μmol/l, serum vitamin B12 ≥ 200 pmol/l and compliance during a 6-week run-in period ≥ 80 %. Additional inclusion criteria for Dolfin and CHEF were: serum vitamin B12>160 pmol/l and serum creatinine concentrations < 125 μmol/l. The Medical Ethical Committee of Wageningen University approved all research protocols, and all subjects gave written informed consent.
Methods
Development of the FFQ on folate
The FFQ was developed in 2000 with goals to describe the habitual mean intake of folate at population level in the previous 3 months and to be able to classify individual subjects based on their habitual daily folate intake. Major dietary sources of folate intake in the elderly Dutch population were identified through an analysis of the second Dutch Food Consumption Survey (VCP2, 1992) for the sub-population of men and women aged 50–70 (n 1278)11. Folate calculations were made using the table of folate contents in food from 1995 compiled by Brants and HulshofReference Brants and Hulshof12. This folate table was mainly based on data originating from the British food composition tableReference Holland, Welch, Undin, Buss, Paul and Southgate13 and some other international food tables, for which analyses were mainly done by microbiological assay. Because new Dutch folate content data obtained with HPLC became available in 2001Reference Konings, Roomans, Dorant, Goldbohm, Saris and van den Brandt6, old and new data were compared to see if the selection of relevant food (group)s had to be changed. Based on these new folate content data, the average total folate intake was 27 % lower than the average folate intake based on the old folate content data of the table from 1995. This resulted mainly in a lower contribution of potatoes and milk to folate intake, whereas the contribution of meat and meat products was higher according to the new tableReference Brants14. The correlation between the folate contents of the two tables was 0·93.
Calculations were performed for food groups at three levels of detail (e.g. vegetables; raw vegetables; raw carrots). The following variables were calculated and used for assessment of the relevance of food groups to folate intake and the necessary details: % contribution to folate intake of food groups calculated for the total population including non-users; % users of food groups; % ‘product-folate-users’ i.e. % of the total population that consumes folate from the particular food group; % contribution to folate intake of food groups calculated for the product-folate-users only.
The first variable was used for the selection of the most important food groups that contribute to the folate intake at population level. The latter three variables were used for selection of food groups that are of minor importance on average level, but may contribute relevant amounts in the diet of some segments of the population. Within a food group we also considered the folate contents per 100-g product of the separate food products. When there was a large variation we made subgroups based on the content or picked out individual foods. The main food groups that contributed to the folate intake at population level were (in descending order): vegetables (24·6 %), bread (17·7 %), potatoes (12·8 %), milk and milk products (11·2 %), fruit (6·1 %), meat, meat products and poultry (5·2 %) and cheese (5·0 %). The complete list of selected foods, calculated over the total population, contributes to at least 80 % of the average folate intake. Based on the more recent Dutch folate data, the contribution is probably somewhat higher, because the selection is extended with products that have higher folate contents according to the new data.
Furthermore, the questionnaire was extended with some questions to estimate total meat and fish consumption per meal type, some food items that are known to affect tHcy in the blood (coffee, tea and alcoholic beverages), and some questions to determine the general meal pattern (dietary regimens, vegetarianism, number of persons at dinner, number of dinners per week).
FFQ
The FFQ assessed the habitual consumption of eighty-nine food items in the previous 3 months. Subjects indicated their average consumption frequency of each food item by checking 1 of 10 frequency categories ranging from ‘seldom or never’ to ‘7 days a week’. For several foods additional questions were asked about the specific types or brands consumed and preparation methods. Since many specific vegetables, fruits and alcoholic beverages were asked for, chances of getting an overestimation of these foods (and therefore also of folate intake) were high. Therefore, total vegetable, fruit and alcohol consumption were also asked for in order to provide the possibility to check for inconsistencies and if necessary to correct the reported frequencies in a data- cleaning step. In the FACIT-study, any inconsistency was first reviewed with the subject in order to correct it prior to data entry.
Portion sizes were asked for in natural units (e.g. number of apples, slices of bread), household units (glasses, spoons, etc.) or grams (e.g. grams of meat). Grams per natural or household unit were mainly derived from a commonly used Dutch databaseReference Hulshof, van der Heijden and Donders-Engelen15.
For the development of the questionnaires Vofrex was used, a software package used for the development of FFQReference Bouman, Van Erp-Baart, Brants and Bausch16, Reference Brants and Bouman17. With this program definitions of the questions were made that are required for data cleaning and calculation of folate intakes from the questionnaires in SAS Vovris, a software package for the processing of questionnairesReference Bouman, Brants and Kistemaker18. Calculations were made using the computerised Dutch Food Composition Table19.
Data were collected in 2000 and 2001. For the FACIT-study the FFQ was administered for a second time in 2003 and 2004, after a time interval of 3 years, when subjects had stopped taking the supplements. These data were used to evaluate the reproducibility of the questionnaire. At baseline as well as after 3 years subjects of the FACIT-study visited our research unit in two consecutive weeks; at their first appointment they received the FFQ and completed it at home; at their next appointment they handed it in and had it checked for completeness and consistency by a trained research assistant in a standardised way. Two independent dietitians performed double data entry. The questionnaires of the Dolfin- and the CHEF-study were not reviewed by a dietitian or research assistant and data were only entered once. For all questionnaires the data-cleaning procedure of Vovris was used. The data-cleaning procedure checked for missing values, inconsistencies, values below the minimum or above the maximum intake and unknown alternatives and was conducted before calculations were made. Erratic values were checked again, and if necessary, corrections were performed.
Other measurements
To assess the BMI weight was determined using an electronic weighing scale to the nearest 0·1 kg and height was measured to the nearest 0·1 cm. We took fasting venous blood samples at the start of the intervention period of each study.
Laboratory procedures
Blood samples for determination of tHcy and erythrocyte folate were drawn into EDTA-containing evacuated tubes. Samples were immediately placed on ice and the plasma was separated from blood cells within 30 min. Blood used for the determination of serum vitamin B12, serum creatinine and serum folate was collected in serum separator tubes, which were placed in the dark and stored at room temperature for at least 30 min before centrifugation at 4°C for 20 min at 2000 g (FACIT samples) and for 10 min at 2600 g for the other samples. All samples were stored at − 80°C. Concentrations of tHcy were measured by HPLC with fluorimetric detection at the Division of Human Nutrition, Wageningen University. Folate concentrations in serum and in erythrocytes as well as serum vitamin B12 concentrations were determined with a commercial chemiluminescent immunoassay analyzer (Immulite 2000, Diagnostic Products Company, Los Angeles, CA, USA) at the clinical laboratory of the University Medical Centre, Nijmegen. The samples for erythrocyte folate analysis were further diluted with a concentrated human protein-based matrix (Immulite 2000 diluent) before measurement. Creatinine concentrations were measured with a kit (DuPont Dimension, Boston, MA, USA; Dade BV, Leusden, The Netherlands) based on the kinetic Jaffé reaction. DNA was isolated from whole blood. The MTHFR 677C>T genotype was determined by PCR of genomic DNA and restriction enzyme digestion with HinFI at Wageningen University.
Statistical analysis
Differences between mean values of descriptive parameters in the three studies were tested using one-way ANOVA. As the distribution of the folate intake data was skewed Spearman correlation coefficients were calculated between dietary intakes assessed with the FFQ and blood concentrations of folate and tHcy. Folate intake was categorised in quartiles and we investigated whether mean folate concentrations across quartiles showed a linear trend. Linear regression analysis was used to determine the best predictors of folate concentration. Erythrocyte or serum folate status was the dependent variable and folate intake, age, sex, MTHFR genotype, vitamin B12, BMI, creatinine, alcohol intake and smoking were the independent variables. The choice for these confounders was based on previous literatureReference De Bree, Verschuren, Kromhout, Kluijtmans and Blom20, Reference Ueland, Refsum, Beresford and Vollset21. For subjects from the FACIT-study only (n 803) there was a second measurement of folate intake, which was divided into quartiles as well to check the ability of the questionnaire to classify subjects into the same quartile of folate intake after 3 years. For this, Wilcoxon signed ranks test was used. Reproducibility of the FFQ was also assessed by calculation of the Spearman correlation coefficient between the first and second FFQ. Analyses were performed using SPSS (version 11.0 for Windows; SPSS Inc., Chicago, IL, USA).
Results
The mean age of the participants was 60 (sd 6) years (Table 1). Mean blood values were: tHcy 12·6 (sd 3·1) μmol/l, serum folate 12·8 (sd 4·4) nmol/l and erythrocyte folate 661·3 (sd 263·9) nmol/l. Mean folate intake was 196 (sd 69) μg/d. Genotype frequencies of the MTHFR C677T polymorphism were in Hardy–Weinberg equilibrium; 15 % of the participants were homozygous (TT), 45 % were heterozygous (CT), 40 % were of the wild type (CC). The participants of the three studies were not different in age, BMI, serum vitamin B12, MTHFR genotype and smoking behaviour. In the FACIT-study more men participated. As a possible consequence of the homocysteine inclusion criteria of the FACIT-study (tHcy concentrations >13 μmol/l), tHcy and creatinine concentrations were higher and serum and erythrocyte folate concentrations were lower in this study than in the other two studies, even though folate intake was 10–16 % higher. Alcohol intake was significantly lower in the Dolfin study (P < 0·05).
Table 1 Characteristics of the study populations(Mean values and standard deviations)

M, male; F, female; THcy, total homocysteine.
Mean values were significantly different from the other studies: *P < 0·05 (ANOVA).
† n 1120.
Table 2 shows the correlations between folate intake and the blood concentrations of folate and tHcy, per study, for men and women separately, and per MTHFR C677T genotype. Correlations were generally weak. Correlations between folate intake and serum folate were higher than correlations between folate intake and erythrocyte folate concentrations. Correlations were similar when adjusted for confounders (unpublished results). As expected tHcy and serum folate (r − 0·37, P < 0·01) and tHcy and erythrocyte folate (r − 0·28, P < 0·01) were inversely related and serum and erythrocyte folate were strongly correlated (r 0·51, P < 0·01).
Table 2 Crude Spearman correlation coefficients between folate intake and serum and erythrocyte folate concentrations and total homocysteine (tHcy)
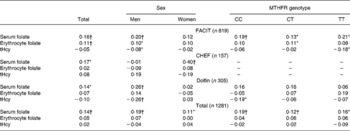
* Significantly different from 0, P < 0·05.
† Significantly different from 0, P < 0·01.
There was a significantly increased serum folate concentration with increasing intake of folate (P < 0·001). The increase in erythrocyte folate concentration over quartiles of folate intake did not reach significance (P = 0·30; Table 3).
Table 3 Estimated serum and erythrocyte folate concentrations by quartile of total folate intake

Table 4 shows that, in linear regression, folate intake, sex and MTHFR genotype were the strongest determinants of serum folate concentrations (standardised β: 0·15, 0·14 and − 0·13 respectively) and that alcohol intake was the strongest determinant of erythrocyte folate concentrations (standardised β: 0·15).
Table 4 Folate intake as a determinant of serum and erythrocyte folate concentrations by linear regression

* Variable classification used for smoking: Never smokers = 0, Current smokers = 1, Ex-smokers = 2.
† Variable classification used: MTHFR CC = 0, MTHFR CT = 1, MTHFR TT = 2.
a P < 0·001.
b P < 0·01
c P < 0·05
Reproducibility could only be assessed in the FACIT-study. The mean estimated folate intakes on the first occasion (206 (sd 76) μg/d) were significantly higher compared to estimated folate intakes after 3 years of intervention (191 (sd 62) μg/d), P < 0·0001. The Spearman correlation coefficient between the two folate intakes was 0·58 (P < 0·01). Of the participants 47 % were classified in the same quartile on both occasions, 31 % were classified in a lower quartile and 22 % in a higher quartile.
Discussion
We developed a FFQ to assess folate intake over the past 3 months in Dutch elderly people and compared the folate intake data with blood folate concentrations. We observed a weak positive correlation between folate intakes estimated with the FFQ and serum folate concentrations, but not erythrocyte folate. The FFQ classified 47 % of the participants in the same quartile of folate intake after 3 years.
We validated the FFQ against biochemical markers of food intake. An advantage of using biomarkers is that they provide an objective measure of nutrient intake whose measurement errors are essentially independent of the errors associated with dietary intake measures based on self-reportReference van't Veer, Kardinaal, Bausch-Goldbohm and Kok22. Biomarkers however are influenced by a number of physiologic, environmental, genetic and lifestyle factorsReference Hunter23, and that is one of the reasons why correlations between intake and biomarkers are usually modest. Blood folate levels may be influenced by the amounts of polyglutamyl and monoglutamyl folates in the foodsReference Melse-Boonstra, West, Katan, Kok and Verhoef10, smokingReference Senti and Pilch24, chronic alcohol consumptionReference Herbert, Picciano, Stokstad and Gregory25, MTHFR genotypeReference de Bree, Verschuren and Bjorke-Monsen26 and certain drugsReference Roe, Picciano, Stokstad and Gregory27. In our study it might be that the homogeneous population attenuated the correlations as well. Folate intake also has a large within-person variation. As biomarkers are not a measure of absolute intake one can only test whether a questionnaire is suitable for ranking persons according to their consumption. In our study folate intake did not correlate with erythrocyte folate but with serum folate, similar to previous studies. Previous studies that determined correlations between serum folate concentrations and folate intake estimated by a FFQ found correlation coefficients of 0·38Reference Green, Allen and O'Connor28, 0·34 (crude) and 0·61 (adjusted)Reference Jacques, Sulsky, Sadowski, Phillips, Rush and Willett29, 0·06Reference Drogan, Klipstein-Grobusch, Wans, Luley, Boeing and Dierkes30, 0·42Reference Pufulete, Emery, Nelson and Sanders31 and 0·13Reference Brevik, Vollset and Tell32. Previous studies that determined correlations between erythrocyte concentrations and folate intake found correlations coefficients of 0·25Reference Green, Allen and O'Connor28, 0·08Reference Drogan, Klipstein-Grobusch, Wans, Luley, Boeing and Dierkes30 and 0·20Reference Pufulete, Emery, Nelson and Sanders31. Thus compared to other studies our correlations were moderate/low, but still significantly positive for serum folate. This could be explained by the fact that serum folate reflects recent intake and erythrocyte folate reflects long-term intakeReference Crews, Alink and Andersen33 and with our FFQ food intake of the previous 3 months was assessed. Within-person variation of serum concentrations over time might also play a role; repeated blood measurements for all blood parameters would have been better to overcome this. In this study only blood parameters in the CHEF-study and erythrocyte folate in the FACIT-study were measured in duplicate, though this did not improve correlations. Although expected, MTHFR genotype did not modify the correlations between intake of folate and serum or erythrocyte folate.
In the linear regression model the main prognostic factors (folate intake, creatinine, vitamin B12, alcohol and MTHFR) were as expected; however, the determinants which best predicted folate concentrations in the blood were different for serum folate and erythrocyte folate. This may be explained by the fact that in the erythrocyte model most of the prognostic variables were not statistically significant, probably because the variation in the distribution was greater. For MTHFR an explanation might also be that in subjects with the TT genotype the association of dietary folate with erythrocyte folate is found to be stronger, compared to subjects with the CC or CT genotypes. In contrast, this is not the case for serum folate. The higher levels of erythrocyte folate in subjects with the TT genotype could be due to the difference in folate derivative composition between the genotypes and the different sensitivities of their chemical detectionReference Ozturk, Durga, van de Rest and Verhoef34. Furthermore, the fact that the models did not predict as well as in other populations is likely a consequence of the populations under study. We had strict screening criteria for age and for tHcy levels. The tHcy screening most likely indirectly excluded individuals with higher folate status which may have weakened the prognostic variables.
There are different methods to assess habitual food intake and the advantages and disadvantages associated with each method are well documentedReference Bingham, Gill and Welch35–Reference Thompson and Byers38. In studies like ours FFQ are the preferred method of dietary assessment as they are easy to administer and inexpensive to process. A general disadvantage of the FFQ is that the validity is highly dependent on the correct selection of the foods on the listReference Bingham, Nelson, Paul, Haralsdottir, Loken, van Staveren, Cameron and van Staveren36. Compared to other lists that often include twice as many food items our eighty-nine-item list was relatively short. However, it still covered at least 80 % of the average folate intake. It has been shown that estimates of fruit and vegetable intake are related to the number of questions asked; the more questions asked, the more intake is over reportedReference Krebs-Smith, Heimendinger, Subar, Patterson and Pivonka39. In studies like ours, where the intake of specific items or nutrients is of interest, a common practice to correct for this over-reporting is to include a summary question (how often do you eat … (a food category)?) preceding or following questions on intake of specific items within a food categoryReference Haraldsdottir40. We also included a summary question for vegetables, fruits and alcohol intake, to reduce chances of over-reporting. In a study of Bogers et al. the summary question estimated vegetable intake better than the sum of the specific questionsReference Bogers, Dagnelie and Westerterp41. A kind of bias with one correction factor could be that all kinds of vegetables are similarly corrected, whereas possibly respondents could estimate some kinds of vegetables better than others. Furthermore, in FFQ inaccuracies in the estimation of portion sizes and the frequency of food consumption are often foundReference Bingham, Gill and Welch35, Reference Pufulete, Emery, Nelson and Sanders31. This could also be a limitation of our study and could be overcome by administering the FFQ in conjunction with colour photographs of food portion sizes such as A Photographic Atlas of Food Portion Sizes Reference Nelson, Atkinson and Meyer42. Furthermore, FFQ rely on the respondent's self-description of his diet and it is also limited in its ability to assess accurately the nutrient intake of individuals or groups with dietary patterns markedly different from the food listReference Block37. It is difficult to overcome these problems when addressing the general population. Besides the quality of measurement of food intake the quality of food composition analysis is also important. There is a considerable, yet unidentified, difference between estimates of folate in foods analysed with HPLC methods which are 20–40 % lower compared with microbiological methodsReference Konings, Roomans, Dorant, Goldbohm, Saris and van den Brandt6.
Supplement users were excluded from our study and folic acid fortification is not allowed in the Netherlands; consequently most of the folate intake is probably derived from natural food products, so this could not affect the use of folate as a biomarker for folate intake of foods.
Reproducibility is generally determined by properties of the FFQ itself, respondent's memory and actual changes in food intake. Although reproducibility was still adequate for folate, 3 years is a long time interval to measure reproducibility. The respondent's memory will be of minor influence then and actual changes in diet are likely and cannot be separated from errors in measurement.
In conclusion, serum and not erythrocyte folate concentrations correlated positively with folate intake and the correlations were weaker than in other studies. Half the participants were classified into the same quartile and estimated folate intakes were comparable with other studies. This FFQ could provide a satisfying ranking according to folate intake of a Dutch elderly population.
Acknowledgements
We gratefully thank all study participants for their time and motivation. We thank the research teams for their dedication and enthusiasm. The research was supported by the Netherlands Organisation for Health Research and Development, Wageningen University and the Wageningen Centre for Food Sciences. Wageningen Centre for Food Sciences is an alliance of major Dutch food industries and knowledge institutes.


