1. Introduction
Since African agriculture is predominantly rain fed, and many regions are affected by high rainfall variability in both space and time, there is a pressing need for accurate gridded rainfall products for different applications, such as agricultural monitoring and yield prediction in remote areas. Rain gauges have been the main source of rainfall data, but in many countries the rain gauge network is inadequate to produce reliable distributed rainfall maps. Although there are important limitations of the use of satellite imagery for rainfall estimation—none of the satellite sensors detect rainfall as such and the relationship between observations and precipitation is indirect—satellite derived rainfall estimates overcome the need for near real-time rain gauge observations, which are typically sparse, poorly spatially distributed, and reported sporadically, especially in Africa [
1,
2,
3]. In recent decades, these full spatial coverage products have been crucial, particularly in drought, flood and famine early warning [
3].
Algorithms to derive rainfall from satellite observations are either based on thermal infrared (TIR) bands, which measure cloud top temperature that can be used to identify convective rainfall in the Inter-Tropical Convergence Zone (ITCZ), or on passive microwave (PM) sensors. In the first case, cold cloud duration (CCD), or the length of time that a pixel temperature is below a certain threshold, is assumed to be linearly related with rainfall. Misidentification can occur because some cold clouds, such as cirrus, may not be associated with any rainfall, while warm cloud such as stratiform clouds can produce substantial amounts of rain [
4]. This method is therefore less reliable in coastal monsoon areas, regions where mid-latitude weather systems dominate, or areas with high topography [
5,
6]. On the other hand, PM imagery can be used to assess atmospheric liquid water content and rainfall intensity as microwaves penetrate clouds and precipitation sized particles are the major source of attenuation at PM frequencies [
4]. For PM algorithms, the two main challenges are warm orographic rains and very cold surfaces and ice over mountain-tops, which can be confused with precipitation. Additional drawbacks include the poorer spatial resolution and, more importantly, the poor temporal sampling of the PM sensors compared to TIR imagery, since PM sensors are carried on polar orbiting satellites. Although PM techniques generally seem to outperform TIR techniques for instantaneous rain areas and rates, for estimates over longer periods (e.g., monthly estimates) the TIR outperform PM algorithms [
4].
In the last decades, many satellite based rainfall estimate products have been developed. Empirical algorithms, calibrated using rain gauge data, are used to derive rainfall rates from observed signals, but parameters can vary in space and time. Some of the algorithms are exclusively based on TIR data (e.g., [
7]) from geostationary satellites such as Meteosat-8 and Geostationary Operational Environmental Satellite (GOES), while others are based only on microwave data (e.g., [
8]) from the Special Sensor Microwave Imager (SSM/I), Tropical Rainfall Measuring Mission (TRMM), or the Advanced Microwave Sounding Unit (AMSU). Some products combine both TIR and PM imagery (e.g., [
9]) and/or include ground-based rainfall observations (e.g., [
10]) or numerical weather prediction (NWP) model information (e.g., [
11]). Multi-sensor algorithms have been reported to reduce the inherent sampling errors of satellite estimates [
12].
The adjustment of satellite estimates against gauge data allows reduction of the bias in the satellite precipitation estimates and yields higher accuracies [
13], although this may not provide a complete solution because of the low availability of ground-based data for calibration and validation in Africa [
1]. Most recent methods (e.g., [
14]) perform calibration using real-time rain gauge data. These are made available through the Global Precipitation Climatology Project (GPCC) and are distributed through the Global Telecommunications System (GTS).
Users of satellite derived rainfall data need to evaluate how reliable the products are, in order to choose the most suitable product for their application. Although validation is necessary to have some level of confidence, with the exception of TAMSAT’s routine validation [
3], few studies validate rainfall over the African continent due to the lack of appropriate dense rain gauge networks. Most evaluation studies cover the west African Sahel [
10,
13,
15,
16,
17,
18], some cover southern Africa [
5,
6] or East Africa [
19,
20]. Results from such studies show large differences in algorithm performance depending on location, topography, local climate and season [
20], but algorithms that rely on local calibration usually show better performance (e.g., [
13]), and satellite estimates give a more accurate representation of the rainfall compared to modeled products. In addition, the “best” product depends on the specific application: for operational agricultural monitoring focusing on drought impacts, the accuracy of low rainfall is essential; for hydrological purposes and flood forecasting it is key to accurately estimate high rainfalls.
The aim of this paper is to evaluate satellite derived rainfall products for the monitoring of both dry spells and high rainfall events in Mozambique, by comparing satellite products against rain gauge observations provided by the Mozambican meteorological institute. The study focuses on satellite derived rainfall data with a relatively high spatial and temporal resolution. Specific questions to be addressed are how the satellite data compare with the gauge data for different rainfall categories, over the seasonal cycle and over three distinct regions dominated by different weather systems.
2. Study Area
Mozambique is one of the poorest countries in the world, and development has been compromised in recent years by civil war and extreme climate events such as major droughts and floods [
21]. The high incidence of flooding is firstly explained by the tropical cyclones that form in the Mozambique Channel: while relatively few of these actually make landfall [
22], some get close enough to cause high winds and heavy rain. Secondly, nine major river systems that drain vast areas of southeastern Africa find their way to the ocean by crossing Mozambique [
21]. The Mozambican economy is driven by the agricultural sector. Around 80 percent of Mozambique’s population works in agriculture and fisheries [
23] and are therefore highly vulnerable to climate variability and extreme weather events. Accurate measurement of rainfall is therefore a high priority.
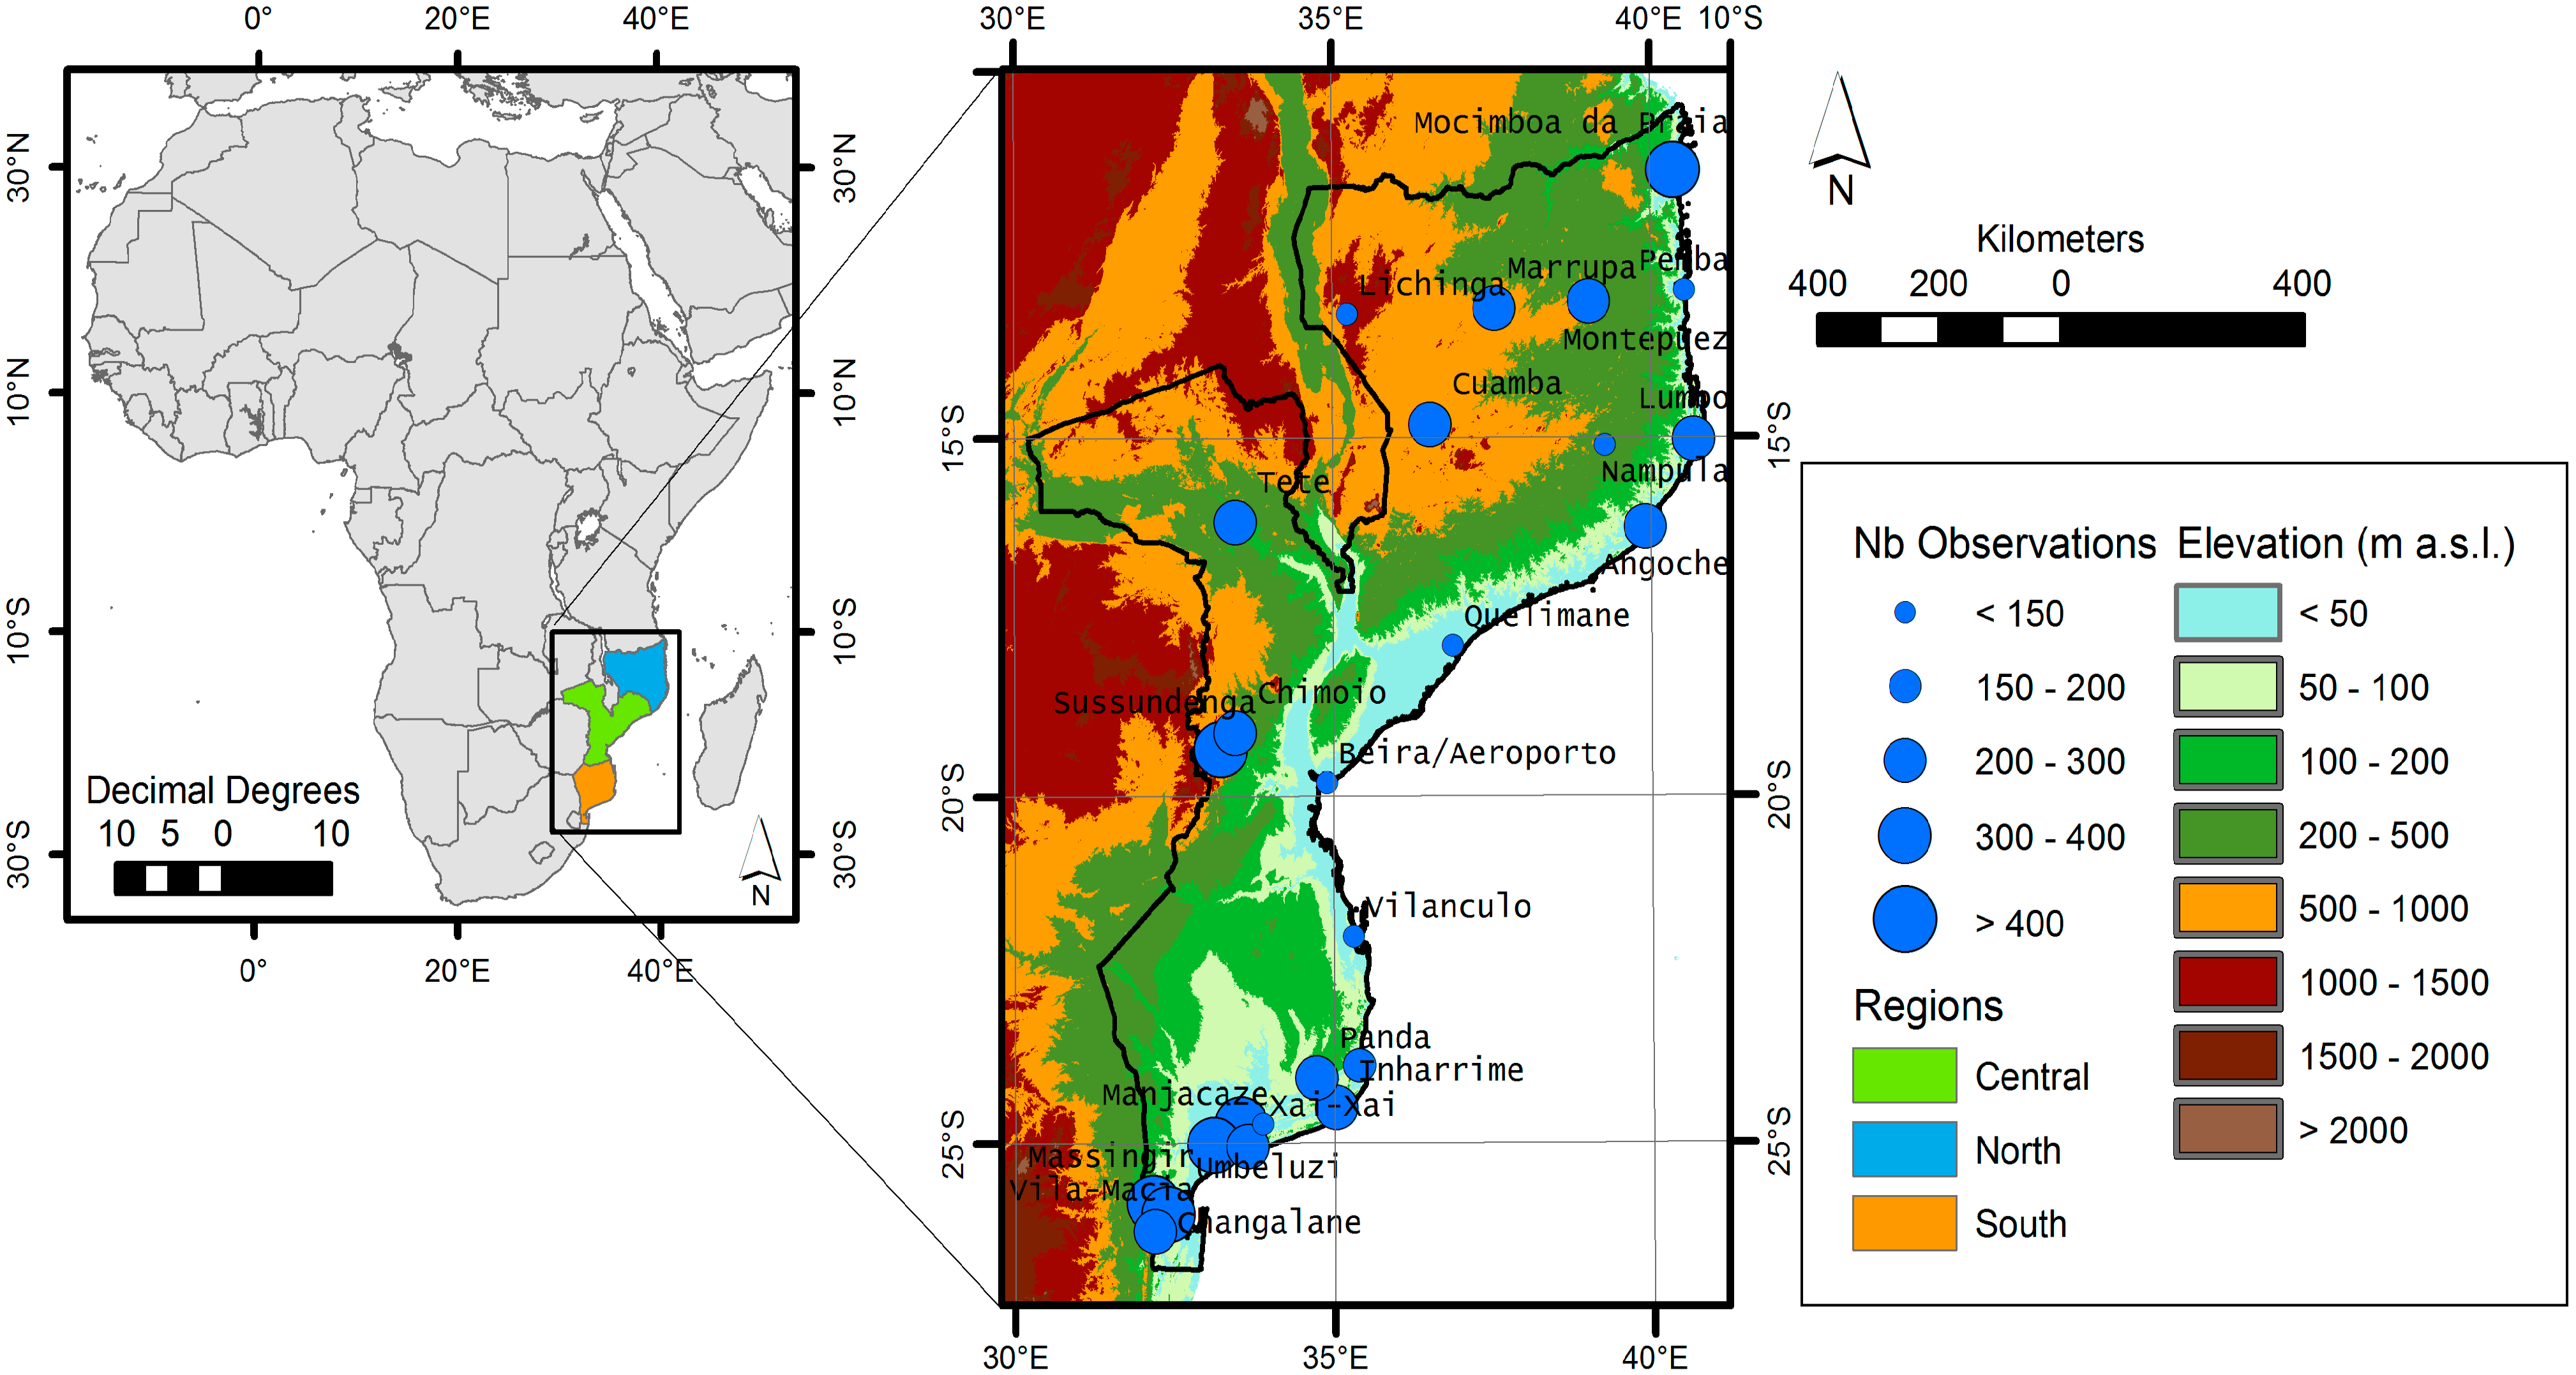
Mozambique is located on the southeast coast of the African continent and has a tropical climate characterized by a cool and dry winter season from April to September and a warm and rainy summer season from October to March [
24]. Annual mean temperature and rainfall vary from north to south and from the coast to the highlands in the interior of the country. The weather system is dominated in the north by the ITCZ, and in the south by Antarctic Polar Fronts (APF) and Tropical Temperate Troughs (TTTs). The central region receives influences from both systems. TTT occurrence is positively related to La Niña and Southern Hemisphere planetary waves, while El Niño-Southern Oscillation (ENSO) appears to play a significant role in causing dry conditions over Mozambique [
25]. The most significant natural hazards are severe droughts, such as those of 2002/3, 2003/4 and 2009/10, and devastating cyclones and floods, as in 2000 and 2001, in the central and southern provinces [
21,
26].
6. Conclusions
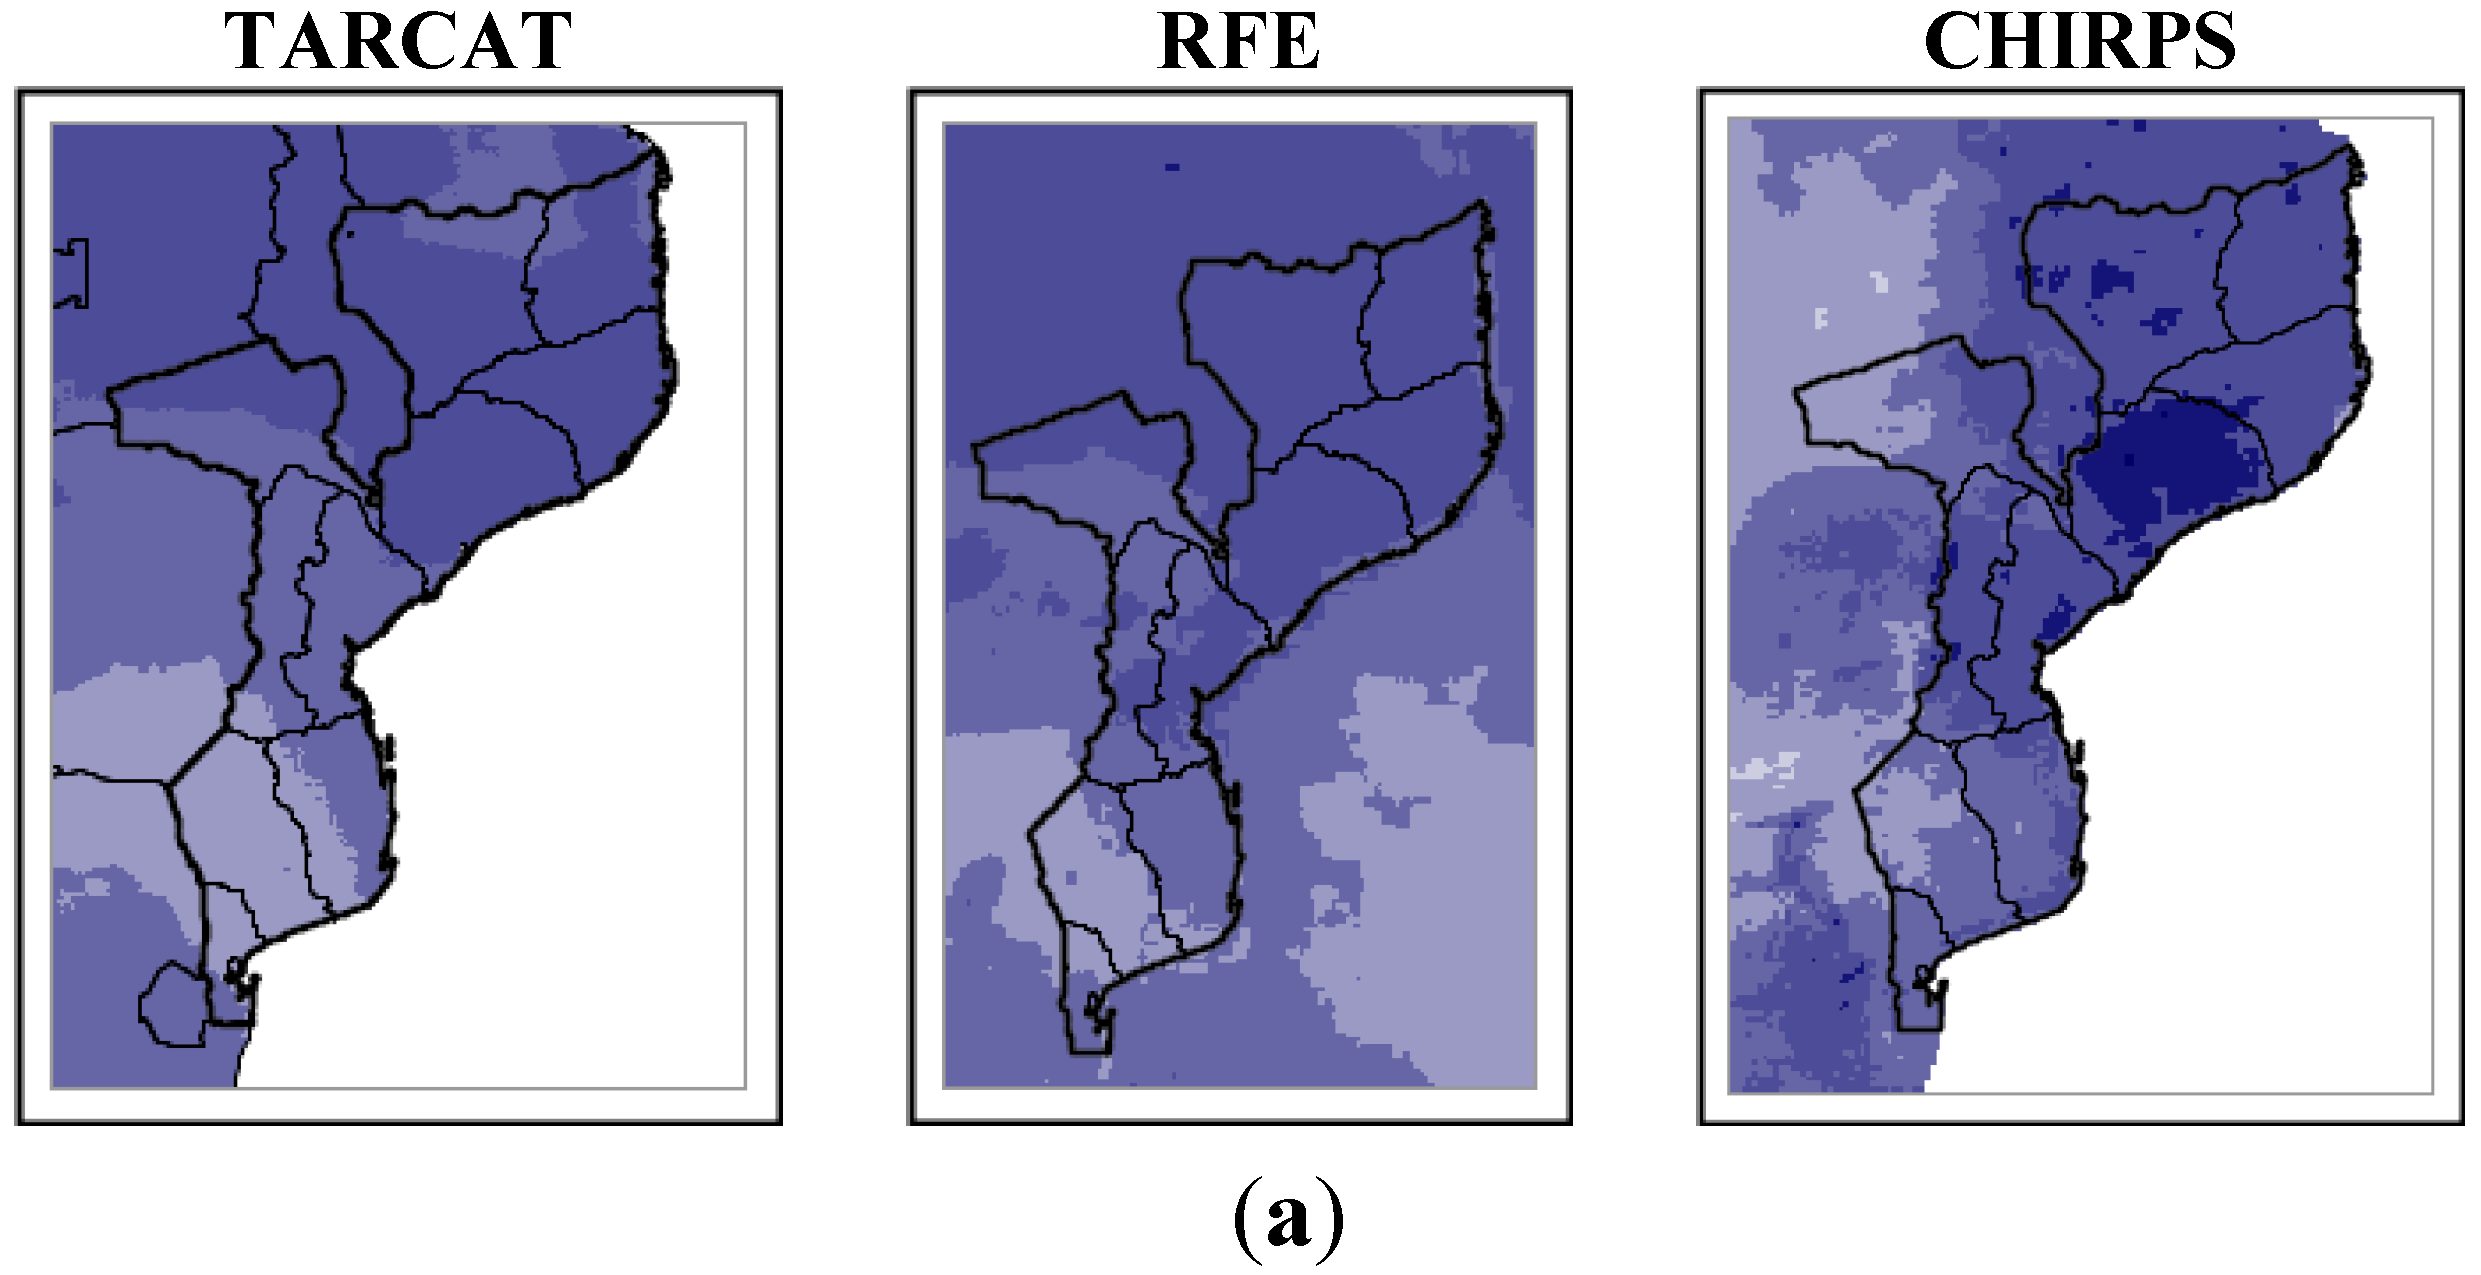
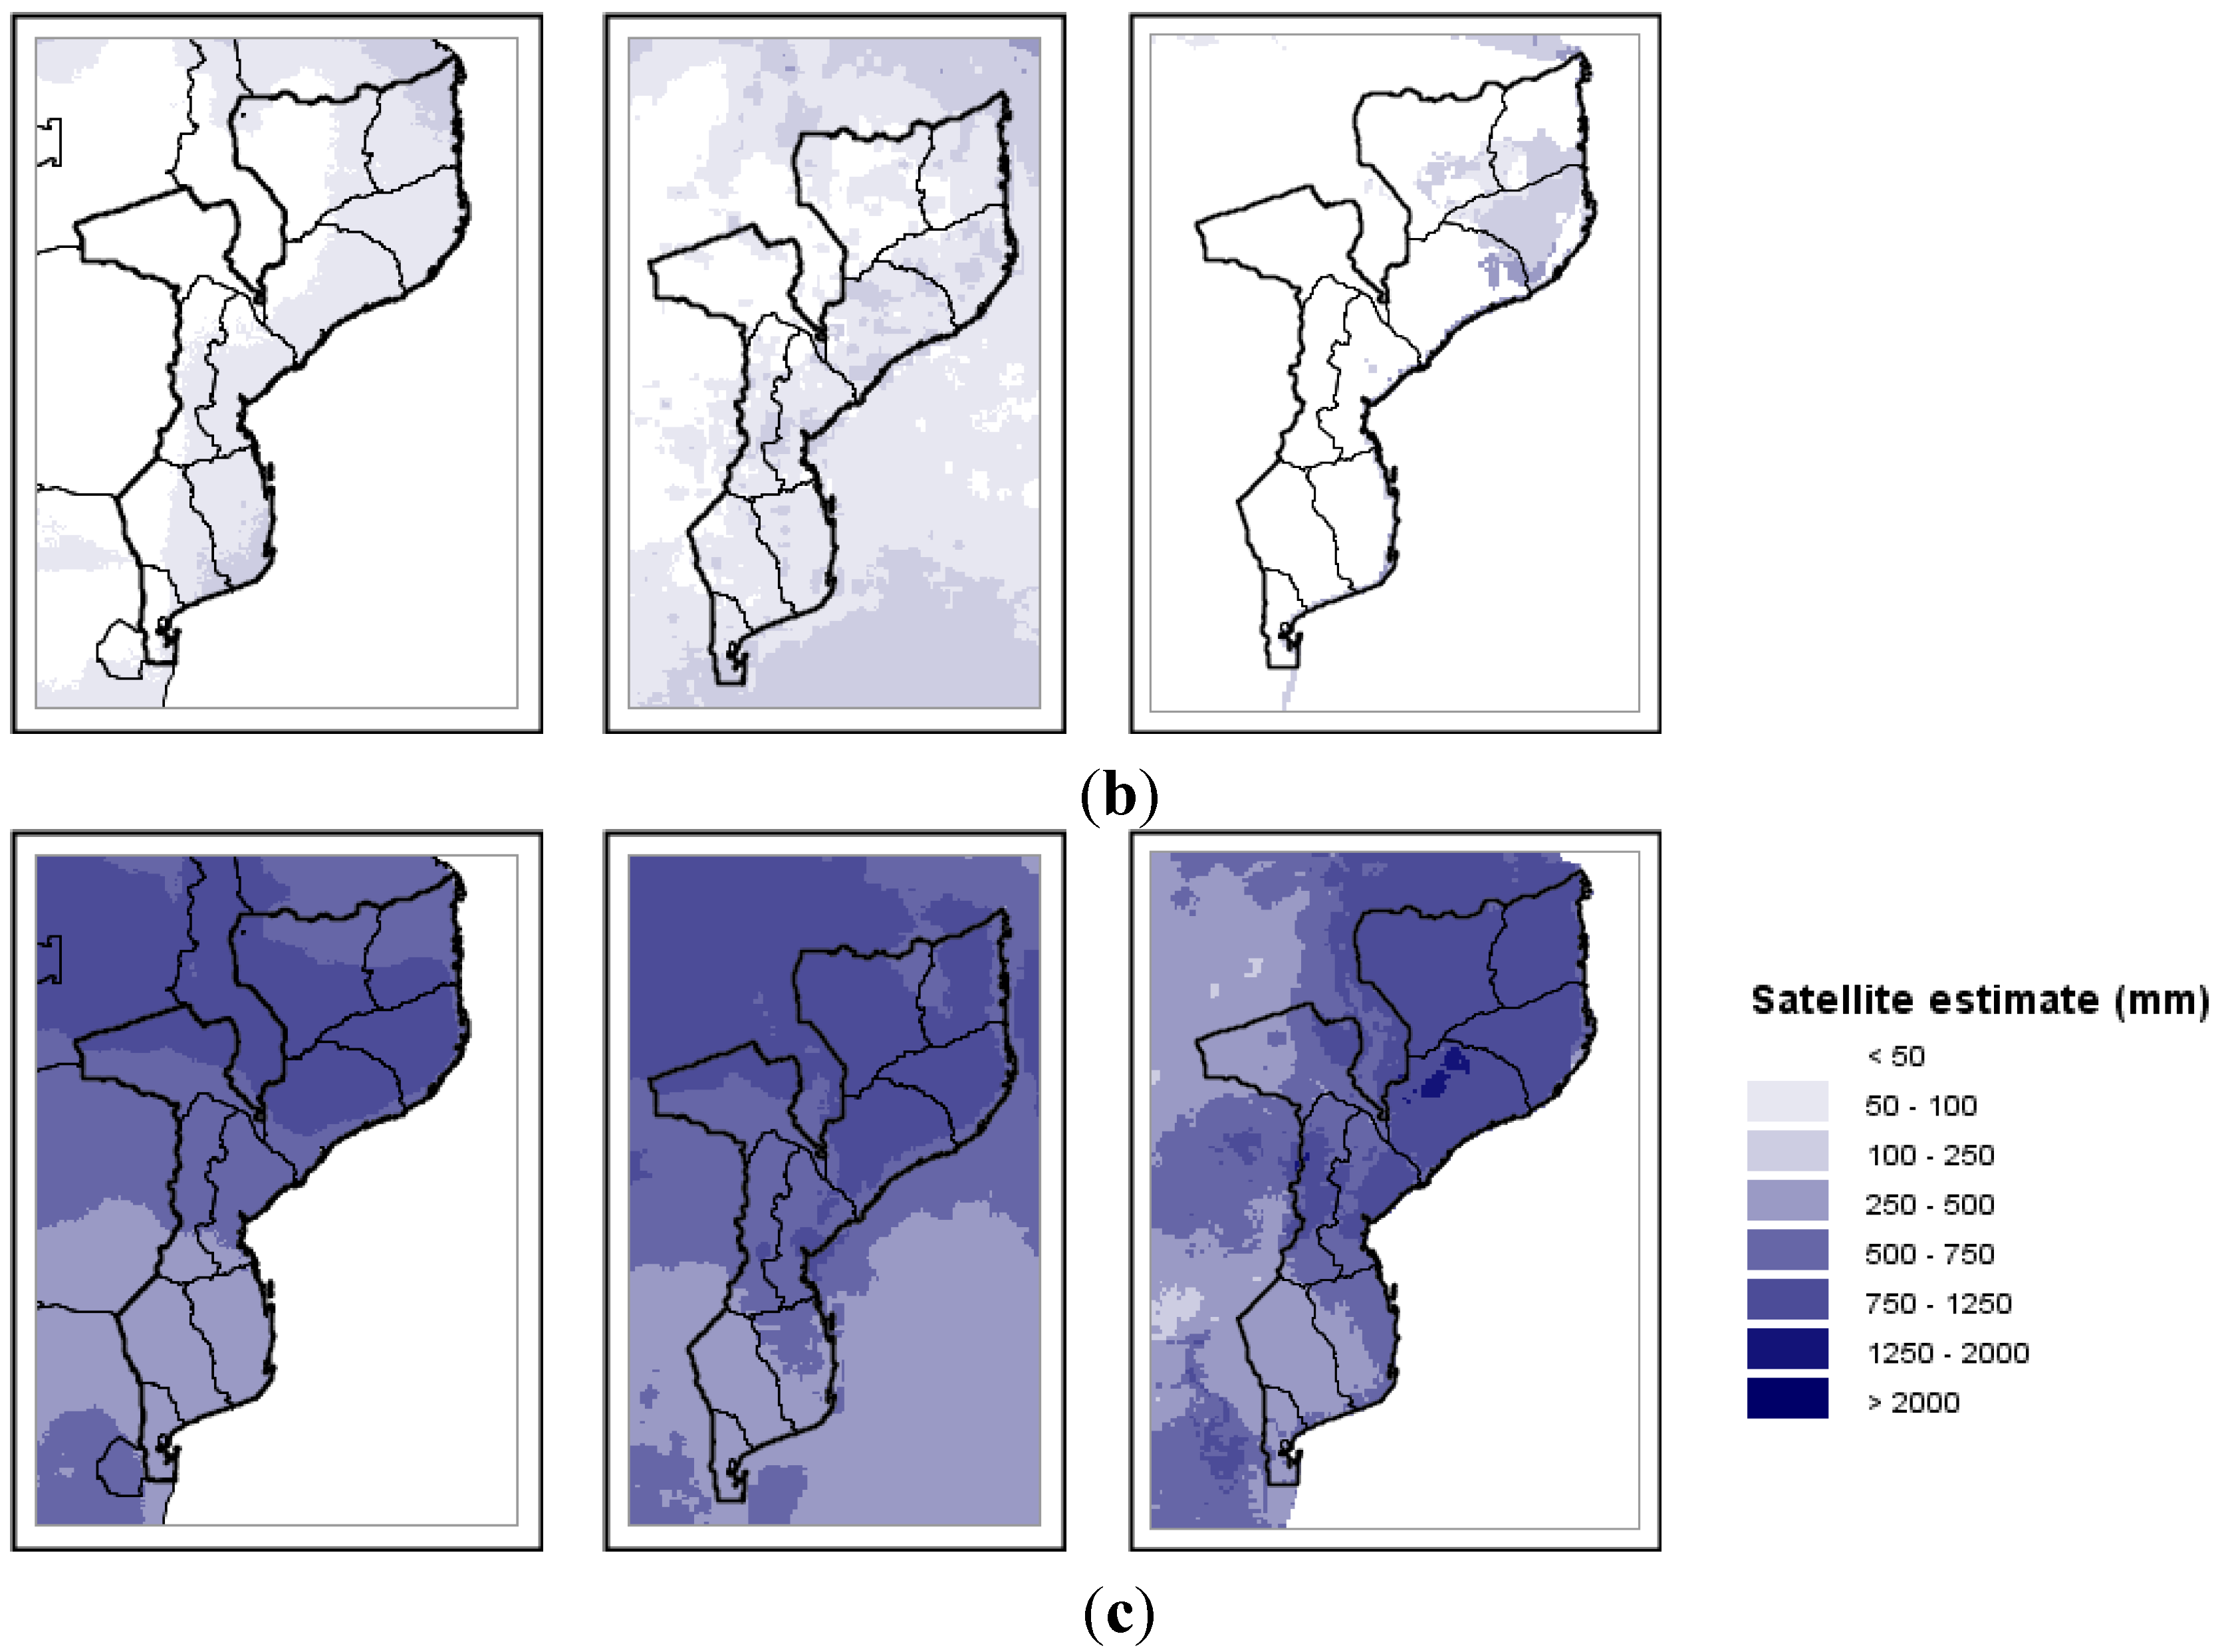
Three satellite-based rainfall datasets were evaluated against an independent rain gauge dataset provided by the Mozambican meteorological institute. The TARCAT, RFE, and CHIRPS products have a relatively high spatial and temporal resolution and these gridded rainfall products could be very beneficial for accurate drought and flood monitoring for agricultural applications and early warning of food insecurity, provided their accuracies, strengths and weaknesses are well understood. Rain gauges in Mozambique are sparse, poorly distributed, and often show gaps in the temporal record of observations. Satellite rainfall estimates, on the other hand, contain random errors and bias because of the indirect relation between observations and precipitation, inadequate sampling and algorithm imperfections [
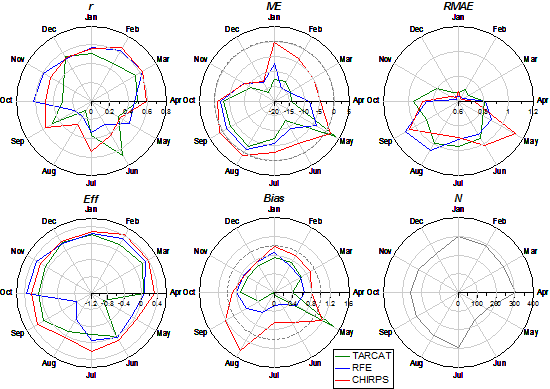
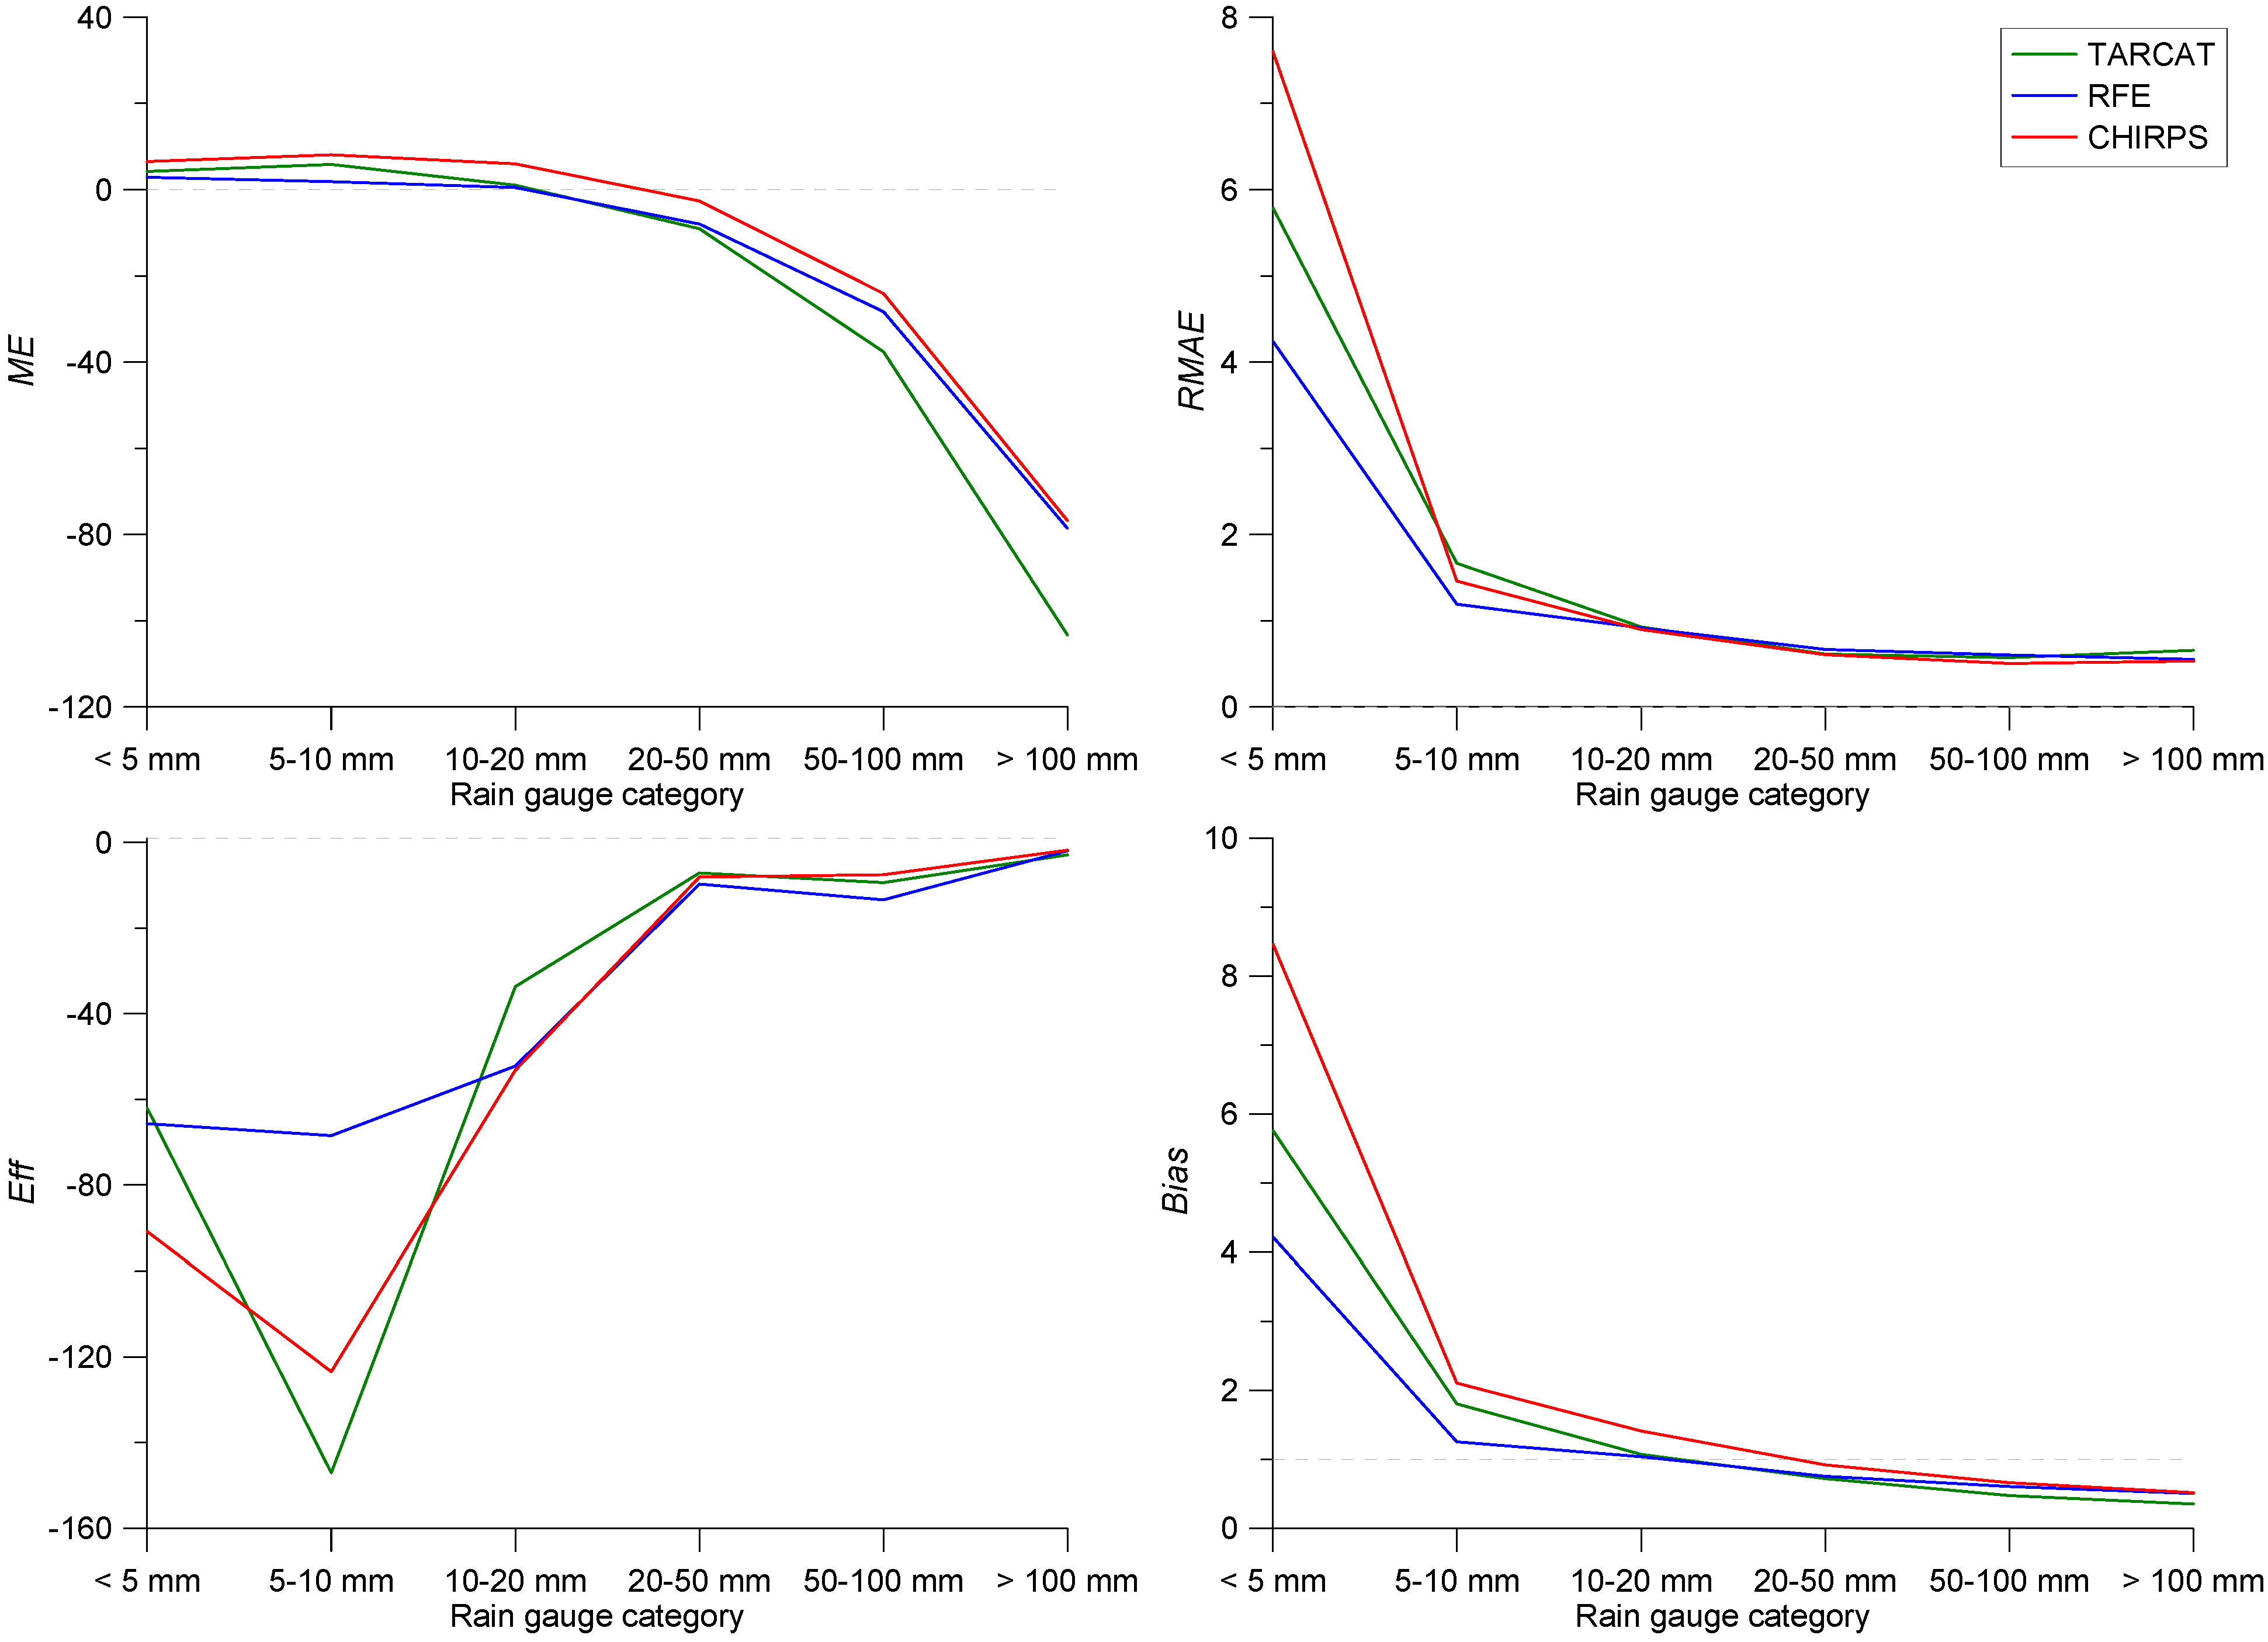
17]. The analysis focused on both pairwise comparison statistics that evaluate the performance of the satellite products in estimating the amount of rainfall, and categorical validation statistics that assess rain-detection capabilities.
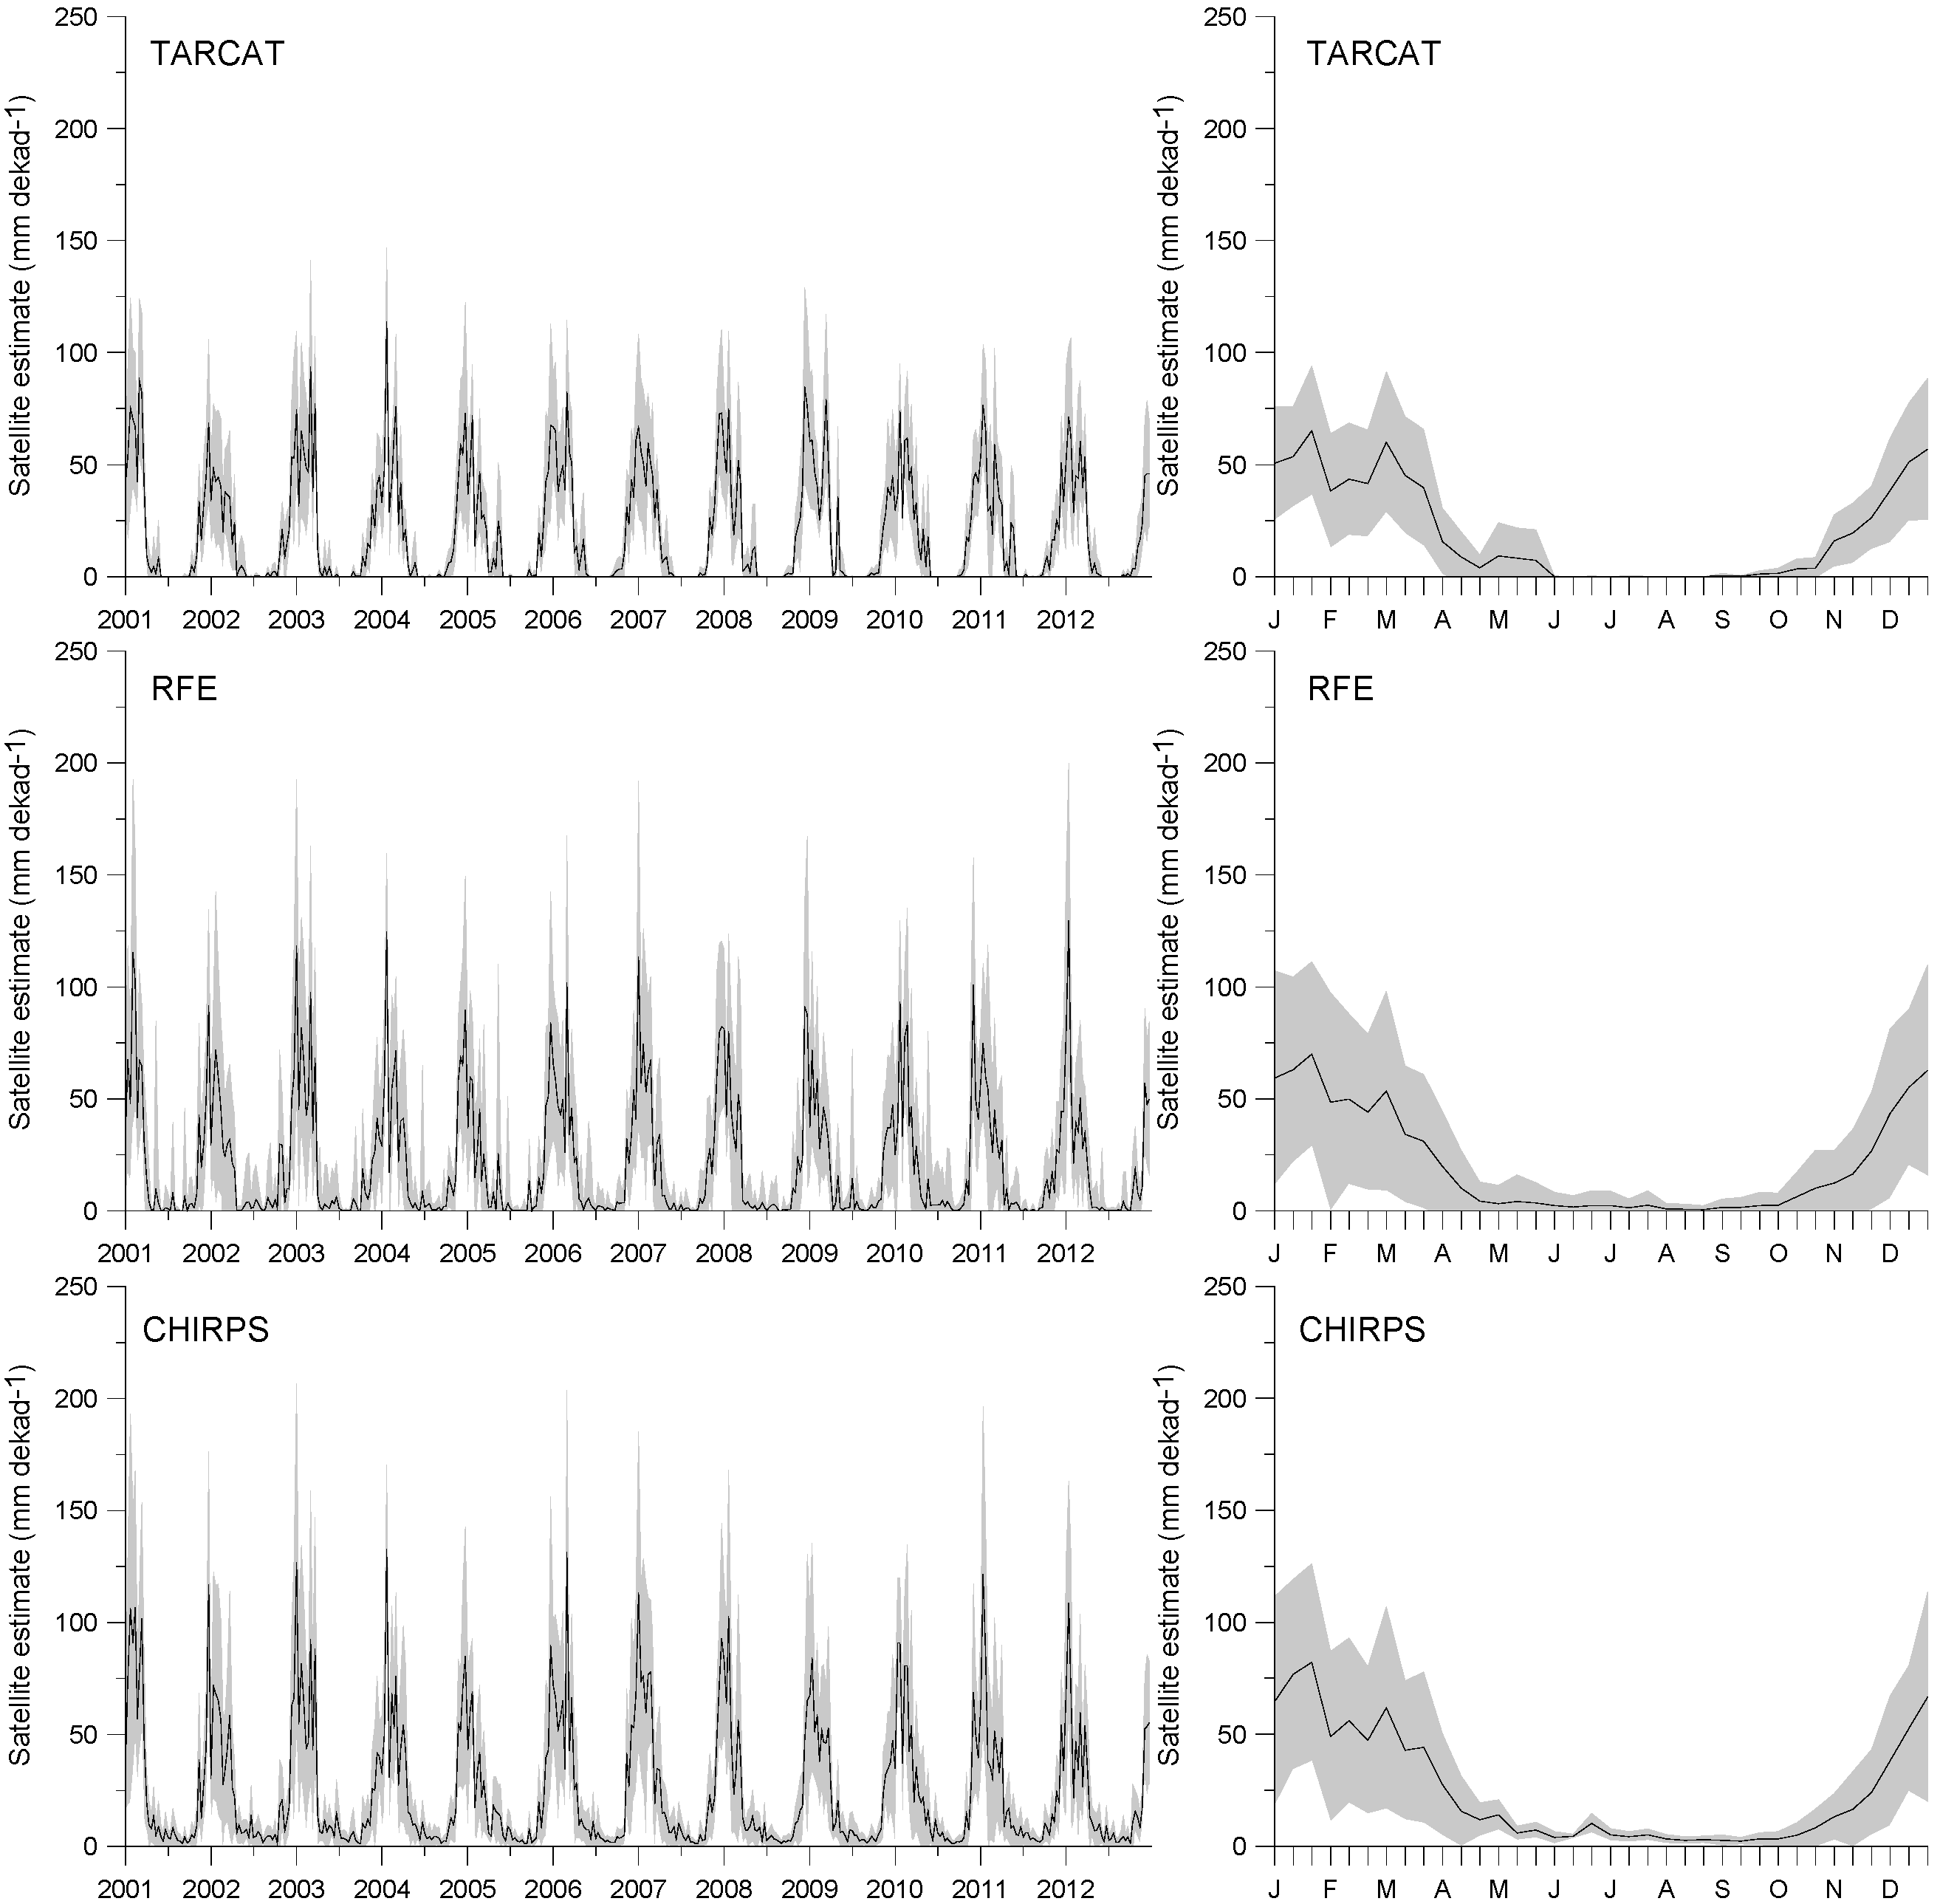
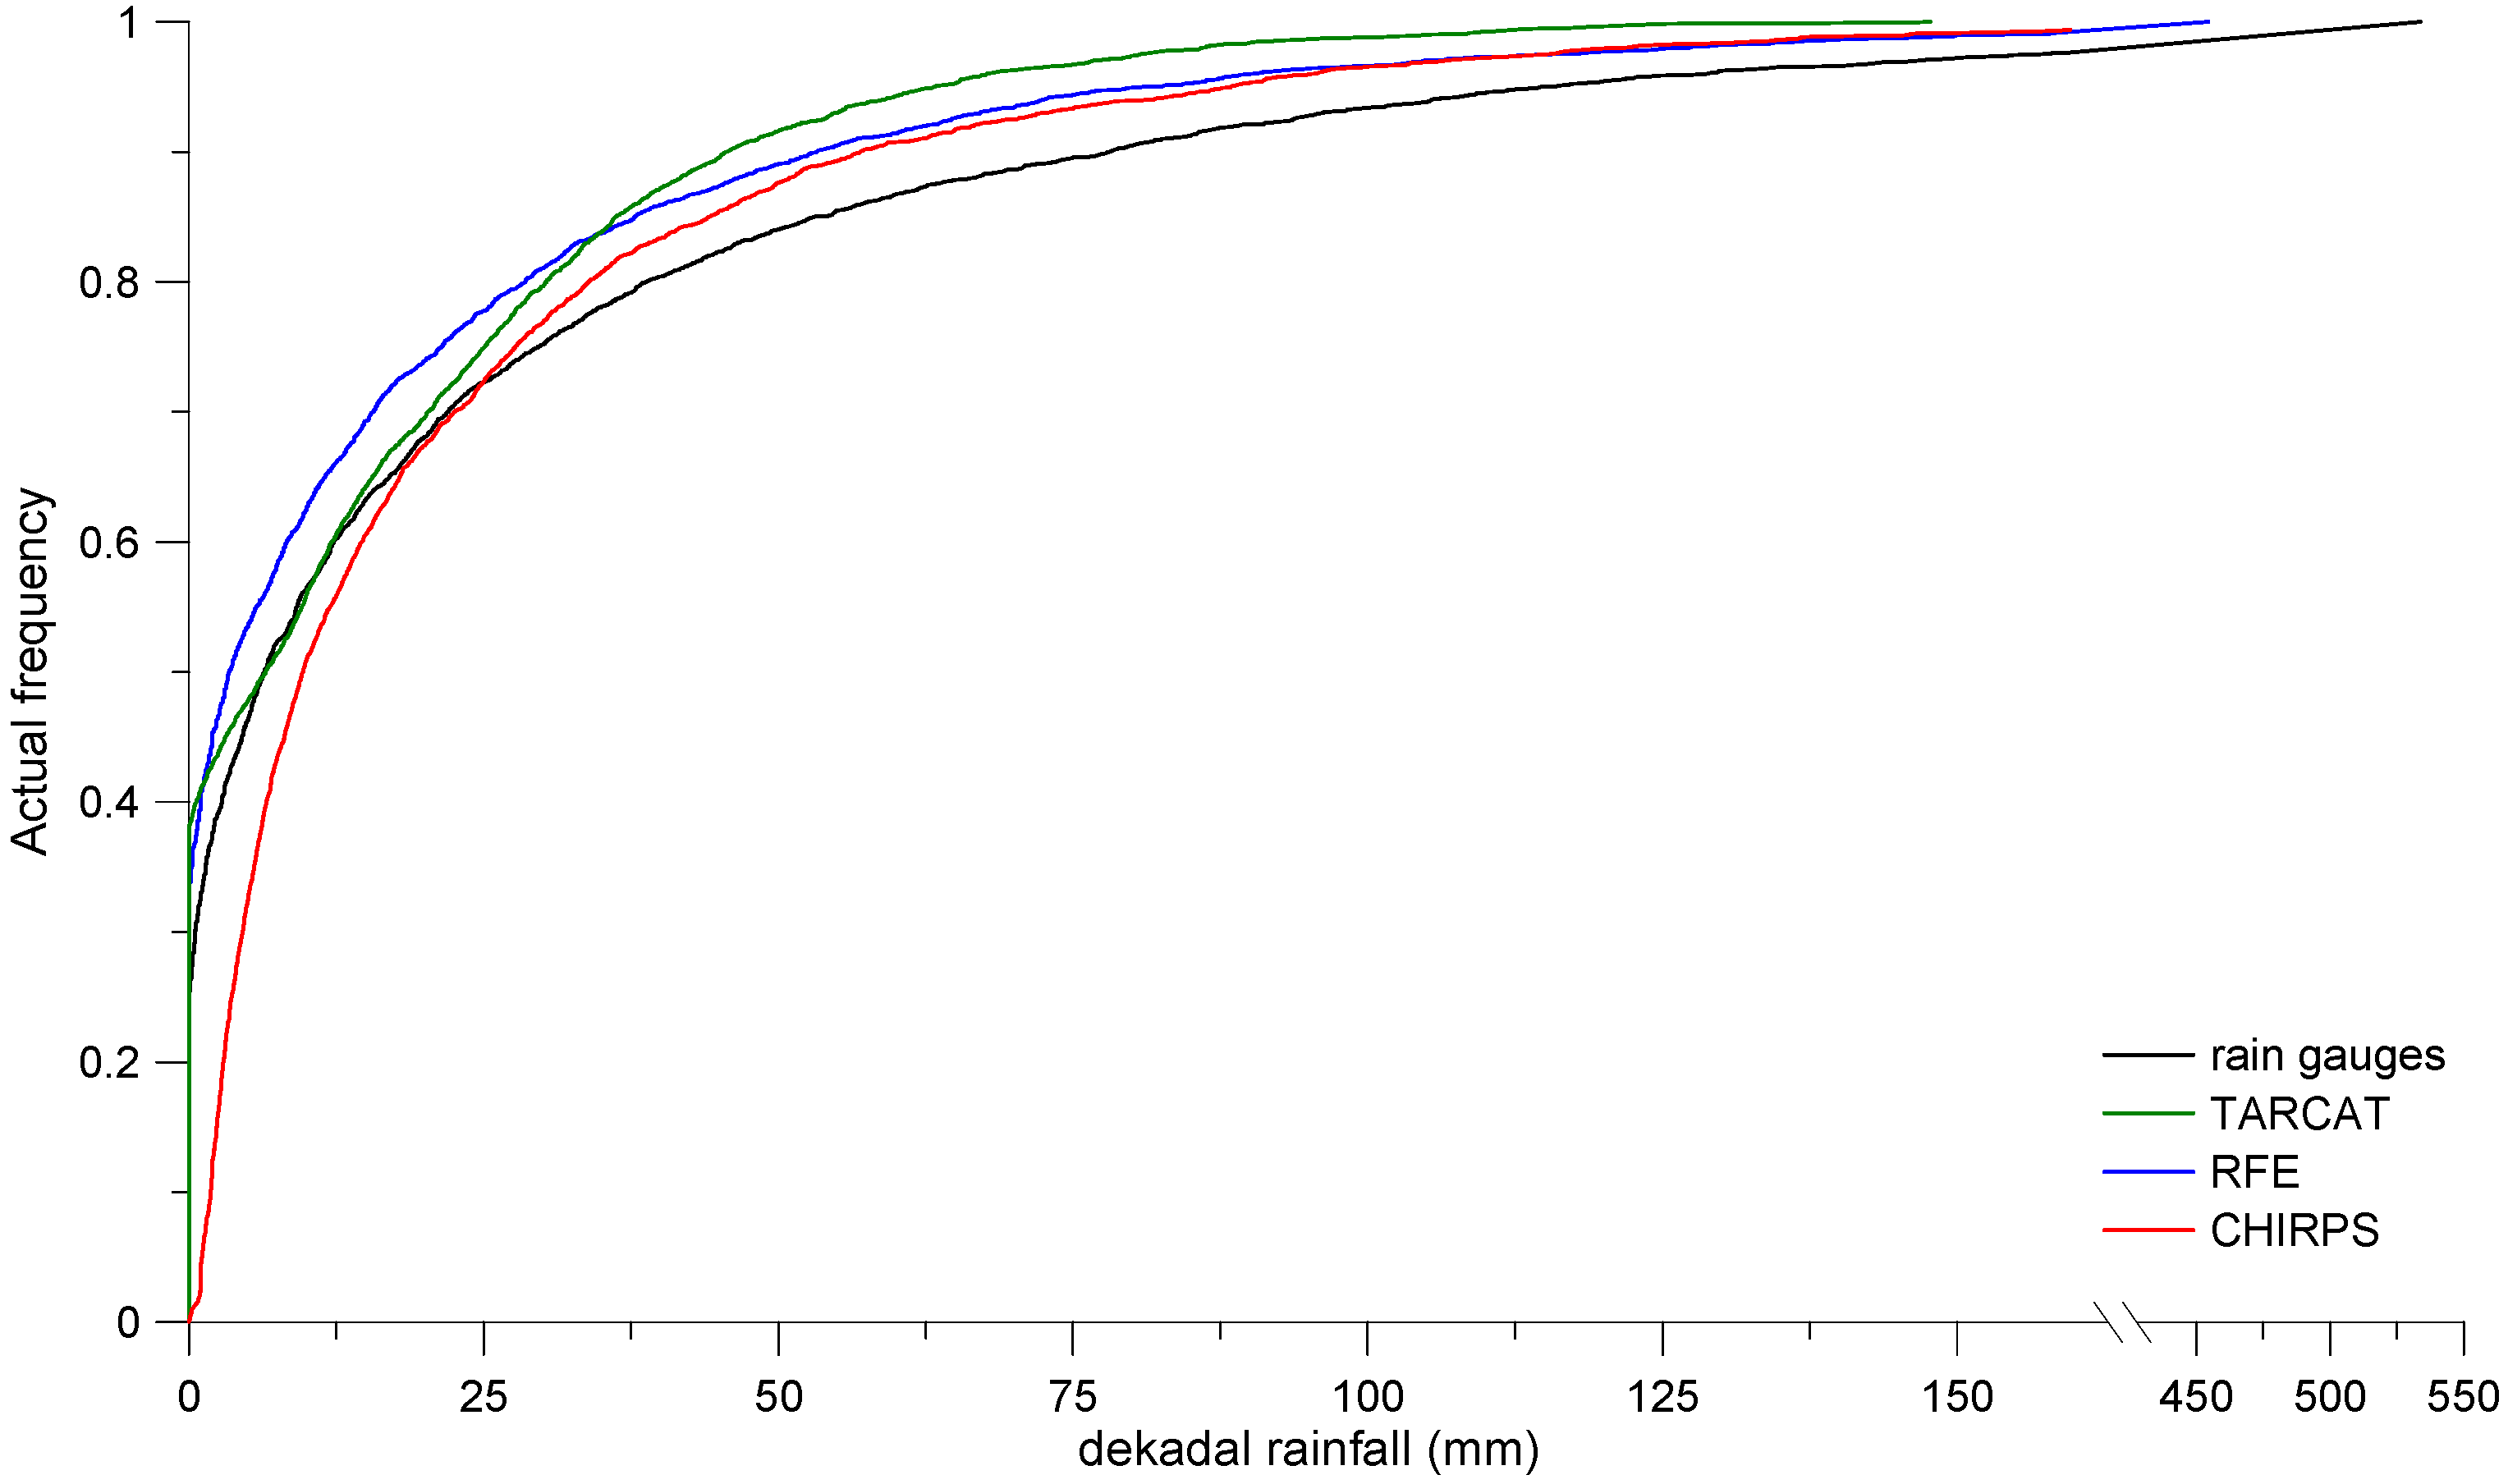
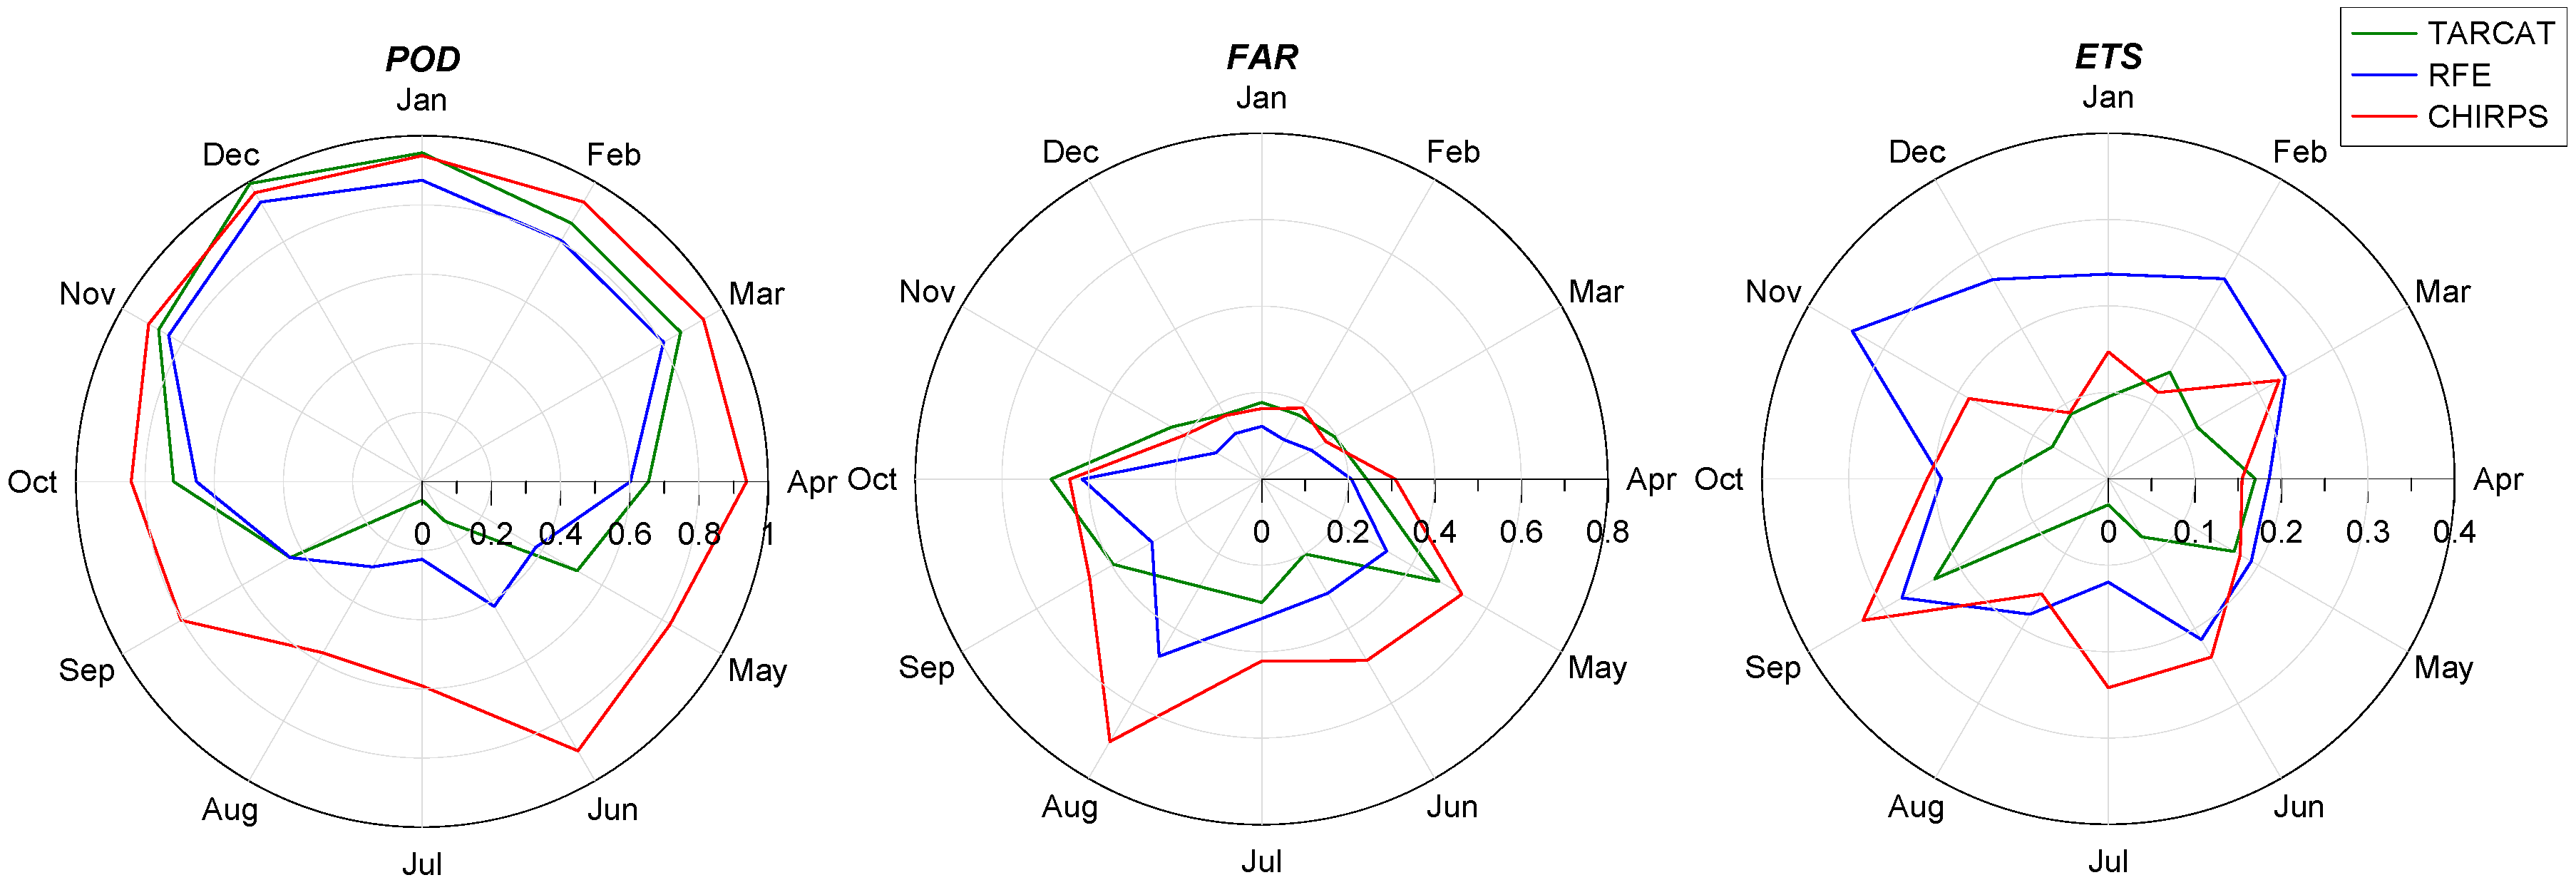
Overall, satellite products show overestimation of lower dekadal rainfall values and underestimation of higher values. The products that combine TIR and PM imagery with GTS stations (RFE) or TIR imagery and GTS stations (CHIRPS), perform comparatively well and outperform the TARCAT product, which is based on TIR only. However, TARCAT shows the best relative frequency of rainfall events, related to the local tuning of the TARCAT algorithm. TARCAT performs best in detecting rainfall events at point spatial scales, as represented by stations, likely due to the large number of gauge observations that were used to generate the product [
3]. RFE tends to underpredict the frequency of rainfall events, while CHIRPS tends to overpredict events and has the highest
FAR, making this product less useful for drought monitoring. The CHIRPS algorithm depends on 0.25° TRMM training data, and this dependence may contribute to its tendency to overpredict, since averaging over larger areas increases the frequency of rainfall events.
For drought monitoring and estimation of the effect on agricultural production, users require datasets, in which low rainfall amounts are skillfully detected and not overestimated, while for flood monitoring high rainfall events need to be correctly estimated. Differences in performance between products disappear with higher dekadal rainfall and all products achieve better results during the wet season. Although underestimations of absolute values are larger, Eff increases and Bias decreases. CHIRPS shows the best results during the cyclone season (December-February). RFE outperforms the other products for lower dekadal rainfall, and seems the most useful product for dry spell assessments during the main crop season (October–March). Over the entire seasonal cycle, however, CHIRPS tends to outperform RFE and TARCAT.
Estimations of inland rainfall were also compared to coastal rainfall and differences between the satellite products were found to be lower at larger distances from the coast. In addition, for the North region dominated by the ITCZ all satellite products perform better compared with the Central and South region, which is dominated by frontal weather systems. The TIR-only based TARCAT product performs better or as good as the other products in the North. CHIRPS outperforms the other products in the Central region. Additionally, for regions dominated by convective rainfall a locally calibrated algorithm using only TIR could perform at least as well as more sophisticated algorithms making use of multiple data sources [
20]. Our results confirm however that products blending TIR and PM imagery perform better when the situation is more complex, such as over the coastal, Central and South regions of Mozambique, where precipitation is influenced by frontal systems.
All three products evaluated here show both good qualities and relevant shortcomings when used for agro-climatic monitoring, early warning systems, and different hydrological applications. Further work could focus on rainfall anomalies and deviations from what is considered normal rainfall. The deeper historical record of the TIR-only estimates provides an important context for evaluating extremes and precipitation trends. Additionally, the performance of the different satellite products during specific, serious drought events or large floods in the recent past could be further investigated.


 and
and 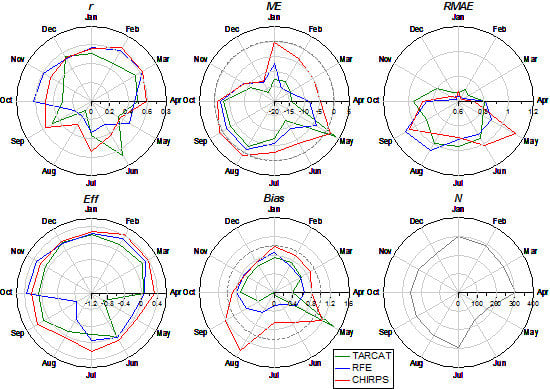


