
Abstract
The United States (US) is among the global hotspots of nitrogen (N) deposition and assessing the temporal trends of wet N deposition is relevant to quantify the effectiveness of existing N regulation policies and its consequent environmental effects. This study analyzed changes in observed wet deposition of dissolved inorganic N (DIN = ammonium + nitrate) in the US between 1985 and 2012 by applying a Mann–Kendall test and Regional Kendall test. Current wet DIN deposition (2011–2012) data were used to gain insight in the current pattern of N deposition. Wet DIN deposition generally decreased going from Midwest > Northeast > South > West region with a national mean rate of 3.5 kg N ha−1 yr−1. Ammonium dominated wet DIN deposition in the Midwest, South and West regions, whereas nitrate and ammonium both contributed a half in the Northeast region. Wet DIN deposition showed no significant change at the national scale between 1985 and 2012, but profound changes occurred in its components. Wet ammonium deposition showed a significant increasing trend at national scale (0.013 kg N ha−1 yr−2), with the highest increase in the Midwest and eastern part of the South region. Inversely, wet nitrate deposition decreased significantly at national scale (−0.014 kg N ha−1 yr−2), with the largest reduction in the Northeast region. Overall, ratios of ammonium versus nitrate in wet deposition showed a significant increase in all the four regions, resulting in a transition of the dominant N species from nitrate to ammonium. Distinct magnitudes, trends and patterns of wet ammonium and nitrate deposition suggest the needs to control N emissions by species and regions to avoid negative effects of N deposition on ecosystem health and function in the US.
Export citation and abstract BibTeX RIS

Content from this work may be used under the terms of the Creative Commons Attribution 3.0 licence. Any further distribution of this work must maintain attribution to the author(s) and the title of the work, journal citation and DOI.
1. Introduction
Anthropogenic nitrogen (N) emissions have caused an increase in global N deposition (Galloway et al 2004), affecting a number of key environmental issues such as loss of biodiversity (Bobbink et al 2010, Clark et al 2013), eutrophication and acidification of terrestrial and aquatic ecosystems (Greaver et al 2012) and nitrogen–carbon–climate interactions (De Vries et al 2008, Erisman et al 2011, Suddick and Davidson 2012). The United States (US) is among the global hotspots of N emissions and deposition (Dentener et al 2006, Clarisse et al 2009, Ghude et al 2009). Emissions of oxidized N (NOx ) have steadily increased throughout the middle of the 20th century until it has been first regulated under the Clean Air Act (CAA) of 1970 through National Ambient Air Quality Standards (NAAQS) (Houlton et al 2013). Between 1990 and 2008, NOx emissions in the US have decreased by 36% due to the CAA Amendments of 1990 (Davidson et al 2012). By contrast, emissions of reduced N (NH3) are currently unregulated under the NAAQS in the US. Reduction of NOx emissions have led to a decrease in precipitation nitrate (NO3−) concentration and nitrate deposition, especially in the eastern US (Butler et al 2003, 2005), while unregulated NH3 emissions may increase ammonium (NH4+) deposition. Accurate information on trends in the deposition of both N species is necessary to assess the effectiveness of the existing NOx regulation policies and the need of NH3 regulation in view of the resulting environmental effects.
The National Atmospheric Deposition Program (NADP) in the US was initiated to monitor precipitation chemistry in the late 1970s and the network grew rapidly in the early 1980s. There have been a number of studies analyzing the spatial patterns of N deposition (Fenn et al 2003, Holland et al 2005) and temporal trends of precipitation N chemistry using the NADP data (e.g. Lynch et al 1995, Nilles and Conley 2001, Lehmann et al 2005, Stephen and Aneja 2008). Most of these analyses either focus on the spatial pattern of N deposition without considering the temporal trends or only test the trends of precipitation N chemistry but not wet N deposition. There has also been some modeling work on the distributions and historical changes of N deposition in the US (Zhang et al 2012, Lamarque et al 2013). However, the multi-model results of the Atmospheric Chemistry and Climate Model Intercomparison Project showed limited agreement with and even misrepresentation of observational N deposition changes between 1980 and 2000 over the US (Lamarque et al 2013).
With long-term data available, assessing temporal trends of wet deposition is ready to provide an observed evidence of changes in atmospheric N inputs to various ecosystems. The drivers of reduced and oxidized N deposition are different from each other. For instance, ammonium deposition is mainly driven by NH3 emissions from agricultural activities such as livestock breeding and ammonia fertilizer application (Anderson et al 2003, Sutton et al 2008), whereas nitrate deposition is mostly derived by NOx emissions from combustion processes (Galloway et al 2003). Moreover, the oxidized and reduced N species can exert different environmental effects. For instance, ammonium deposition is more effective than nitrate deposition in decreasing biodiversity and is more harmful to vegetation (Erisman et al 2007). Therefore, it is essential to consider N species separately when assessing the status and impacts of N deposition. It is also important to note that once deposited, both ammonium and nitrate can be converted to other N species, primarily by microbial action.
Environmental data such as N deposition commonly do not always follow a normal distribution. The Mann–Kendall test (MKT) is a non-parametric test to detect time-serial trends without requiring a normal data distribution (Mann 1945). Recently, a regional Kendall test (RKT) has been proposed to quantitatively combine results of the MKT for individual sites to detect whether a consistent trend occurs over an entire region (Helsel and Frans 2006). This study applied the MKT and RKT to observed time-serial data from NADP to assess the trends of wet deposition of ammonium, nitrate and total dissolved inorganic N (DIN = NH4+ – N + NO3− – N) over the US between 1985 and 2012. Note that organic N deposition was not included in this study due to a lack of observed data, even though organic N was suggested to account for approximately 25% of total N deposition on a global basis (Jickells et al 2013).
2. Material and methods
2.1. Data set
Observed data of annual wet deposition between 1985 and 2012 were provided from NADP (http://nadp.sws.uiuc.edu/), including information on wet deposition of ammonium, nitrate and DIN and site locations (latitude and longitude). Samples were gathered using buckets opening at the start and closing at the end of each precipitation event and were pooled to one weekly sample for chemical analyses by a central laboratory with a good quality control (more information available at: http://nadp.sws.uiuc.edu/NTN/). Wet N deposition (kg N ha−1 yr−1) was calculated as an annual sum of N fluxes in precipitation. Sites were excluded if data were missing for one or more years. Totally 151 sites were used, including 20 sites in the Northeast, 42 sites in the South, 38 sites in the Midwest and 51 sites in the West region (figure 1). Sites in Alaska and Hawaii were not considered in the analysis of this study.
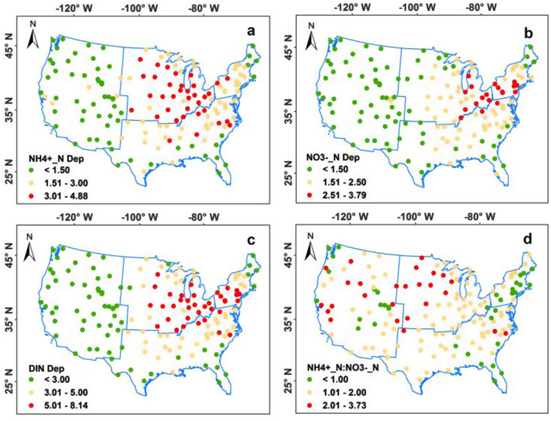
Figure 1. Current patterns of wet N deposition (unit: kg N ha−1 yr−1) and NH4+–N : NO3−–N ratios at 151 sites in the US (2011–2012). Two-year mean values of (a) wet ammonium (NH4+–N) deposition, (b) wet nitrate (NO3−–N) deposition, (c) wet DIN deposition and (d) NH4+–N : NO3−–N ratio are shown for each site.
Download figure:
Standard image High-resolution image2.2. Statistical analysis
We first calculated annual mean wet deposition of ammonium, nitrate and DIN for each site during 2011 and 2012 to assess the current status of wet N deposition. We then performed the MKT to detect trends of wet deposition of ammonium, nitrate and DIN and NH4+–N : NO3−–N ratios for the 151 sites. Assuming that a time series was formed by n data (y1, y2, y3, ... yn ), Kendall's S statistic was computed from each data pairing, S = P – M, where P was the number of yi < yj for all i < j and M was the number of yi > yj for i < j. If S was significantly different from zero, a trend in y occurred. The trend slope (Theil–Sen's slope) of MKT was estimated following the method given by Sen (1968) and Akritas et al (1995). The trend slope was assumed to be 0 when p > 0.1. Spatial patterns for current variation and temporal trends of wet N deposition and NH4+–N : NO3−–N ratios, based on individual site data, were illustrated using ArcGIS Desktop (version 9.3, ESRI, USA).
We further applied the RKT to assess the overall trends for the four regions and the whole nation. The RKT first computed the MKT on each site separately, and summed the Kendall's S statistics for each location as the RKT's Sr statistics. If Sr was significantly different from zero, a regional trend occurred. The trend slope of RKT was computed as the median of all slopes between data pairs within the same region (Helsel and Frans 2006).
Statistical analysis was carried out in R software for Windows (version 3.1.0; R Development Core Team, 2014, www.r-project.org/). The MKT and RKT were performed using the 'RKT package' for R software developed by Marchetto et al (2013), which also estimated the Theil–Sen's slope. Data were presented as means ± standard errors, if not otherwise noted.
3. Results
3.1. Current patterns of wet N deposition
Current wet ammonium deposition (2011–2012) was highest in the Midwest region (generally >3 kg N ha−1 yr−1) and lowest in the West region (generally <1.5 kg N ha−1 yr−1), while the Northeast and the South regions showed intermediate levels (generally 1.5 ∼ 3.0 kg N ha−1 yr−1) (figure 1(a); table 1). Mean wet nitrate deposition was highest in eastern part of the Midwest region and the southern part of the Northeast region (generally >2.5 kg N ha−1 yr−1), and was lowest in the West region (generally <1.5 kg N ha−1 yr−1) (figure 1(b); table 1). Most sites in the Midwest, Northeast and South regions showed values of wet DIN deposition >3 kg N ha−1 yr−1, while wet DIN deposition at sites in the eastern part of the Midwest region and the Southern part of the Northeast region was mostly >5 kg N ha−1 yr−1 (figure 1(c)). Mean wet DIN deposition decreased going from the Midwest > Northeast > South > West region (table 1). The NH4+–N : NO3−–N ratio was highest in the Midwest region with a mean value of 1.81 ± 0.08, whereas it was lowest in the Northeast region with a mean value of 0.99 ± 0.04 (figure 1(d); table 1). Overall, national mean wet DIN deposition was 3.5 ± 0.2 kg N ha−1 yr−1 in the US with a higher contribution by wet ammonium deposition (NH4+–N : NO3−–N ratio = 1.46 ± 0.05) (table 1).
Table 1. Regional and national mean wet deposition (DIN, NH4+–N, NO3−–N, unit: kg N ha−1 yr−1) and NH4+–N : NO3−–N ratio in the US during 2011 and 2012. The abbreviations NEUS, SUS, MWUS, WUS and US indicate the Northeast, South, Midwest, West regions and the US as a whole, respectively. Standard errors of mean are shown in brackets and the superscripted letters indicate whether there is a significant difference among the four regions at p < 0.05. Same letters mean no significant difference and different letters mean significant difference.
| Region | NH4+–N | NO3−–N | DIN | NH4+–N : NO3−–N |
|---|---|---|---|---|
| NEUS | 2.2b (0.2) | 2.2a (0.2) | 4.4b (0.3) | 0.99c (0.04) |
| SUS | 2.1b (0.1) | 1.6c (0.1) | 3.7c (0.2) | 1.39b (0.08) |
| MWUS | 3.4a (0.1) | 2.0b (0.1) | 5.4a (0.2) | 1.81a (0.08) |
| WUS | 0.9c (0.1) | 0.7d (0.1) | 1.6d (0.1) | 1.44b (0.09) |
| US | 2.0 (0.1) | 1.5 (0.1) | 3.5 (0.2) | 1.46 (0.05) |
3.2. Patterns in temporal trends of wet N deposition
The results of the MKT showed that patterns of temporal trends in wet N deposition differed significantly by species and by region between 1985 and 2012. Wet ammonium deposition showed an increase mainly in the West, Midwest and the eastern part of the South region, while in the Northeast region and western part of the South region most sites did not show a significant trend (figure 2(a)). Wet nitrate deposition showed a decrease mainly in the Northeast, South and the Eastern part of the Midwest region, while most sites in the West and the Western parts of the Midwest regions did not show a significant change (figure 2(b)). Taken together, sites showing a significant increase in wet DIN deposition were mostly located in the northern part of the West region and western part of the Midwest region, while sites with a significant decrease were mostly located in the Northeast region (figure 2(c)). The NH4+–N : NO3−–N ratio showed a significant increase across the US with the highest rate of change occurring in the Midwest, West and Eastern part of the South region (figure 2(d)).
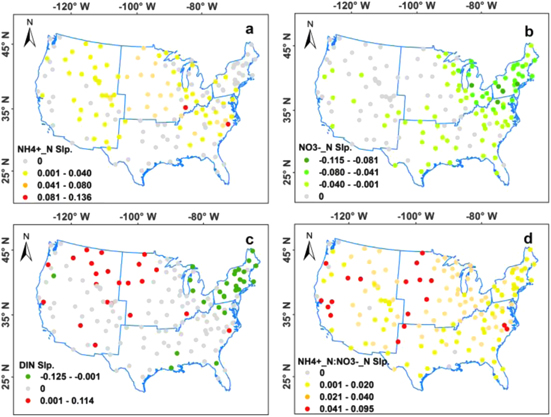
Figure 2. Temporal trends of wet N deposition and NH4+–N : NO3−–N ratio at 151 sites in the US between 1985 and 2012. Theil–Sen's slopes (unit: kg N ha−1 yr−2 for N deposition and yr−1 for NH4+–N : NO3−–N ratio) of (a) wet ammonium (NH4+–N) deposition, (b) wet nitrate (NO3−–N) deposition, (c) wet DIN deposition and (d) NH4+–N : NO3−–N ratio are shown for each site when p < 0.1, or else the slopes are assumed to be 0 when p > 0.1.
Download figure:
Standard image High-resolution image3.3. Overall trends of wet N deposition in different regions
The results of the RKT, which was applied to detect whether a consistent trend occurs over an entire region, showed that wet ammonium deposition generally increased in all the four regions (table 2). The rate of change, however, decreased from the Midwest > South > West > Northeast region. Wet nitrate deposition showed a significant decreasing trend in all the four regions with the decreasing rate declining from the Northeast > Midwest > South > West region (table 2). Between 1985 and 2012, wet ammonium deposition has increased by 19% in the Northeast region, 57% in the South region, 42% in the Midwest region, 101% in the West region and 49% in the whole US, respectively. However, wet nitrate deposition has decreased by 44% in the Northeast region, 23% in the South region, 36% in the Midwest region, 5% in the West region and 31% at national scale.
Table 2. Regional Kendall test of regional trends for wet N deposition (DIN, NH4+–N, NO3−–N) (unit: kg N ha−1 yr−2) and NH4+–N : NO3−–N ratios (unit: yr−1) in the US between 1985 and 2012. The abbreviations NEUS, SUS, MWUS, WUS and US indicate the Northeast, South, Midwest and West regions and the US as a whole, respectively.
| Region | NH4+–N | NO3−–N | DIN | NH4+–N/NO3−–N | ||||
|---|---|---|---|---|---|---|---|---|
| Slope | p | Slope | p | Slope | p | Slope | p | |
| NEUS | 0.008 | < 0.001 | −0.061 | < 0.001 | −0.051 | < 0.001 | 0.017 | < 0.001 |
| SUS | 0.016 | < 0.001 | −0.022 | < 0.001 | −0.004 | 0.17 | 0.020 | < 0.001 |
| MWUS | 0.032 | < 0.001 | −0.025 | < 0.001 | 0.009 | < 0.05 | 0.028 | < 0.001 |
| WUS | 0.014 | < 0.001 | −0.008 | < 0.001 | 0.006 | < 0.001 | 0.024 | < 0.001 |
| US | 0.013 | < 0.001 | −0.014 | < 0.001 | 0 | 0.67 | 0.022 | < 0.001 |
The different trends and slopes of ammonium and nitrate deposition lead to distinct trends of wet DIN deposition in the four regions. The Northeast region showed a significant decrease in wet DIN deposition (p < 0.001) due to a greater decrease in nitrate deposition, while the Midwest and West regions showed a significant increase (p < 0.001) due to a greater increase in ammonium deposition (table 2). Generally, wet DIN deposition has decreased by 24% in the Northeast region and has increased by 36% in the West region. The South region did not show significant change in wet DIN deposition (p = 0.17) because the increase in wet ammonium deposition (0.016 kg N ha−1 yr−2, p < 0.001) was offset by the decrease in wet nitrate deposition (−0.022 kg N ha−1 yr−2, p < 0.001). The NH4+–N : NO3−–N ratio showed a significant increase in all the four regions (p < 0.001) with slopes decreasing from Midwest > West > South > Northeast region (table 2). At national scale, wet ammonium deposition showed a significant increase (0.013 kg N ha−1 yr−2, p < 0.001), whereas wet nitrate deposition showed a significant decrease (−0.014 kg N ha−1 yr−2, p < 0.001), leading to no significant change in DIN deposition (p = 0.67) but a substantial increase in NH4+–N : NO3−–N ratio (0.022 yr−1, p < 0.001) (table 2).
4. Discussion
Our results showed that current wet deposition of ammonium and nitrate (2011–2012) in the US had distinct regional patterns and magnitudes, which generally agreed with the results simulated by the GEOS-Chem global chemical transport model based on the period 2006–2008 (Zhang et al 2012). Ammonium dominated wet DIN deposition in the Midwest, South and West regions, while in the Northeast region nitrate and ammonium both accounted for half of wet DIN deposition. This is because emission sources of NOx and NH3 are distributed differently in these regions. Highest ammonium deposition occurred in the Midwest region, being the major food production region with large NH3 emissions from livestock breeding and chemical N fertilizer application. The regions showing highest nitrate deposition were characterized by developed manufacturing industry. Considering the contribution of dry deposition (1.3 ∼ 1.6 times of wet DIN deposition; Zhang et al 2012) and organic N deposition (∼25% of total N deposition; Jickells et al 2013), total N deposition was estimated to be 2.9–3.3 times of wet DIN deposition. In the Midwest, South and Northeast regions, total N deposition was thus estimated to be 9 ∼ 26 kg N ha−1 yr−1. This is comparable to the range of empirical critical loads for forest ecosystems (3 ∼ 26 kg N ha−1 yr−1) (Pardo et al 2011) and exceeded that of lakes (2 ∼ 8 kg N ha−1 yr−1) (Baron et al 2011, Pardo et al 2011). This result agrees with a recent review, which summarized the ecological effects of N and S deposition in the US, concluding that current air-quality standards do not protect ecosystems from the effects of N deposition in many parts of the nation (Greaver et al 2012). The absence of regulation policy for NH3 emissions should have contributed to the failure of current NOx regulation policy to protect many ecosystems in the US.
Wet ammonium deposition increased by 50% at national scale between 1985 and 2012, with the highest increase in the Midwest and Eastern part of the South region. Currently 80% of total NH3 emissions in the US are from livestock manure management and application of chemical N fertilizers (Reis et al 2009, Davidson et al 2012). Because NH3 emissions from agricultural activities are rarely regulated, these growing NH3 emissions significantly drove the increase of ammonium deposition during the recent decades (table 2; figure 3(a)). The increase in ammonium deposition in the Midwest region was likely attributed to larger animal breeding (e.g. hogs and cattle) and N fertilizer application, whereas the increase in the Southeast was mostly due to smaller livestock (e.g. chickens) (Stephen and Aneja 2008). The Midwest, South and West regions showed very high rates of increase in wet ammonium deposition, suggesting the urgency to regulate NH3 emissions in these regions.
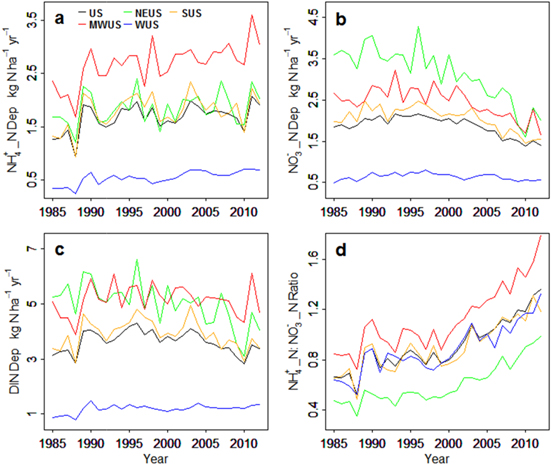
Figure 3. Temporal variations of regional and national median (a) wet ammonium (NH4+–N) deposition (unit: kg N ha−1 yr−1), (b) wet nitrate (NO3−–N) deposition (unit: kg N ha−1 yr−1), (c) wet DIN deposition (unit: kg N ha−1 yr−1) and (d) NH4+–N : NO3−–N ratio in the US between 1985 and 2012. The abbreviations NEUS, SUS, MWUS, WUS and US indicate the Northeast, South, Midwest, West regions and the US as a whole, respectively.
Download figure:
Standard image High-resolution image
Wet nitrate deposition decreased substantially by one-third at national scale between 1985 and 2012, with a largest reduction in the Northeast region. The decrease of wet nitrate deposition was attributed to the curb of NOx emissions by the promulgation of CAA and especially the 1990 amendments. Due to the trade-off of a decrease in NOx from fossil-fuel burning industries and an increase in emissions from automobiles, national NOx emissions did not show substantial decrease until the late 1990s (Howarth et al 2002). Accordingly, satellite observations have clearly detected decreases in NO2 columns since 1999 due to control of NOx emissions from power plants over the eastern US (Kim et al 2006). Further, NOx emissions from electrical generation are expected to have decreased by over 50% between 2005 and 2014 based on the Cross-State Air Pollution Rule (Davidson et al 2012). The temporal variations of wet nitrate deposition agree well with the changes of NOx emissions, showing a rapid decrease since late 1990s (figure 3(b)). Despite significant reduction in wet nitrate deposition in the Northeast region and nearby states, both the wet and dry deposition of oxidized N in the Northeast region is still the highest across the nation (this study; Zhang et al 2012).
Trends of wet DIN deposition varied by regions between 1985 and 2012 and no significant changes in wet DIN deposition has been found at national scale (table 2; figure 3(c)). However, the increase in wet ammonium deposition and the decrease in wet nitrate deposition resulted in a consistent increase of NH4+–N : NO3−–N ratio across the nation (table 2; figure 3(d)). Nitrate dominated wet deposition across the nation in 1985 (mean NH4+–N : NO3−–N ratio = 0.72) and the NH4+–N : NO3−–N ratio had increased to 1.49 in 2012, indicating a transition of dominant N species in wet deposition. The significant decrease of wet nitrate deposition especially in the Eastern US indicates an effective regulation of oxidized N emissions from industrial power generation, which should have useful implications for the developing countries with rapid increase of NOx emissions, such as China, India and South Africa (Garg et al 2006, Ghude et al 2009, Liu et al 2011). Currently, industrial power generation in the US only contributes to 27% of national NOx emissions, while vehicle emissions accounts for as high as 62% (Reis et al 2009). Therefore, further reduction in atmospheric deposition of oxidized N will require a regulation of NOx emissions from motor vehicles. Wet ammonium deposition currently accounts for 60% of wet DIN deposition at national scale, suggesting a current need in regulating NH3 emissions. Or else, intensive agricultural activities, necessary to support food security for expected population growth, will continually increase NH3 emissions and ammonium deposition in the food production regions (Erisman et al 2008).
5. Conclusions
This study analyzed the trends of wet DIN deposition over the US between1985 and 2012 by applying the MKT and RKT to observed time-serial data from NADP. Wet DIN deposition showed no significant change at national scale, but profound changes have occurred in wet deposition of ammonium and nitrate. Due to effective regulation of NOx emissions, wet nitrate deposition showed a significant decrease at national scale, with the largest reduction in the Northeast region. Without regulation of NH3 emissions, wet ammonium deposition showed a substantial increase, with the highest increase in the Midwest region and Eastern part of the South region. Mean NH4+–N : NO3−–N ratio across the nation has increased from 0.72 in 1985 to 1.49 in 2012, indicating a transition of dominant N species in wet deposition. Our results imply that the increase of ammonium deposition due to the absence of control policy for NH3 emissions should be mainly responsible for the current threat of N deposition to many ecosystems in the US. Moreover, distinct magnitudes, trends and patterns of wet ammonium and nitrate deposition suggest the needs to control N emissions by species and regions.
Acknowledgments
The authors would like to thank all the sponsors of NADP (http://nadp.sws.uiuc.edu/) and the NADP Program Office for providing the N deposition data used in this study. This study was partly supported by the National Natural Science Foundation of China (No. 31021001), and National Basic Research Program of China on Global Change (2010CB950600).