Article

Combining Satellite Data and Community-Based Observations for Forest Monitoring

1
Laboratory of Geo-information Science and Remote Sensing, Wageningen University, P.O. Box 47, NL-6700 AA, Wageningen, The Netherlands
2
The Nature and Biodiversity Conservation Union (NABU), Bonga, Southern Nations Nationalities and People's Region (SNNPR), Ethiopia
*
Author to whom correspondence should be addressed.
Forests 2014, 5(10), 2464-2489; https://doi.org/10.3390/f5102464
Submission received: 5 May 2014 / Revised: 20 September 2014 / Accepted: 6 October 2014 / Published: 14 October 2014

Abstract

:
Within the Reducing Emissions from Deforestation and Degradation (REDD+) framework, the involvement of local communities in national forest monitoring activities has the potential to enhance monitoring efficiency at lower costs while simultaneously promoting transparency and better forest management. We assessed the consistency of forest monitoring data (mostly activity data related to forest change) collected by local experts in the UNESCO Kafa Biosphere Reserve, Ethiopia. Professional ground measurements and high resolution satellite images were used as validation data to assess over 700 forest change observations collected by the local experts. Furthermore, we examined the complementary use of local datasets and remote sensing by assessing spatial, temporal and thematic data quality factors. Based on this complementarity, we propose a framework to integrate local expert monitoring data with satellite-based monitoring data into a National Forest Monitoring System (NFMS) in support of REDD+ Measuring, Reporting and Verifying (MRV) and near real-time forest change monitoring.

1. Introduction

Forests cover approximately 30% of the Earth’s land surface [1] and are of immense value to humankind, as they provide habitats for a wide variety of species and play an important role in the global carbon cycle. However, a loss of approximately 2101 square kilometers of tropical forests per year [1] has made a significant contribution to the increase of greenhouse gases (GHGs) in the atmosphere, resulting in accelerated global warming [2,3]. To mitigate this effect, the United Nations Framework Convention on Climate Change (UNFCCC) has proposed an international mechanism called Reducing Emissions from Deforestation and Degradation (REDD+) in developing countries [3,4]. The REDD+ mechanism includes reducing deforestation and forest degradation, forest enhancement, sustainable forest management and conservation [5]. Recently, the 19th Conference of Parties (COP) of the UNFCCC in Warsaw, November, 2013, agreed on a collection of seven decisions on REDD+ [6]. Together with the REDD+ decisions adopted at previous COPs, these decisions provide international policy guidance (the Rulebook on REDD+) on how countries should deal with REDD+ in the framework of the UNFCCC [6]. Besides reduction of carbon emissions, the REDD+ mechanism also includes establishment of national institutions, ensuring co-benefits and safeguards and, above all, creating performance-based financing mechanisms [2,7,8].
A country participating in REDD+ requires a reliable, transparent and credible national-level forest monitoring system (NFMS) for Measuring, Reporting and Verifying (MRV) activity data and emission factors [8,9,10]. Activity data is defined as the magnitude of human activity resulting in emissions or removals. In the case of forest-related emissions and removals, activity data refers to forest area change (generally measured in hectares), whereas the emission factor is related to the rate of emission of a given GHG from a given source, relative to units of activity (generally measured in tons of carbon per hectare) [2]. Given that forest change is a dynamic process, monitoring needs to be carried out on a regular basis to support national MRV requirements. Establishing such monitoring systems is presumed to be expensive for developing countries [8,11,12,13]. An activity monitoring system should be based on four broad monitoring objectives related to the location, area, time and drivers of forest change. These objectives should be properly integrated with monitoring and MRV systems at the national level. Current schemes for monitoring these activities are based on remote sensing and field measurements mainly from national forest inventories.
Remote sensing has proven to be very useful for deforestation monitoring at the global, national and subnational scale [1,14,15,16]. However, remote sensing based monitoring of forest degradation and regrowth still remains problematic [17,18,19], due to cloud cover, seasonality and the limited spatial and temporal resolution of remote sensing observations. Enhancing the interpretation of remote sensing analyses requires substantial ground verification and validation [20]. Accomplishing these tasks through national forest inventory data is expensive, time-consuming and difficult to implement across large spatial scales [21,22].
Community-based monitoring (CBM) is an emerging alternative method for forest change monitoring that promises to be cheaper than conventional monitoring methods [7,23,24,25]. CBM methodologies can be organized into two main categories: (i) forest carbon stock measurements for emission factors; and (ii) forest change monitoring for activity data. Results from well-designed forest carbon measurement studies [26,27,28,29] have demonstrated that local datasets are comparable to professional measurements, while being cheaper to obtain. Furthermore, CBM can be considered as a tool to empower the local communities and raise awareness towards better forest management [30,31].
While CBM-based forest carbon stock measurement has been shown to be feasible [26,27], monitoring of forest change through CBM has not been thoroughly investigated yet. Forest change monitoring is a continuous process, which requires continuous data acquisition, and local communities may act as active in situ sensors [32]. Their local knowledge could be especially valuable in signaling forest change activities (deforestation, forest degradation or reforestation) and providing valuable information, such as location, time, size, type and proximate drivers of the change events on a near real-time basis [24]. The impacts of these activities are rarely captured comprehensively in national forest inventories or from remote sensing [7,8,25]. The recent development of hand-held technologies continues to improve and has significantly enhanced the local capacity in data collection procedures [29]. Data acquired by communities can therefore play an essential role in enhancing the efficiency and lowering the cost of monitoring activities, while simultaneously promoting transparency and better management of forests. Thus, local participation within monitoring programs holds promise for national REDD+ MRV implementation.
Despite the potentials of CBM, the main challenge of using locally collected data lies in the lack of confidence in data collection procedures [30]. The accuracy and reliability of such datasets are often questionable due to inconsistencies arising from the fact that local participants collect data independently of each other. This can further result in incomplete data collection and a biased representation of changes in a study area [33]. Therefore, data credibility and trustworthiness are major obstacles to the integration of CBM data in NFMS [34,35]. This fact has triggered us to rectify the current shortcomings and expand the current state of knowledge in community-based forest monitoring and its utility in NFMS. Specifically, we aim to check the consistency of local datasets and investigate their complementary use to remote sensing.
The purpose of this research is to discover new perspectives and insights into community-based observations. The aims of this paper are to: (i) present the details of a local expert-based forest monitoring system; (ii) assess the spatial, temporal and thematic accuracy of local expert data against independent field-based measurements and high resolution SPOT and RapidEye satellite imagery; and (iii) explore the complementarity of local expert data with remote sensing data. While the UNESCO Kafa Biosphere Reserve in Southwestern Ethiopia is shown here as a case study, the concepts presented in this study are applicable to a broader geographic scope and can be scaled up to the national level in support of NFMS and REDD+ MRV.

2. Materials and Methods

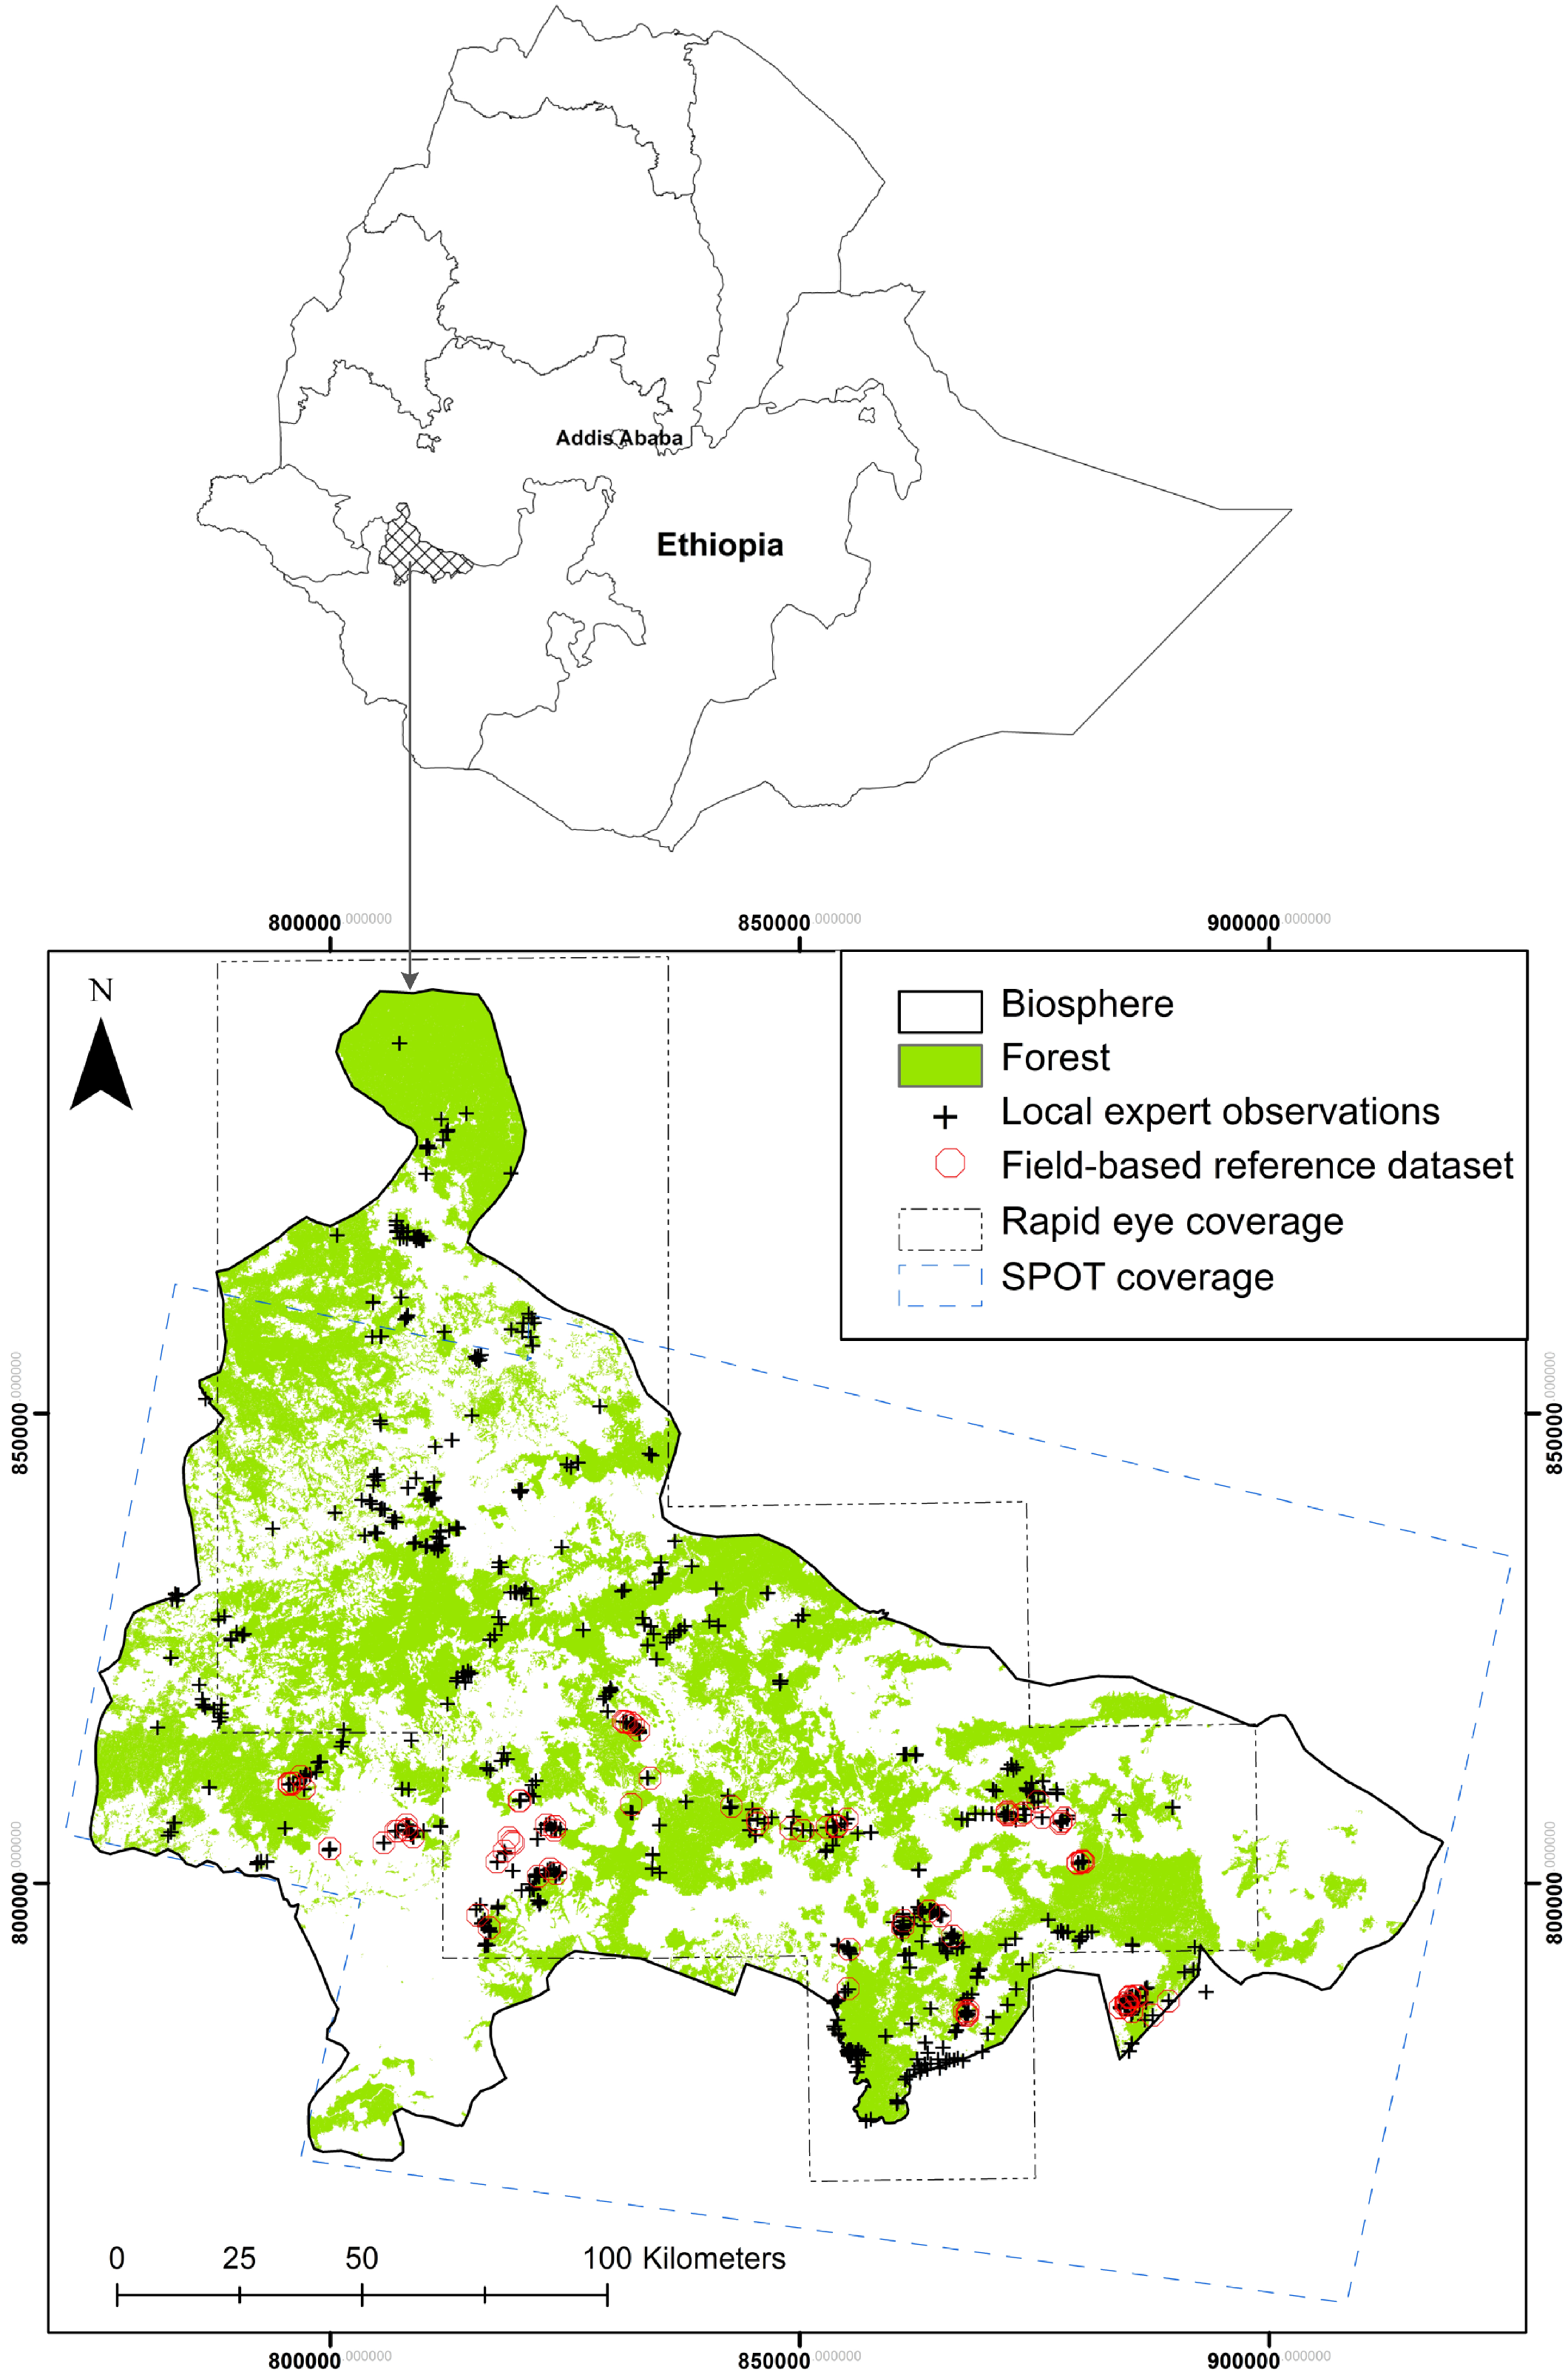
2.1. Study Area Description

The study area is situated in the Kafa Zone, Southern Nations Nationalities and People’s Region (SNNPR), in Southwestern Ethiopia (Figure 1). The Kafa Zone is over 700,000 ha in size and was recognized as a Biosphere Reserve by UNESCO’s Man and the Biosphere (MaB) program in March, 2011. This region is characterized by Afromontane cloud forest, with approximately 50% of the land cover still forested. Average annual precipitation in the area is approximately 1700 mm, and average annual air temperature is approximately 19 °C [36]. The topography of the Kafa Biosphere consists of mountains and undulating hills, with elevations ranging between 400 to 3100 m. The forest ecosystem provides an important contribution to the livelihoods of the people in the area, including wild coffee, valuable spices and honey from wild bees. It also represents a significant store of forest carbon as above-ground biomass.
Figure 1. Study area in the UNESCO Kafa Biosphere Reserve, Southwestern Ethiopia; local expert observations (black crosses) were compared with a field-based reference dataset (red circles) and high resolution remote sensing data from the SPOT (footprint shown as a blue dotted line) and RapidEye (footprint shown as a black dotted line) sensors.
Forests 05 02464 g001

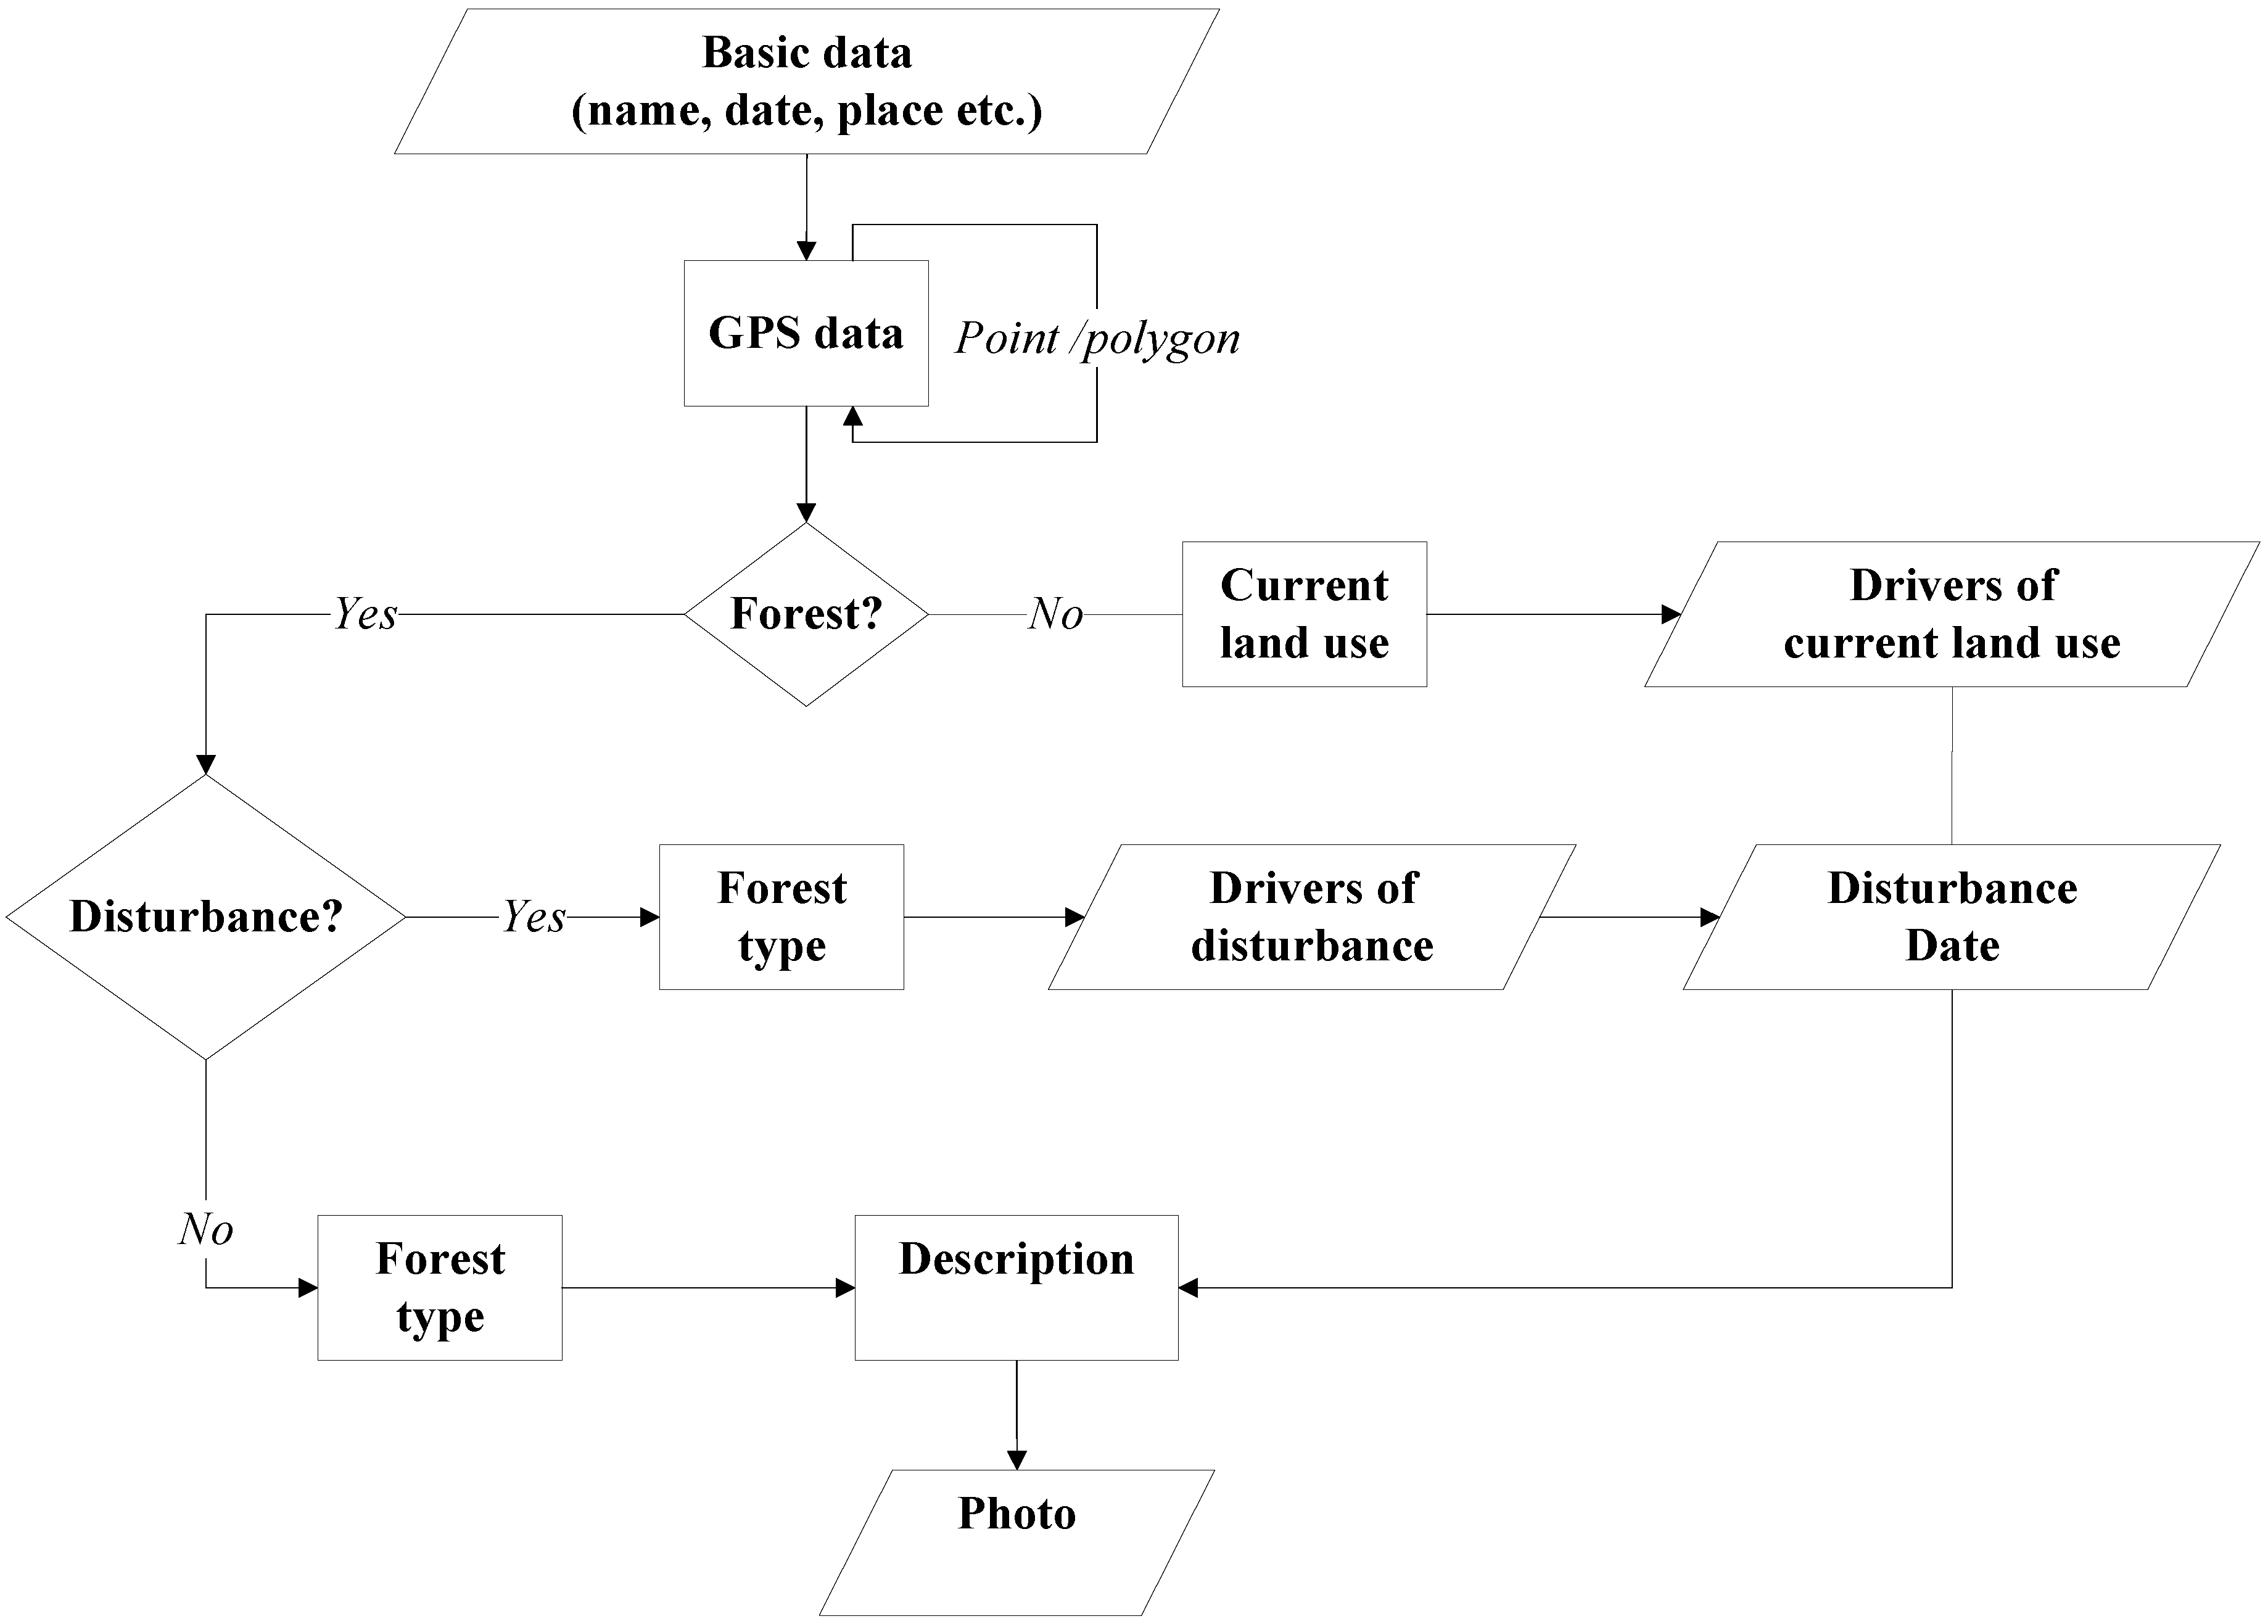
2.2. Description of the Forest Monitoring System in the Kafa Biosphere Reserve

According to REDD+ monitoring and implementation guidelines, it is important to involve local community groups and indigenous societies to carry out forest monitoring, in particular if there is any prospect of payment and credits for environmental services [6,31,37]. A variety of practical experiences from developing countries, such as Nepal, Tanzania, Cameroon, India, Mexico, Indonesia, China, Laos, Cambodia and Vietnam, have demonstrated that local communities can play an essential role in forest monitoring and management programs [7,26,27,28,29,38]. However, most of these experiences are limited to carbon stock measurements in support of REDD+ MRV, with few prescribed field methods for establishing activity monitoring (forest change) on the ground [24,29]. In this study, we present a ground-based system to monitor activity data because of their increasing importance in the context of REDD+. The following setup was designed to contribute an efficient and continuous forest monitoring system for the Kafa Biosphere Reserve.
Selection of local experts: Selection and recruitment of local experts acts as the backbone for a forest monitoring system, as the success of these CBM systems largely depends on the knowledge, commitment, feeling of ownership and competencies of these individuals [39]. The selection process featured in this study is based on a scheme of collaborative design of monitoring with external interpretation of the data, one of five schemes of local involvement in monitoring proposed by Danielson et al. [40]. A total of 30 local experts were recruited within the frame of the project called “Climate Protection and Primary Forest Preservation—A Management Model using the Wild Coffee Forests in Ethiopia as an Example” under the Nature and Biodiversity Conservation Union (NABU). The recruitment was done through the Kafa Zone Bureau of Agriculture and Rural Development (BoARD). The selection was done in such a way that it represents on average three experts from each of the 10 woredas (administrative units in Ethiopia). All chosen local experts had at least a secondary level of education and some fundamental understanding of forest management. This selection procedure was seen as a step towards greater community involvement in monitoring activities with the representatives involved from all woredas, assuring the potential for significant enhancement of the monitoring capacity of the project. Apart from monitoring, these experts also bear responsibilities for other project activities, such as the development of ecotourism, reforestation, community plantations, the distribution of energy saving stoves and awareness raising for the sustainable use of forest resources (e.g., honey and wild coffee).
Data acquisition: Two methods of data acquisition were implemented and tested in this study. In the first method, paper-based forest disturbance forms with GPS devices were used by local experts to acquire forest monitoring data. The data collection forms were designed primarily with project monitoring objectives in mind, but also were compliant with REDD+ MRV requirements. This form focused on capturing forest changes, including small-scale forest degradation, deforestation and reforestation. In the second method, mobile devices with integrated GPS and camera functionality were used to increase the ease and simplicity in collection, entering and managing locally acquired data. For this purpose, a decision-based data collection form (Figure 2) was designed in XML and was deployed on mobile devices using the Open Data Kit (ODK) Collect application [41]. This form contains optional input constraints, flows that depend on previous input, icon-based user-friendly graphics and local language support. Mobile devices stored the data asynchronously and transferred data to data servers over GPRS, Wi-Fi or USB, as connectivity was available. An online database management system based on ODK Aggregate, postgreSQL and PhP was designed for the proper storage, analysis and visualization of the acquired data. Further details of the adopted proposed data acquisition method can be found in Pratihast et al. [29]. A paper-based data acquisition system was used in 2012, whereas mobile devices were used to collect the data in 2013. Even though the tools used to acquire data were different, the overall form of the design was consistent, with a few key differences in terms of multimedia features.
Training and capacity building program: user friendly training materials were produced for the developed technology and data collection methodology. A series of training events was conducted before and during the implementation of the monitoring activities. The main purpose of training was to enhance the capacity of local experts and to develop approaches and strategies for program implementation.
Figure 2. Decision-based data acquisition form for local experts; the questions that are posed in the forms depend on answers given to preceding questions; such a design ensures that the questions are relevant to the land cover change being described.
Forests 05 02464 g002

2.3. Reference Datasets

Local experts are capable of reporting forest change process at a high temporal frequency. Finding suitable reference data that can thoroughly assess the spatial, temporal and thematic accuracy of these data is difficult, however. In this study, two types of accurate reference datasets were acquired to evaluate the accuracy of these local expert data: field-based reference dataset (FRD) and remote sensing (RS).
Field-based reference dataset (FRD): we conducted a field visit in order to validate the ground data collected by local experts. Due to cost constraints, it was not possible to visit all locations reported by local experts. We selected six accessible woredas owing to practical considerations. These woredas contain more than 65% of the local expert data. Within these woredas, 140 locations (Figure 1) were randomly selected and were revisited during November–December, 2013, by a team of professionals. The decision-based data acquisition form on the mobile devices (Figure 2) was used by the team of professionals to measure location, size, time, drivers and photographs of change events.
Remote sensing (RS): a time series of high resolution remote sensing images acquired between 2005 and 2013 (including pan-sharpened SPOT and RapidEye images) were available for the analysis of reference data (Table 1) in the study area (Figure 1, Appendix Table A1). The SPOT 4 and SPOT 5 imagery have a ground resolution of 10 m and 2.5 m, respectively, whereas RapidEye has a ground resolution of 6.5 m. Locally-reported forest monitoring locations were visually interpreted based on an approach described by Pohl and Van Genderen [42]. Following this approach, images were systematically examined and pixels representing forest change areas were manually digitized as polygons. The forest change areas were estimated by calculating the polygon area.
Table 1. Summary of the SPOT and RapidEye scenes used in this study.
SensorGround resolutionYear of acquisitionNumber of scenes
SPOT 410 m2005–20066
SPOT 52.5 m
(Pan sharpened image)
2007–20118
RapidEye6.5 m2012–201327

2.4. Accuracy Assessment

Several metrics have been proposed by researchers to describe the quality of geographic data [43,44,45]. However, no specific list of elements with a consistent definition has yet been agreed upon. The latest attempt to standardize data quality elements is ISO 19113 in 2002 [46], which proposes the following five elements: completeness, logical consistency, positional accuracy, temporal accuracy and thematic accuracy. In this study, we limited the quality assessment to three of these major categories, namely spatial, temporal and thematic accuracy, since these are essential aspects of forest monitoring datasets [8]. The details of the accuracy measures employed in this study are listed in Table 2.
Table 2. Specific approaches used to assess the spatial, temporal and thematic accuracy of local expert data.
CategoryMeasured variable local expert dataReference dataMeasures of accuracy
Spatial AccuracyLocation variables (Qualitative)Field basedConfidence interval (95%)
GPS accuracy
Size of forest change
Temporal AccuracyTime of changeRemote sensingTime lag
Thematic AccuracyPresence of forestField basedError matrix
Forest change type
Driver of forest change

2.4.1. Spatial Accuracy

In this study, three aspects of the spatial accuracy of the local experts’ data were assessed, including categorical location information, GPS location information and the estimated size of forest change. The categorical location information included categories for representing the administrative units, like woreda, kebele (administrative sub-unit of a woreda) and a spatial category representing distance to core forest, nearest village and roads (i.e., less than 1 km, 1–2 km, 2–3 km and more than 3 km). To estimate the accuracy of these responses, comparisons were made between the local expert data and the FRD. From this sample, the fraction of correct observations in the total population of local expert reports was estimated using the hypergeometric distribution [47], a discrete probability distribution that describes the probability of obtaining a correct response from a finite population size without replacement. The 95% confidence interval was calculated by using the 0.025 and 0.975 quantiles of this distribution.
In addition to the categorical location descriptors, local experts provided GPS readings for each report. Each reading was associated with a measurement error reported by the GPS receiver. The GPS measurement errors in the local expert dataset were compared with measurement errors in the FRD using a t-distribution [47]. Using this distribution, the mean bias (with 95% confidence interval) and the standard deviation between the local expert and FRD GPS errors were calculated.
Finally, the size of forest change polygons mapped by local experts were compared with change polygons digitized from visually interpreted high resolution SPOT and orthorectified RapidEye time series imagery. Forty deforestation polygons falling within the spatial extent of the SPOT and RapidEye time series were selected. The relationship between the size of field-delineated change areas and polygons digitized from high-resolution imagery was evaluated using a t-distribution.

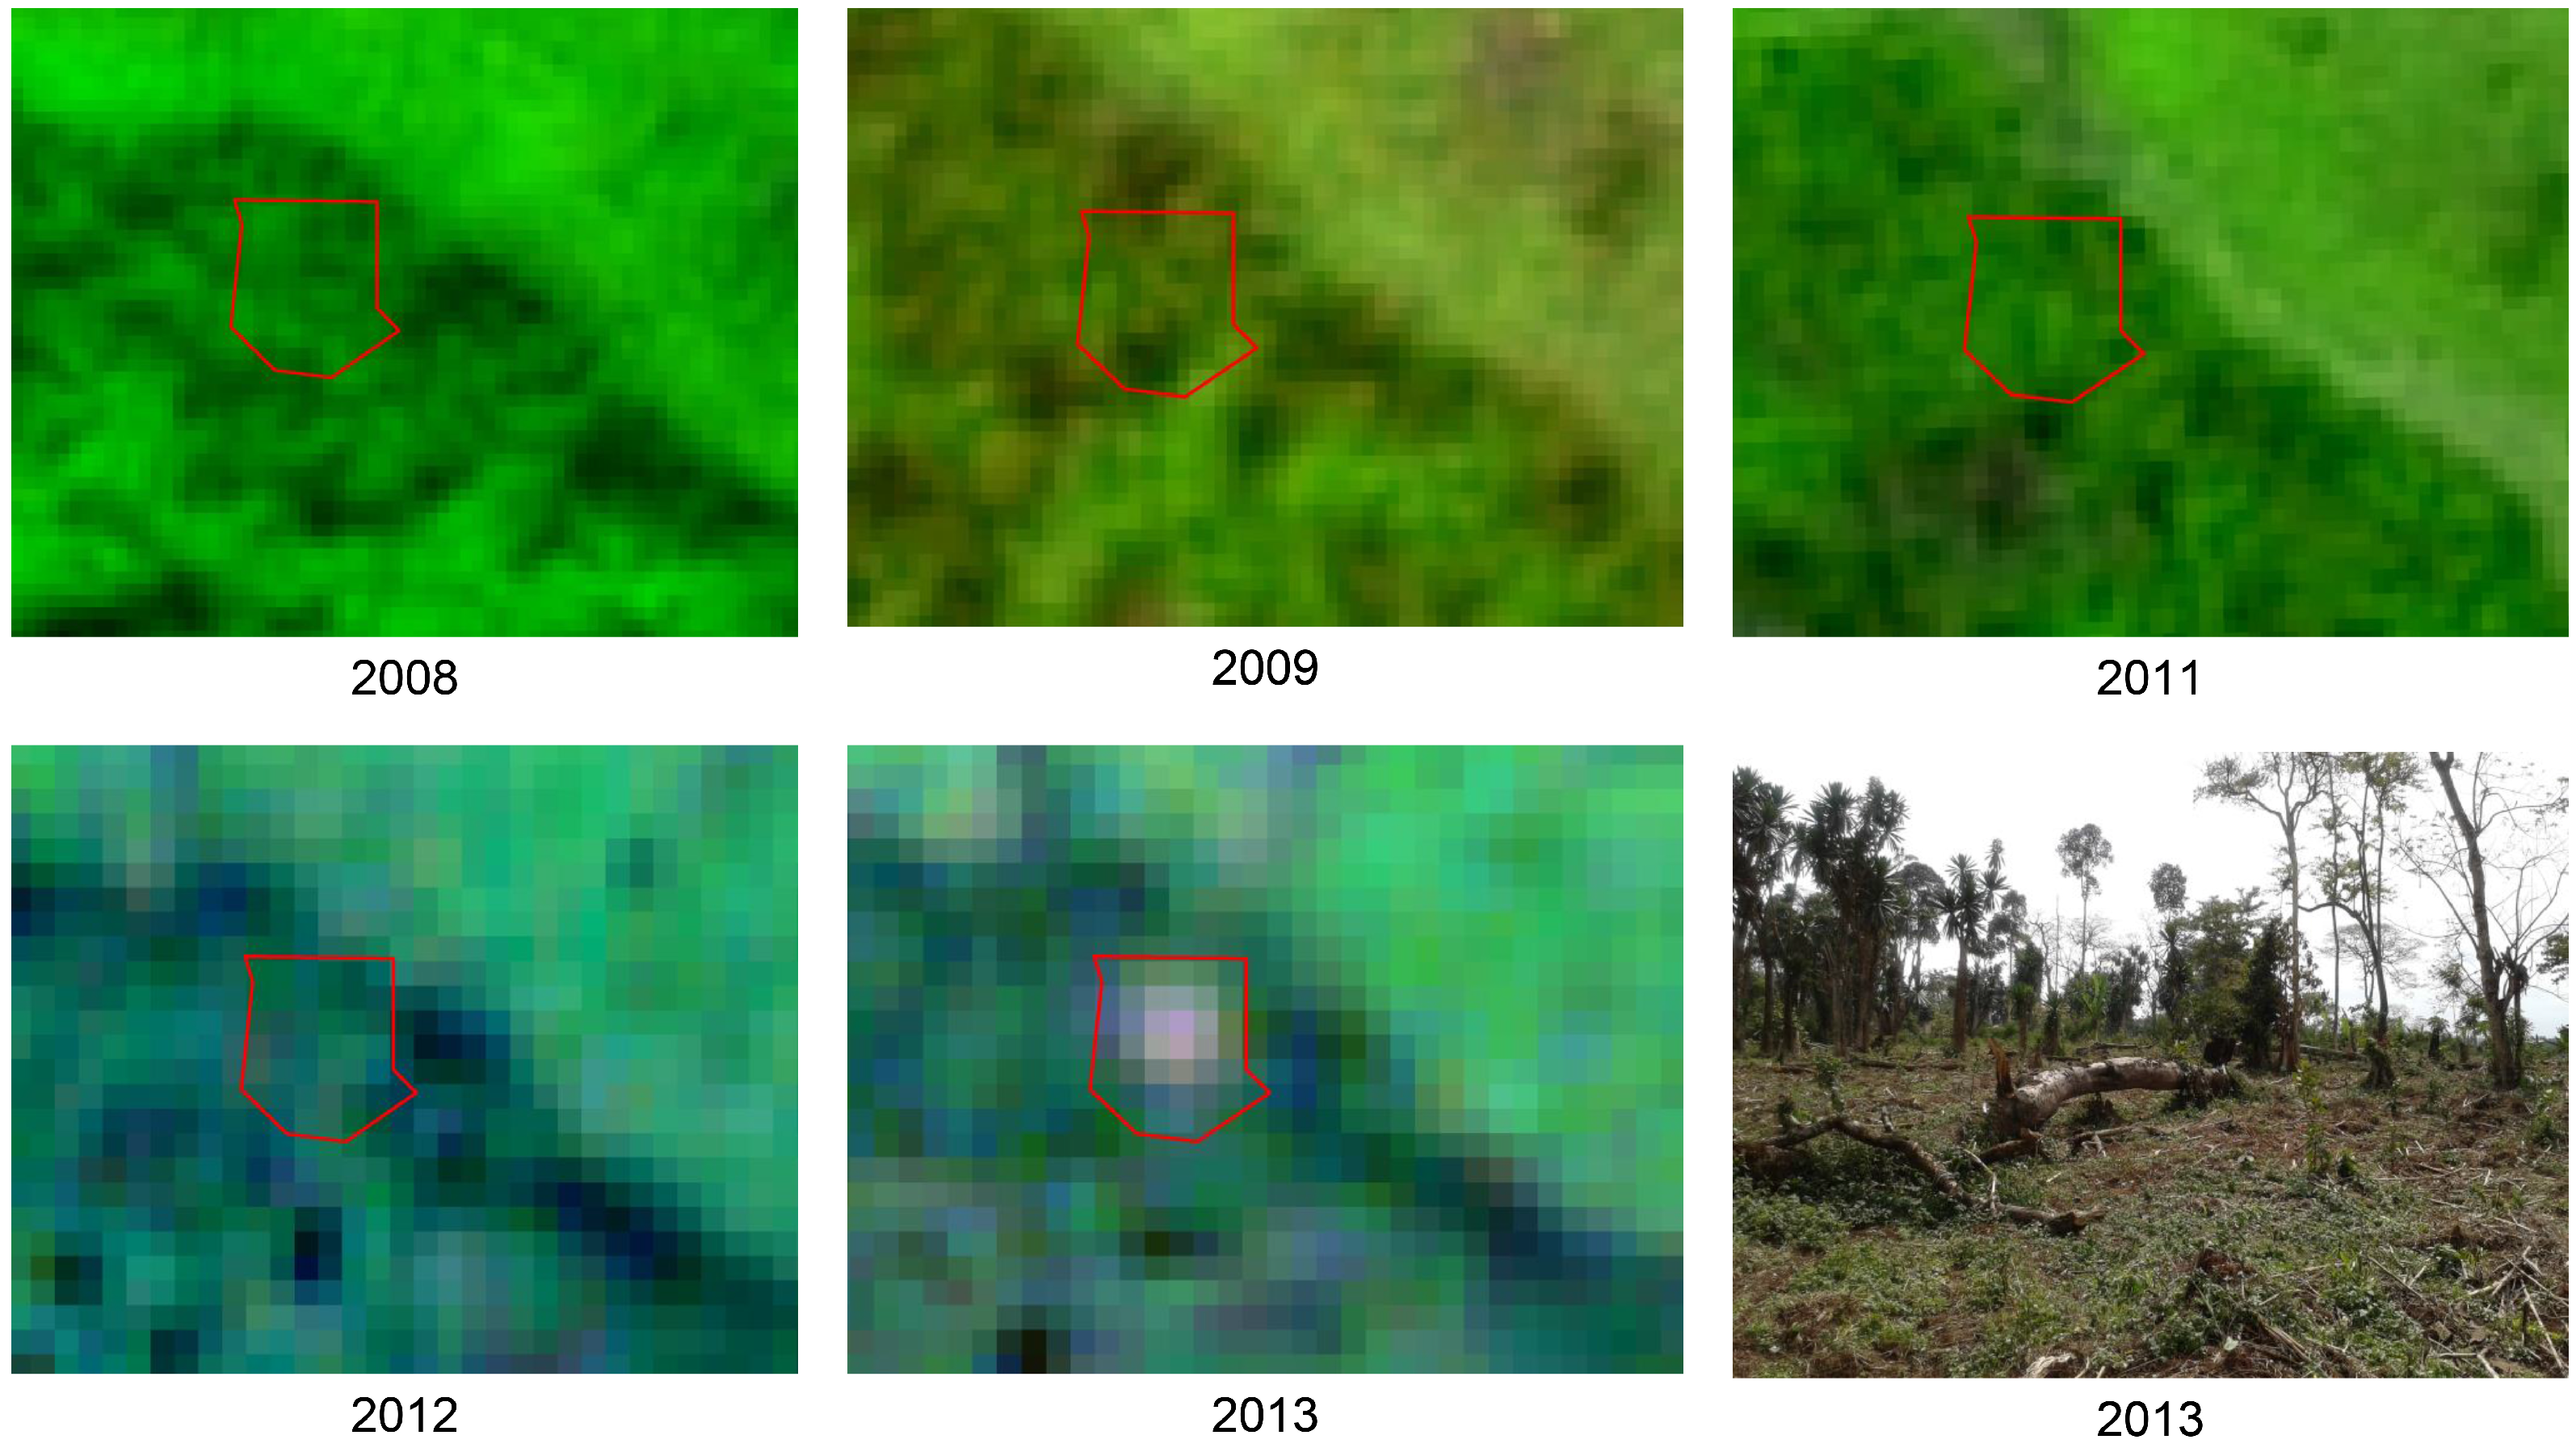
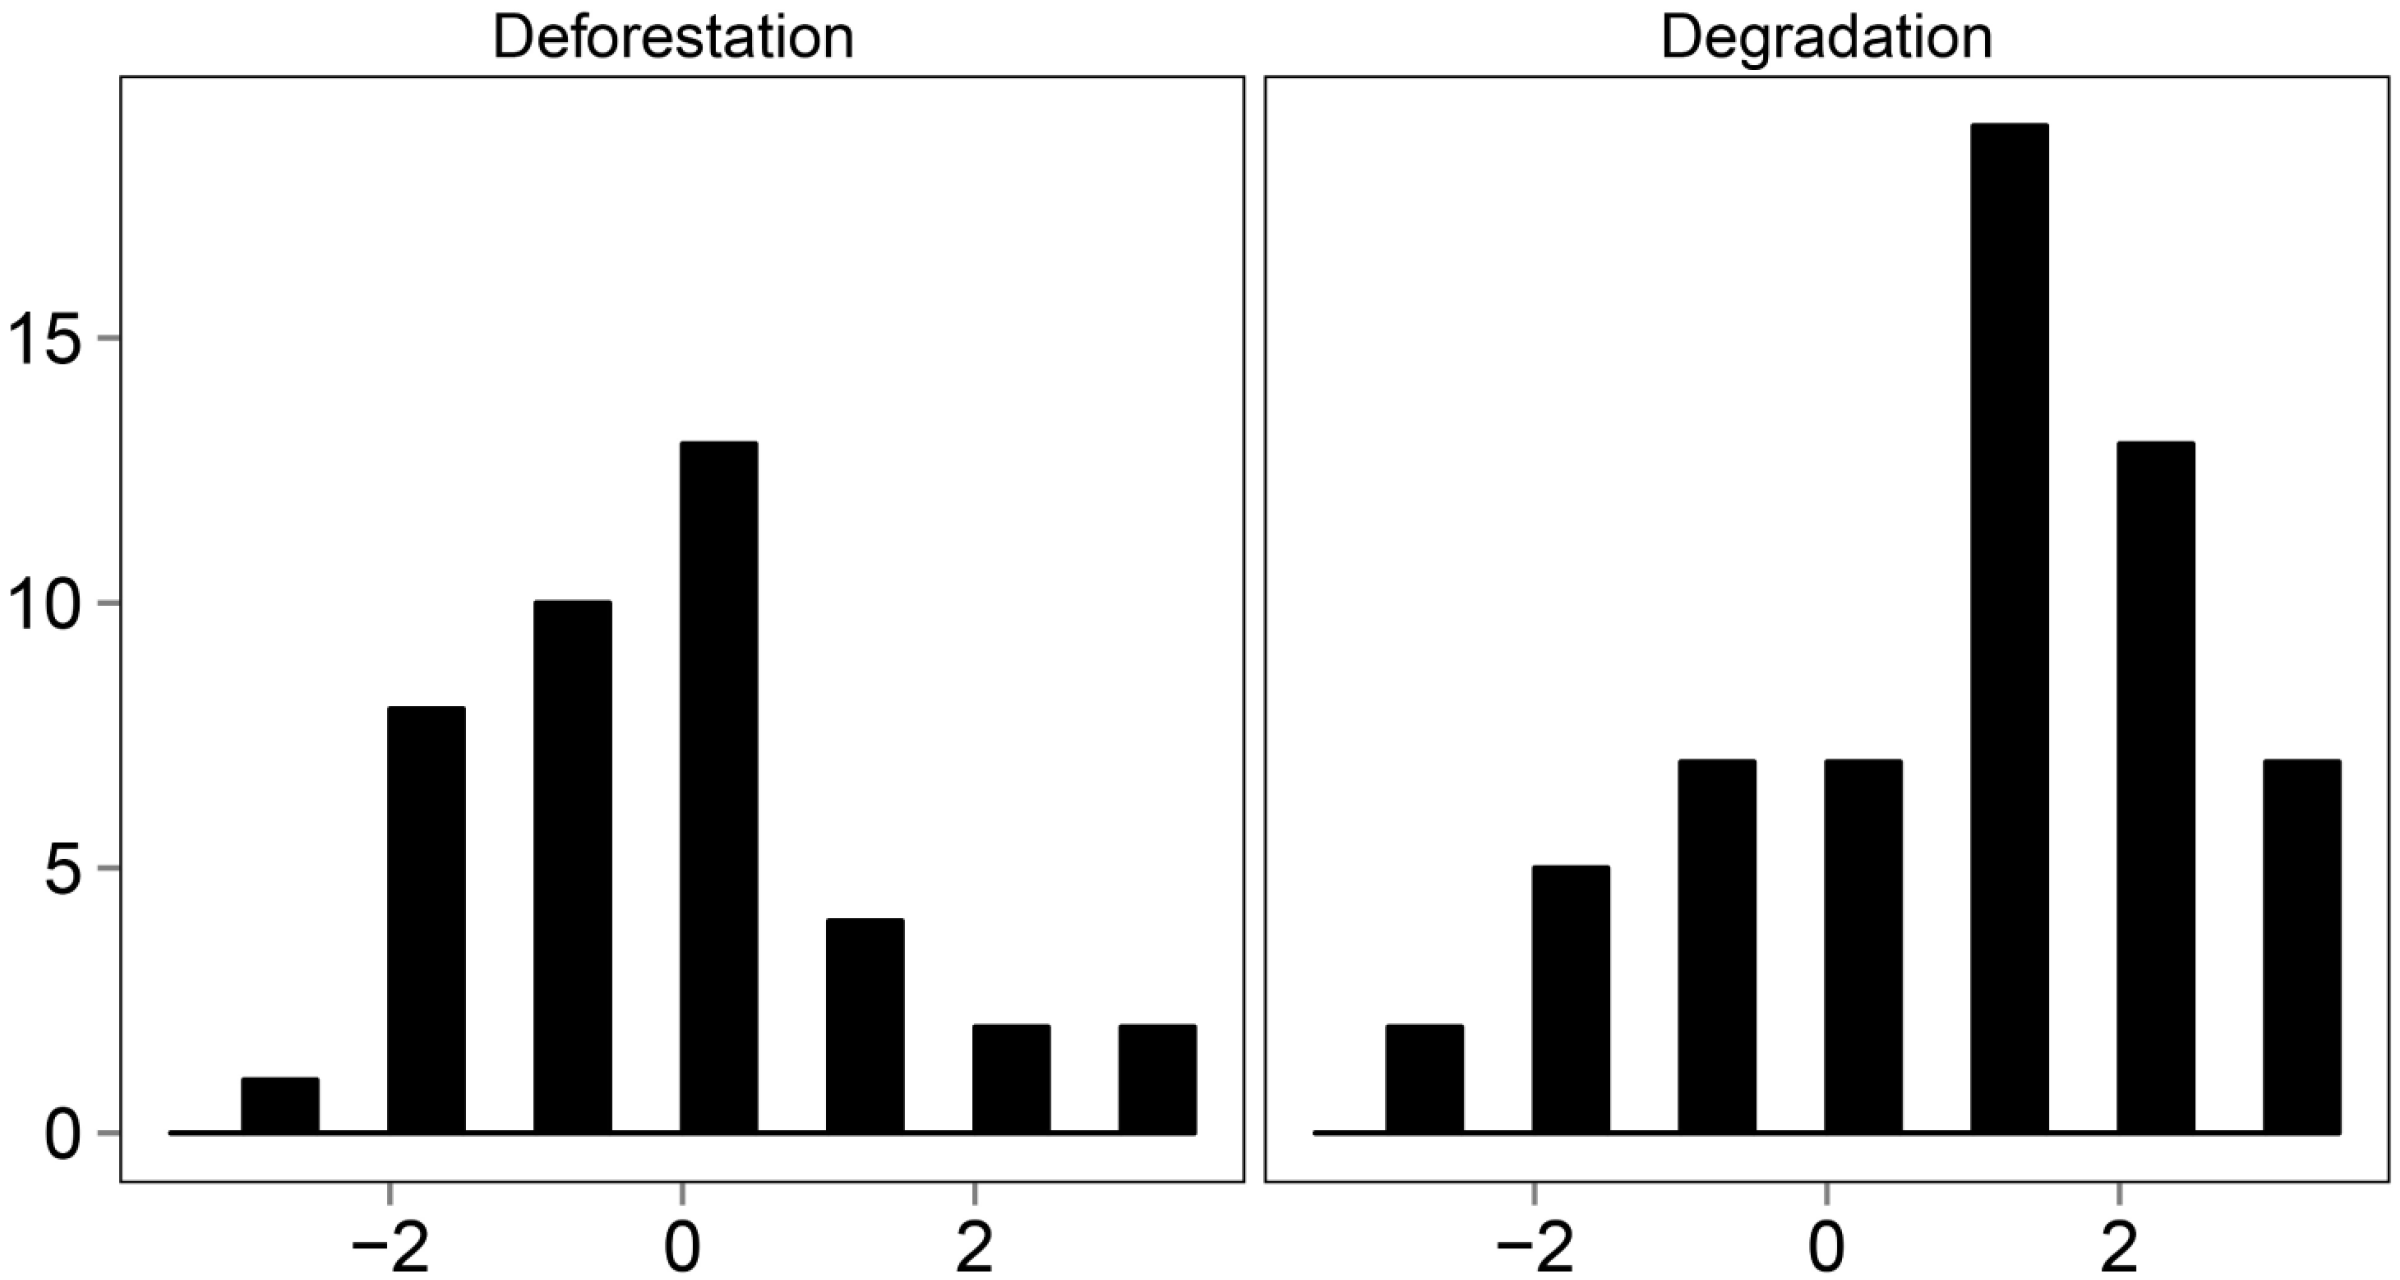
2.4.2. Temporal Accuracy

Recording the timing of forest change is essential for the implementation of a robust forest monitoring system. Assessing the temporal accuracy of local monitoring data remains a challenge due to a lack of reference time series imagery of sufficient temporal density and spatial resolution that can describe disturbances in near real-time [48,49]. To overcome this limitation, only the area for which time series images of SPOT and RapidEye were available (Table 1) was used for this analysis. Here, a visual interpretation of the time series of satellite images for each local data set was carried out, and the time of forest disturbance was estimated for each data set. Furthermore, a temporal lag between the reference satellite datasets and local expert datasets was calculated to determine the average time delay or temporal lag of deforestation (Equation 1):
Temporal lag = Year of detection by remote sensing − Year of detection by local experts

2.4.3. Thematic Accuracy

Attributes, such as the presence or absence of forest, forest change type and drivers of forest change were included in the assessment of thematic accuracy. The accuracy of these variables was assessed by comparing local expert dataset with the field-based reference dataset. An error matrix was produced for each category and used to derive producer’s accuracy, user’s accuracy and the overall accuracy [50].

3. Results

3.1. Characteristics of Local Monitoring Data

3.1.1. Attributes of the Local Expert Monitoring Data

Local experts are capable of systematically monitoring forest change. In this study, we focused on deforestation and forest degradation processes to illustrate the major attributes of the data collected by local people (Figure 3, Table 3). The results show that local experts have documented forest change processes, which include spatial (location and size), temporal (time of change events) and thematic (type of change, driver of change and photograph from the North, East, West and South directions) information. Furthermore, deforestation, the conversion from forest to non-forest land [8], and forest degradation, negative changes in forest biomass without conversion to another land cover type, could be mapped separately using data provided by local experts (Figure 3). In this case, local experts tried to delineate exact deforestation areas from the ground by recording multiple GPS location around the boundary (Figure 3a). On the other hand, forest degradation is a gradual process without a fixed boundary [8] and could therefore not be mapped with such precision. In such cases, local experts provided the central location and approximate area affected rather than an exact change polygon (Figure 3b).

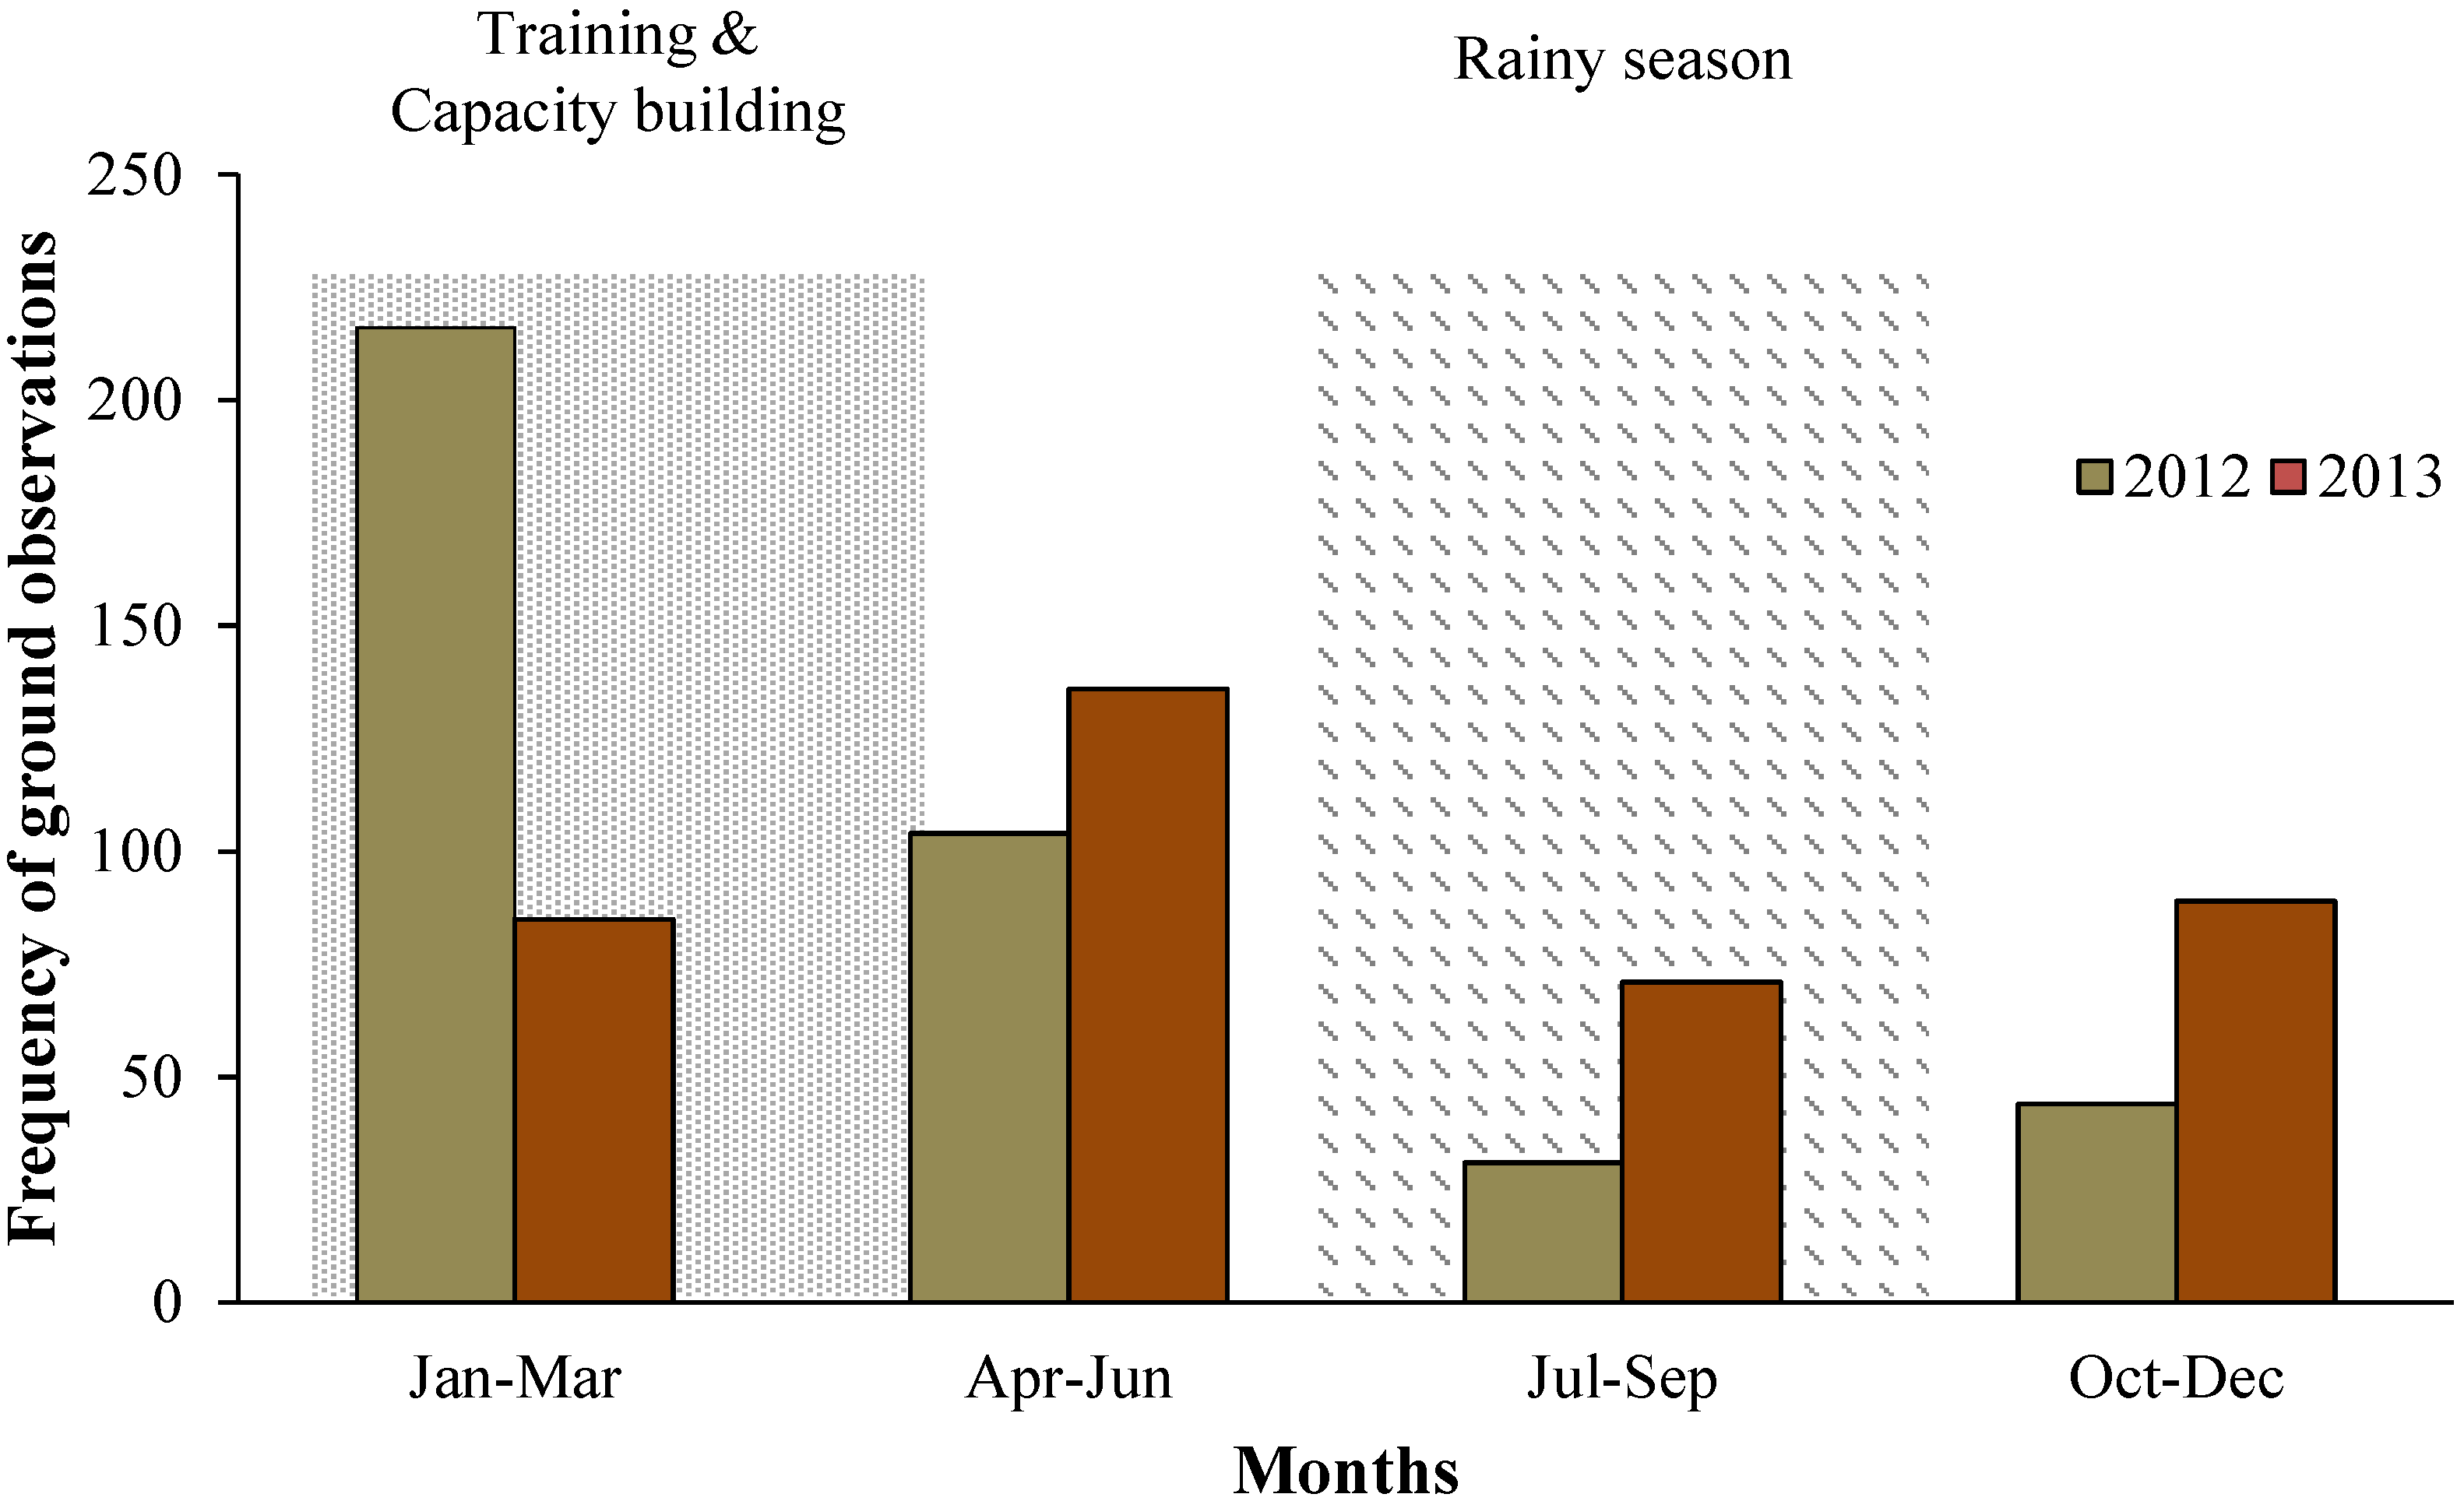
3.1.2. Monitoring Frequency

During the period of January, 2012, to December, 2013, a total of 755 locations were observed (Figure 4). Of these, 46% were labelled as forest degradation, 25% as deforestation and 30% as reforestation. All data in 2012 were acquired using paper forms with hand-held GPS devices, whereas in 2013, data were acquired using mobile devices. In general, local observations were spread equally over the whole Biosphere Reserve (Figure 1). However, monitoring efforts were not consistent throughout the year (Figure 4). Irregularities in monitoring activities were influenced by a wide range of factors, including the timing of training and capacity building programs and adverse weather conditions. The number of received monitoring forms (in 2012) and digital observations (in 2013) increased during training and capacity building program (January to March), while it decreased during the rainy season (July to September).

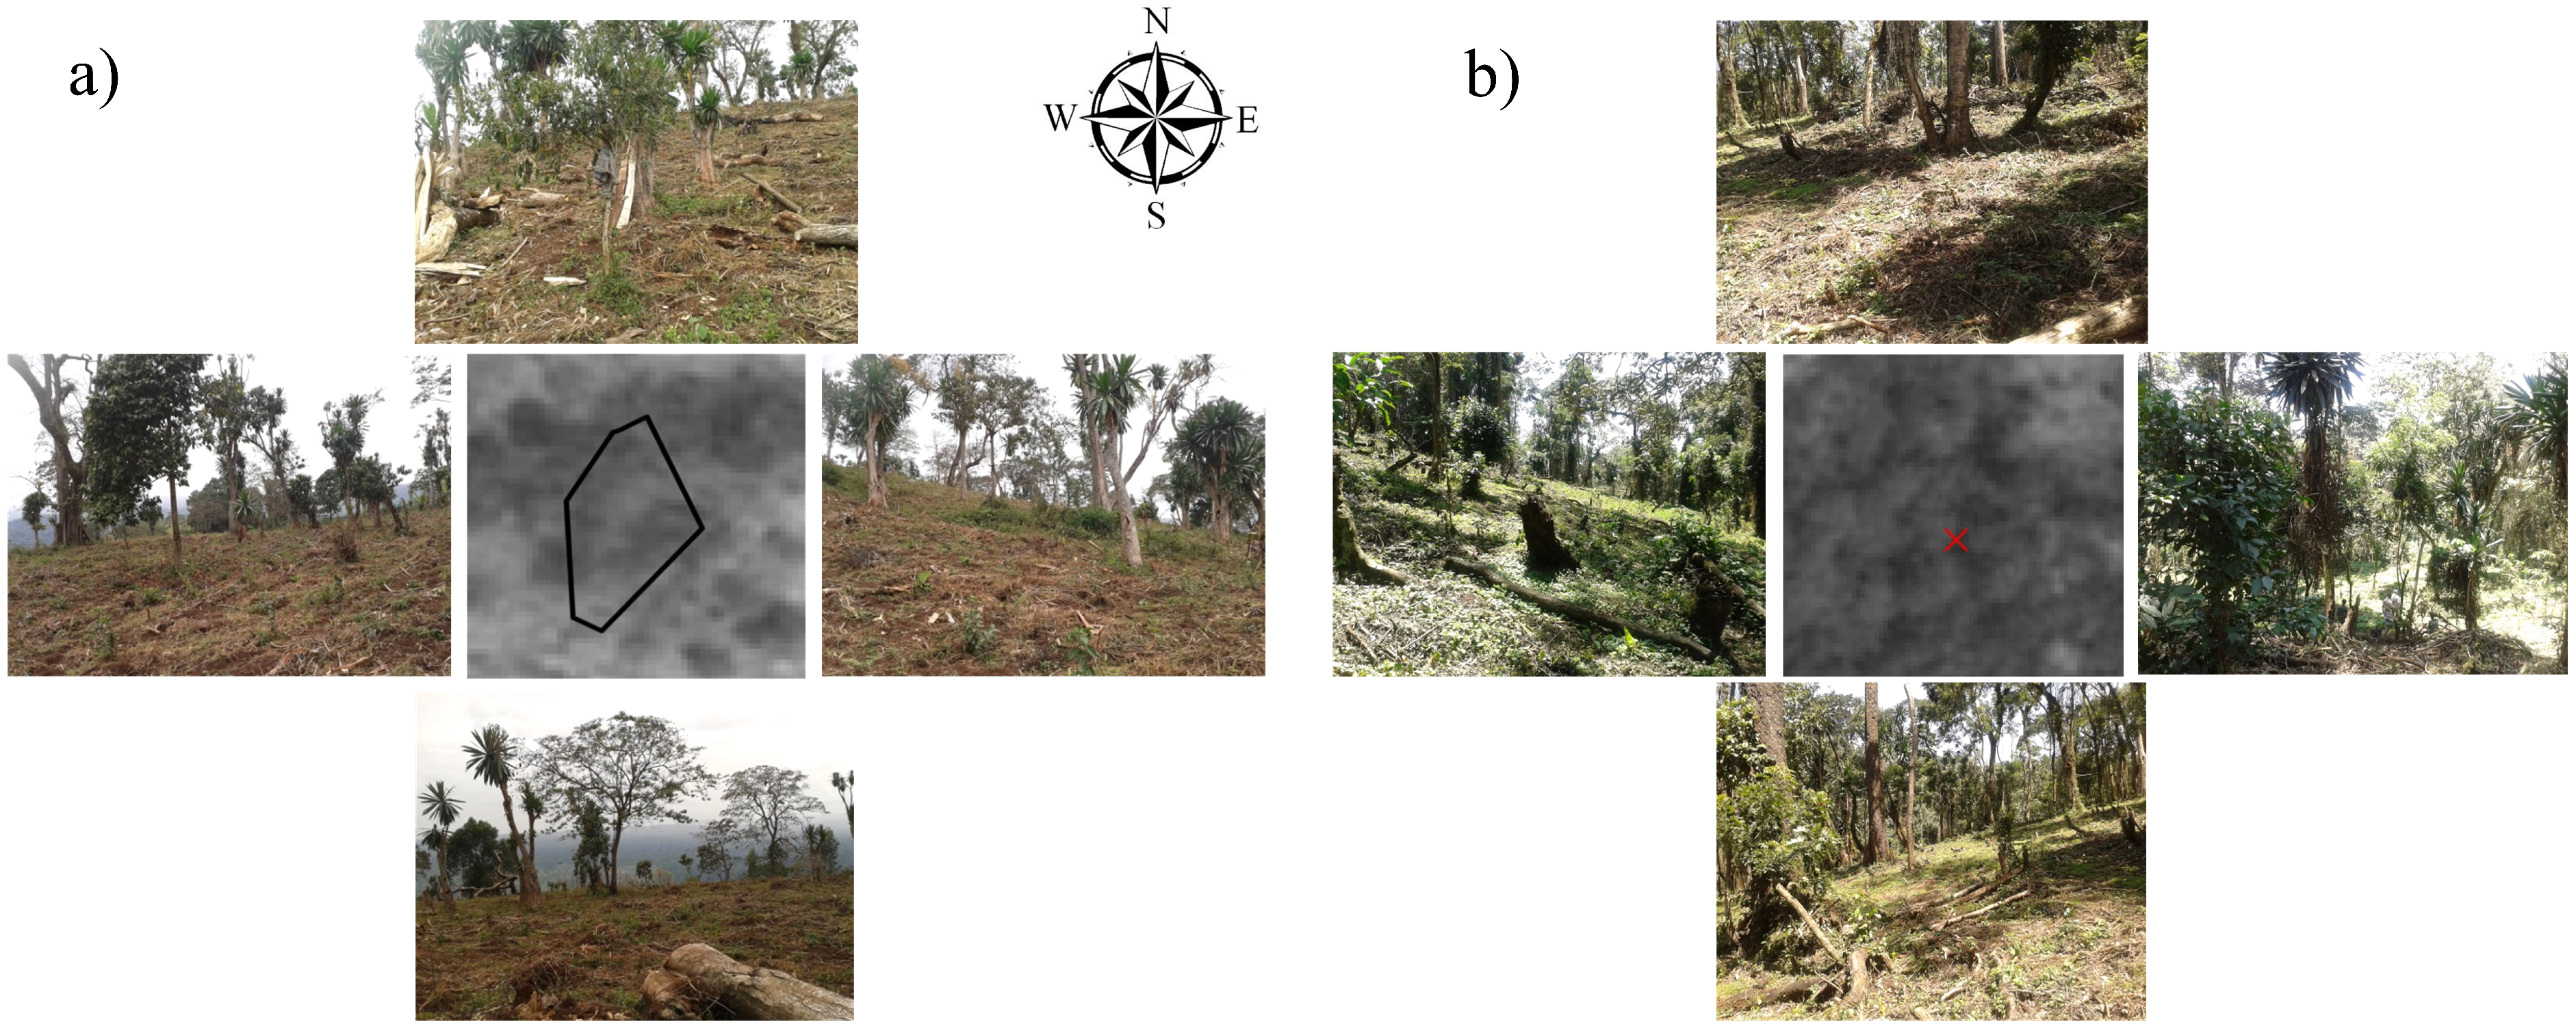
3.1.3. Drivers of Forest Change

Drivers of forest change were mostly associated with agriculture expansion and settlement expansion, followed by charcoal and firewood extraction, intensive coffee cultivation, timber harvesting and natural disasters, which mainly included landslides erosion and windfall. Many of the drivers were found to co-occur at a single location (Table 4). In the case of agricultural expansion, 34 of the events were attributed to agriculture expansion alone, whereas 185 events were attributed to agriculture expansion together with charcoal and fire wood collection, and 61 of those changes were found to be due to the co-occurrence of agriculture expansion and timber harvesting. This observation is logical considering that agriculture expansion in Kafa Biosphere Reserves is in fact a gradual process coupled with forest degradation. After demarcation of a portion of forest area for agricultural development, a farmer commonly keeps much of the forest for the first couple of years to harvest coffee, spices, fuel wood, charcoal and timber, before the forest is fully cleared to make way for agricultural activities.
Figure 3. Examples of (a) deforestation monitoring and (b) forest degradation monitoring by local experts; observations were mapped either as polygons (a) or point (b) features, depending on the process being described; each form was accompanied by four photos representing the north, east, south and west perspectives; the attribute tables associated with these observations are shown in Table 3.
Forests 05 02464 g003
Table 3. Attribute tables derived from local expert observations of deforestation and forest degradation (shown in Figure 3a,b, respectively).
CategoryMeasured VariablesValue of Deforestation (Figure 3a)Value of Forest Degradation (Figure 3b)
SpatialWoredaGawataGawata
KebeleGantyOna
Distance to roadMore than 3 km1–2 km
Distance to nearest village1–2 km1–2 km
Distance to core forestMore than 3 kmMore than 3 km
GPS coordinates (latitude, longitude)7.53, 35.847.54, 35.81
TemporalDisturbance date03-18-201303-18-2005
ThematicDisturbance typeDeforestationForest degradation
Driver of disturbanceAgriculture expansion, timber harvesting and firewoodCoffee cultivation, timber harvesting and firewood
Size of disturbance2 ha4 ha
Figure 4. Number of observations collected by local experts in 2012 and 2013; all observations in 2012 were acquired using an analogue (paper-based) system, whereas observations acquired in 2013 were collected using either analogue or digital (smart phone-based) methods.
Forests 05 02464 g004
Table 4. Number of instances of the co-occurrence of forest change drivers. Numbers along the diagonal indicate the number of instances that a particular driver was reported alone.
Number of occurrencesForest change drivers
Agriculture expansionSettlement expansionCharcoal and fire woodIntensive coffee cultivationTimber harvestingNatural disaster
Agriculture expansion34
Settlement expansion4842
Charcoal and fire wood1127557
Intensive coffee cultivation0557619
Timber harvesting6170441015
Natural disaster13172122
Total26825917930172

3.2. Results on Accuracy Assessment

3.2.1. Spatial Accuracy

A breakdown of the estimated fraction correct of assigned spatial categories with a 95% confidence interval is shown in Table 5. The spatial accuracy varied considerably across the various spatial categories included in the monitoring forms. The woreda was recorded with the highest mean fraction correct of 0.92, whereas the estimated distance to core forest was found to have the lowest mean fraction correct of 0.71.
Table 5. Fraction correct of local data assignment to spatial categories.
Spatial categoryFraction correct
MeanConfidence interval (95%)
Woreda0.920.88 to 0.96
Kebele0.780.72 to 0.84
Distance nearest village0.770.71 to 0.83
Distance nearest road0.750.68 to 0.81
Distance to core forest0.710.64 to 0.77
A comparison of GPS errors reported by local experts with those reported in the FRD showed a slight systematic error of 0.65 m between the two datasets (Table 6). A similarly slight bias was found between forest change areas as reported by the local experts and forest change areas derived from high resolution remote sensing imagery, in cases where these areas did not exceed 2 ha (Table 6). In larger change areas (exceeding 2 ha), however, the absolute bias increased to 1.06, implying that local experts had systematically underestimated the area of large change polygons.
Table 6. Positional accuracy of local expert data.
MeasureMean biasStandard deviationConfidence interval for mean bias (95%)
GPS error (m)0.651.790.62 to 0.68
Size of forest change (ha); polygons <2 ha0.160.290.13 to 0.20
Size of forest change (ha); polygons >2 ha−1.061.26−1.28 to −0.85

3.2.2. Temporal Accuracy

Each forest change event was recorded by local experts with a time stamp that represents the time at which the process of change took place. In total, 40 deforestation and 60 degradation locations were visually assessed from high resolution remote sensing (SPOT and RapidEye) imagery. An example of the visual interpretation of high resolution time series of SPOT5 (2008–2010) and RapidEye imagery (2012–2013) is shown in Figure 5. The locally mapped polygon is displayed at the center of each subset of image. The interpretation shows that the forest cover was significantly reduced after 2012.
The histogram of the temporal accuracy of locally determined change dates compared to high resolution imagery for deforestation and forest degradation is shown in Figure 6. Here, a positive temporal lag indicates that local experts indicated a change date earlier than that determined using remote sensing data, and a negative time lag indicates the reverse situation. The results reveal that 33% of deforestation events reported by local experts corresponded accurately to the dates observed in the remote sensing data. In other cases, 25% and 20% of total deforestation events as observed from remote sensing were detected one and two years earlier than the local reported time, respectively (Figure 6). On the other hand, the comparison of dates associated with forest degradation as reported by local experts shows that the majority of these signals were recorded one (32%) to two (22%) years earlier than dates detected by remote sensing.
Figure 5. Example of visual interpretation to assess the temporal accuracy of the local expert dataset; the image subset is based on SPOT5 data from 2008 to 2011 (red = Band 3, green = Band 1, blue = Band 2) and two RapidEye images from 2012 and 2013 (red = Band 3, green = Band 2, blue = Band 1); a ground photograph taken by a local expert in 2013 is also shown; the red polygon is the forest change mapped by a local expert; the forest change occurred between 2012 and 2013.
Forests 05 02464 g005
Figure 6. Histogram of time lags in capturing deforestation (left) and forest degradation by remote sensing (SPOT and RapidEye) imagery (right); a time lag is defined as the difference between change dates observed from remote sensing image interpretation and those dates recorded by local experts.
Forests 05 02464 g006

3.2.3. Thematic Accuracy

Thematic information is one of the added values of the local expert dataset compared to remote sensing. Summaries of the accuracy assessment of three thematic elements (the presence of forest, forest change type and drivers of forest change) are shown in Table 7.
Table 7. Accuracy assessment of local expert data compared to field-based reference dataset in the thematic domain.
ElementsUser accuracyProducer accuracyOverall accuracy
Presence of forest93%92%94%
Forest change type83%84%83%
Driver of forest change71%68%69%
The results show an overall accuracy of 82% for thematic elements compared to the field-based reference dataset. The presence of forest was found to have a producer’s accuracy of 92%, a user’s accuracy of 93% and an overall accuracy of 94%. The drivers of forest change had a comparatively lower producer’s accuracy of 71%, a user’s accuracy of 68% and an overall accuracy of 69%.

4. Discussion

4.1. Local Expert-Based Forest Monitoring System

The establishment of robust and reliable NFMS in developing countries is an expensive and challenging task. Several studies have shown that CBM has the potential to increase the saliency, credibility and legitimacy of such forest monitoring systems [7,26,27,28,30,51]. However, current studies do not clearly describe the following aspects of forest change monitoring (related to activity data): (1) the long-term operational procedures of community involvement; (2) technology selection; (3) consistency of local datasets; and (4) complementarity with remote sensing data. In this regard, we demonstrate an operational forest monitoring system that includes local expert activity monitoring data in the UNESCO Kafa Biosphere Reserve, Southern Nations, Nationalities and People’s Region (SNNPR), Ethiopia. In general, our monitoring setup allows local experts to collect forest change variables, such as geo-location, size of forest change, time of forest change and proximate drivers behind the change, in more detail. Similar to previous studies [29,52], we also found that the use of mobile devices has a clear advantage over a paper-based system in capturing photographs and multimedia information from the ground and improves the local capacity in data collection, transmission and visualization procedures (Figure 3 and Table 3). Furthermore, our results show that these datasets are fully structured in terms of spatial, temporal and thematic detail and capable of describing the forest change process well. While our results are based on a local case study, these monitoring activities have the potential to be scaled up to the national level and integrated with an NFMS.
The local expert-based forest monitoring system in this study faced some critical barriers, such as systematic coverage and consistency in monitoring frequency. Our results show that 53% of the local data were collected within 1 km of the local road network, hindering systematic coverage of the study area. This restriction is a result of poor road infrastructure or a lack of transportation means. A recent study in Southwestern Ethiopia has shown that most forest change occurs in remote locations far from urban areas [53], suggesting that much of these changes could not be fully captured by local experts alone. This mobility barrier could be overcome by engaging local communities who live near the forest areas of interest.
We also observed that the frequency of local data collection depends largely on weather conditions and motivations towards monitoring activities. A decrease in data acquisition was seen during the rainy season, indicating that weather has a significant impact on the mobility of local people. This reduction in data frequency may also be due to a decrease in disturbance activities by farmers during this time. The motivation can be triggered by providing local experts with adequate incentives for conducting monitoring activities even during adverse weather conditions and also providing them with the necessary accessories and travel means. Regular training and capacity building programs should also be conducted to keep the local experts updated. While such initiatives in motivating the local experts towards efficient monitoring may not fill the data gap completely, they could help to substantially increase the commitment and long-term engagement of local people towards monitoring.

4.2. Critical Review on the Accuracy of Local Datasets

In this study, we assessed the spatial, temporal and thematic accuracy of the local expert dataset. Identifying the factors influencing these accuracies is important to understanding the role that this dataset can play in a forest monitoring system. The main influencing factors are explained in detail below.

4.2.1. Spatial Accuracy

Spatial accuracy was influenced by three main factors: interpretation of administrative boundaries, GPS errors and failure to map full polygons. First, the administrative boundaries are not always visible on the ground. Local experts may incorrectly interpret these boundaries when they are away from their own villages. This error might be solved by providing base maps prepared by an Ethiopian mapping agency and regional governments during field work, which may contain the updated information regarding these administrative layers.
Second, GPS location error arises due to the weak signal caused by dense forests and high slopes. Mobile devices used in this study achieve maximum GPS accuracy by taking the average measurement from all available satellites reached in a given time. GPS accuracy could be improved by using averaging positional measurements over a longer period of time [54].
Third, the area of change estimated by local experts was found to be biased due to difficulties in mapping large change polygons in the field. When an insufficient number of polygon vertices was mapped by the local experts, resulting polygons were smaller than those delineated by visual interpretation from remote sensing imagery, giving rise to a negative bias in field-based area estimations. These errors could be avoided by implementing a visualization feature in the mobile device-based forms, whereby local experts can see the polygon they have mapped while in the field. Based on observed errors that arise in the mapping process, these can be corrected by the local experts.

4.2.2. Temporal Accuracy

To assess temporal accuracy of the local dataset, temporal lag was calculated based on forest disturbance dates determined using remote sensing time series data. The temporal lag in detecting deforestation and degradation (Figure 7) is not necessarily a direct result of inaccuracies in the local dataset, but rather highlights differences in the interpretation of change between ground-based and satellite-based methods in the case of deforestation and forest degradation.
Evidence from our study indicates that deforestation is detected earlier using higher resolution SPOT and RapidEye imagery compared to local expert observations. This time lag in deforestation detection is likely due to differences in the interpretation of change events. Since optical remote sensing observes changes in the canopy cover of forests, changes delineated by visual interpretation of remote sensing time series were directly related to land cover changes. Local experts, on the other hand, reported changes in land use (e.g., the conversion of forest land to agricultural land) [55]. The difference between the land cover and land use-based definition of deforestation is important in this case, because actual land use change typically follows several years of gradual canopy cover change. Whereas deforestation was understood by local experts to mean the conversion of forest land to cropland, changes in the canopy cover in the years preceding this change were often interpreted as land cover change (deforestation) by the remote sensing analyst, thus giving rise to the temporal lag observed in this study (Figure 6).
Interestingly, a reverse temporal lag was found in the case of forest degradation reported by local experts. Optical remote sensing data are known to have limitations with regards to the detection of low-level degradation, especially when driven by fuelwood collection [24], as was found in this study (Table 4). This low level degradation generally takes place underneath the forest canopy and is thus not detectable using remote sensing data until degradation rates are such that canopy openings begin to appear. For this reason, a delay in degradation detection by remote sensing was found in this study. In many cases, low-level degradation is not at all detectable with optical remote sensing data when degradation fails to result in canopy openings. In this case, local datasets convey a clear advantage when combined with remote sensing data to achieve a comprehensive description of the degradation processes.

4.2.3. Thematic Accuracy

While analysis of the thematic accuracy of the local experts’ dataset showed a high overall accuracy (82%), the drivers of forest change were reported with a relatively lower accuracy (69%). One possible explanation for this lower accuracy could be due to differences in perceiving the proximal drivers of forest change by local experts and the team of professionals who were involved in collecting FRD. Another explanation for this lower accuracy could be the complexity of multiple drivers and dynamic nature of land use changes, which make categorization of forest change drivers difficult. In the case of Ethiopia, multiple drivers, such as fuelwood extraction, grazing, timber harvesting and agriculture expansion, operate together, and choosing the most prominent driver for such a situation is difficult (Table 4). The reporting of drivers could be improved through improved form design (e.g., using simplified classes and iconography).

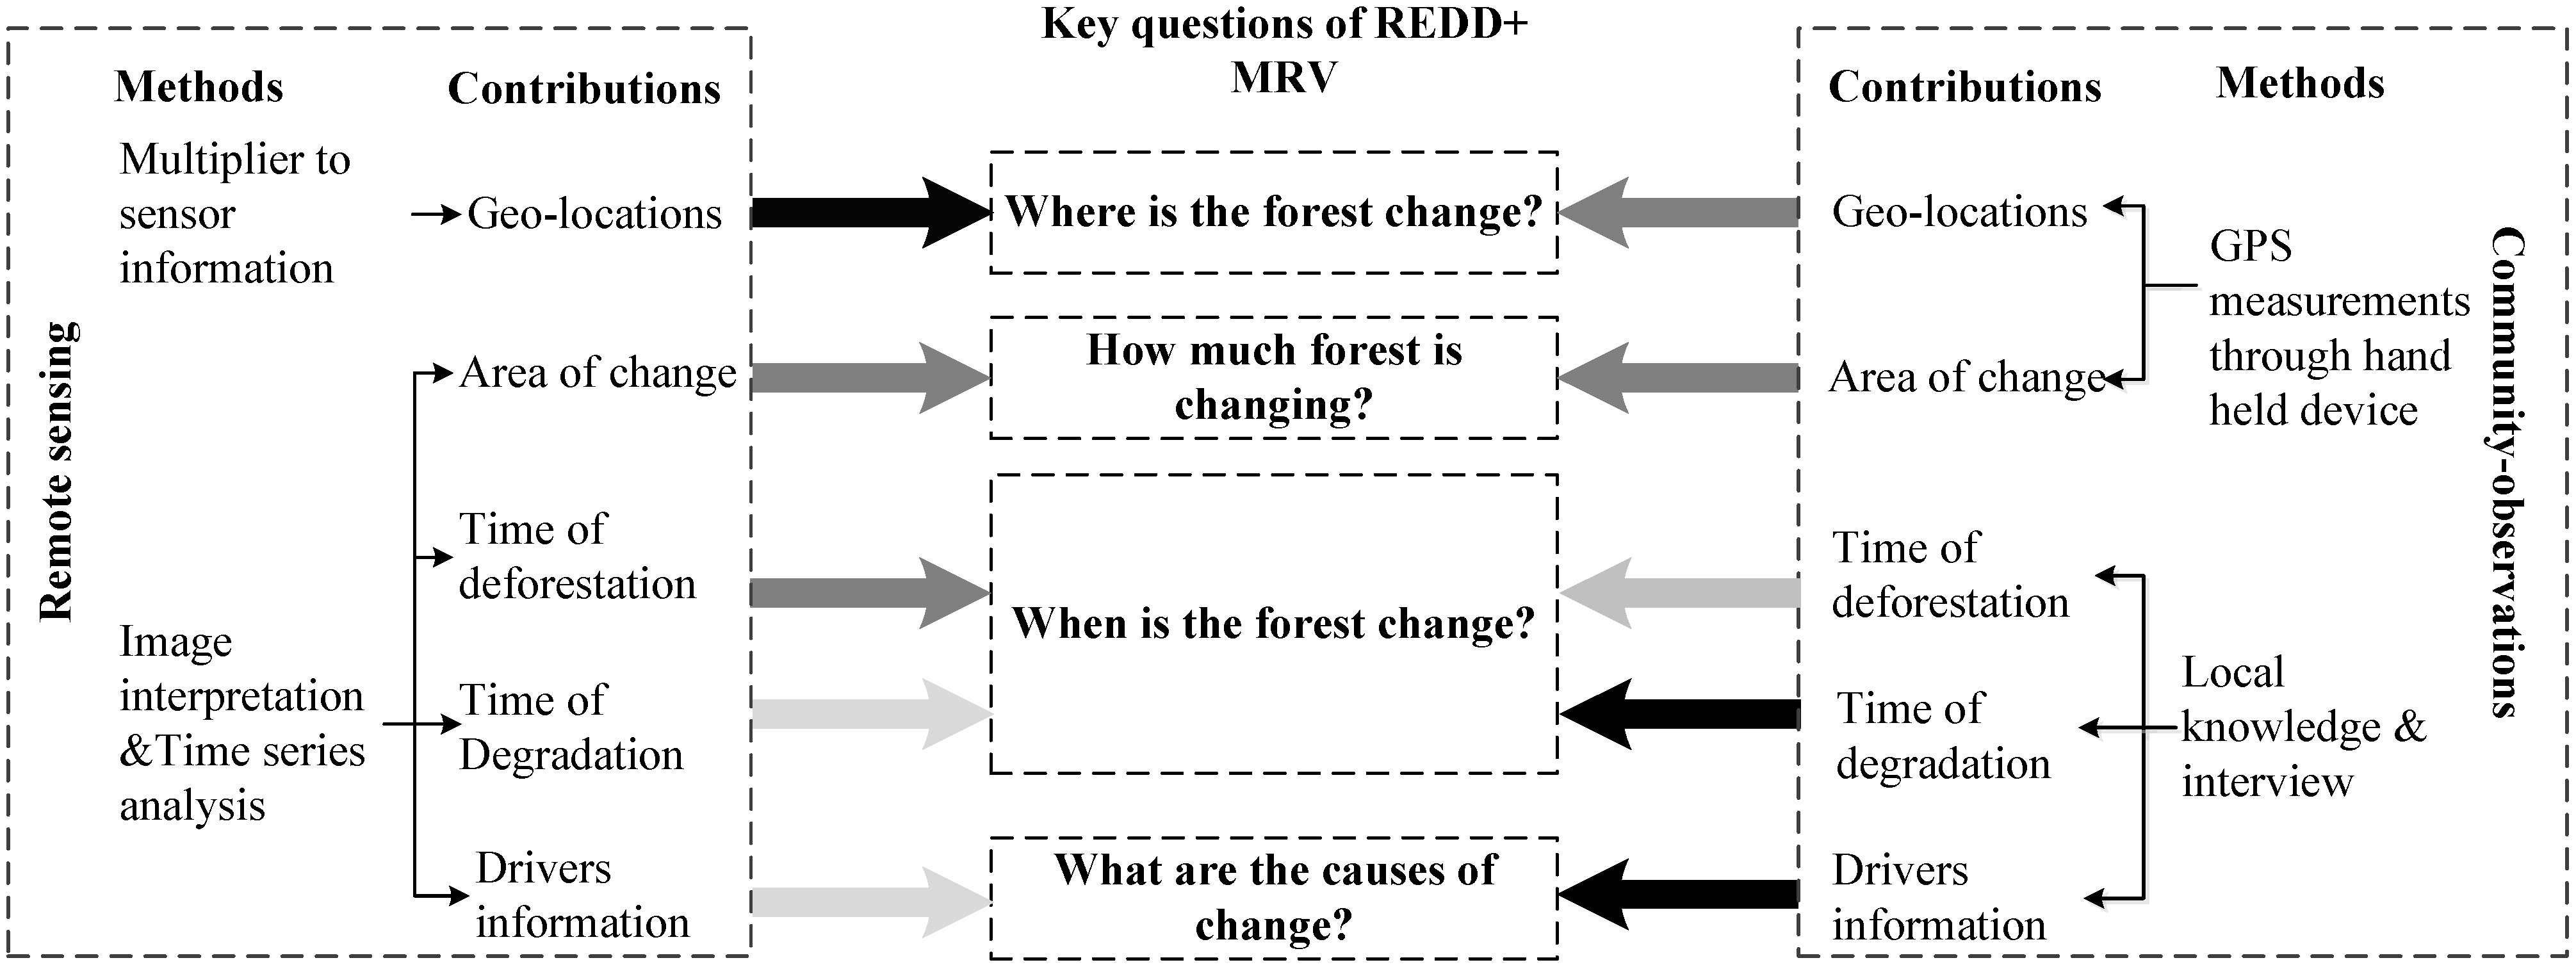
4.3. Potential Role of Local Datasets in an Integrated Monitoring System

4.3.1. Complementarity with Remote Sensing Analysis

The local data stream presented in this paper is not an investigation to replace or compete with remote sensing-based monitoring data, which is conventionally used in forest area change analyses, but is rather envisioned to be complementary to these data. The complementarity between remote sensing and community-observations is described below in the context of several key REDD+ MRV questions (Figure 7).
The first question for REDD+ MRV is the location of change. Remote sensing approaches are highly suitable for answering this question. The value of remote sensing data and their successful implementation to monitor forest change on various scales (global, regional, national, etc.) and at various resolutions is well established [1,15]. The advantages of these methods include consistent data acquisitions, automated data processing and large area coverage [14,56,57]. A main shortcoming is the need for spatially-explicit ground (in situ) data to enhance the reliability of these remote sensing products [58]. There is always a lack of spatially-explicit and statistically representative ground data, because this information is expensive and time consuming to acquire. To address this deficiency, local data streams proposed in this study may provide a useful way to complement remote sensing data. The spatial accuracy results of the local expert data (Table 5 and Table 6) show that local datasets can be used to better understand information related to local administration (e.g., the name of the district and village) or geographical characteristics (distance to roads, nearest village and core forest). Similarly, remote sensing may help to add value to local data streams by providing wall-to-wall coverage, which can be used to validate local data streams. The synergies of both methods may lead to a more efficient monitoring system for data acquisition and to rendering reliable information.
Figure 7. Contributions of remote sensing and community-observation for REDD+ MRV monitoring objectives related to location, size, timing and drivers of forest change; black arrows indicate a very strong contribution; dark grey arrows indicate a reasonably strong contribution; and light grey arrows indicate a limited contribution to these monitoring objectives.
Forests 05 02464 g007
The second REDD+ MRV question is the area of forest change. Both remote sensing and local datasets have their own difficulties when used to map the area of forest change. In general, remote sensing plays a promising role for mapping larger areas, because of its ability to map wall-to-wall changes [15]. However, the trade-offs between the spatial and temporal capabilities of remote sensing limits their use to monitoring small-scale forest change [14]. Since we have shown that local datasets are sufficiently accurate to track small forest changes, the overall mapping of forest change area can be enhanced by exploiting the synergy between these datasets.
The third REDD+ MRV question is related to the timing of forest change. Historical archives of remote sensing imagery and the prospect of a continuous data stream based on new satellites, such as Landsat 8 and Sentinel-2, offer a possibility to analyze the temporal patterns of forest change and the impact of human activities [57,59]. However, the temporal accuracy of detected changes based on this imagery depends on: (1) the availability of cloud-free observations; (2) the seasonality and climate trends; and (3) the spatial scales of land cover change phenomena. In areas with high persistent cloud cover, the detection of actual changes can be delayed due to missing observations, and the seasonality of vegetation can obscure actual changes. Climate events, such as major droughts, can result in temporal signals that resemble actual change, thus contributing to errors. Finally, the scale of change can influence the time at which a change is detected from space. Specifically, we have seen in this study that higher resolution SPOT and RapidEye imagery detect deforestation earlier than local experts, whereas the detection of forest degradation using remote sensing data is delayed compared to that of local experts. Reports of small-scale deforestation and forest degradation from local experts can therefore contribute to an improved understanding of change processes, and the integration of both methods should lead to a more efficient system to signal new changes in near real-time.
The final REDD+ MRV question is related to the driver of forest change. NFMS for REDD+ needs to be designed to track and completely document the drivers of forest change processes [6]. Drivers vary across regions [60], leading to different dominant forest change processes and different approaches needed to tackle these drivers [24]. In general, remote sensing has limited capabilities to track forest change drivers, whereas community-observations are very accurate in reporting these drivers. These drivers of change can be better understood with an intimate knowledge of forest change processes, and this information has the potential to enhance the pertinence of the remote sensing data analysis. Information on drivers collected by local experts thus presents new opportunities for monitoring forest change events.

4.3.2. Link to the National Forest Monitoring System (“Up-Scaling”)

The UNFCCC encourages developing countries to establish an NFMS in support of REDD+ MRV [6]. The NFMS needs to monitor forest carbon and changes in compliance with the five IPCC principles: consistency, transparency, comparability, completeness and accuracy [2]. However, most developing countries have a low monitoring capacity, and the development of these capacities will take considerable time and resources [11]. In this research, we found that local communities can monitor forest changes in a cost-effective way. By scaling up CBM activities to the national level, these capacity gaps can be addressed in an efficient and cost-effective way. Developing countries should therefore give priority to CBM in developing their NFMS and MRV systems.
The UNFCCC REDD+ also offers an opportunity for safeguards, biodiversity conservation and other ecosystem services beyond carbon sequestration [61,62,63]. Monitoring all of these elements within REDD+ is a challenge. Our proposed local monitoring system is based on well-established monitoring principles and experiences. The main advantage of the system is the flexibility in design. The data acquisition side of the system can be easily modified, and it can incorporate other types of environmental monitoring variables. Thus, the integration of other environmental monitoring variables may lead to long-term benefits [18] and shape the future of REDD+ monitoring and implementation efforts [12].

4.4. Future Research Directions

Although our study is founded on the argument that considerable progress can be made towards community-based forest monitoring in REDD+, there is a clear need for improvements to the monitoring set-up. The first area of improvement is the engagement of local communities that have an impact on the success of the proposed monitoring setup. In our study, local experts were employed and the acquaintance of the local people with their local area was a clear advantage in monitoring local changes. Moreover, the feeling of ownership that local people have for their locale has a strong influence on the motivation to participate. Local capacities should therefore be developed through extensive training. The second area of improvement is related to data entry errors. Advancements in hand-held devices, such as smart phones and PDA devices, will improve local participation within monitoring programs. The application of mobile devices can improve the local participation and reduce data entry error within monitoring programs [29]. However, further improvement is needed in terms of user-friendly form design. Specifically, drop-down selection options and multimedia (photos, video and audio) are preferable to manual text entry, which is prone to entry errors. Finally, there is a need to integrate near real-time data streams from both satellites and CBM. Recently, efforts have been made towards improving near real-time forest monitoring using remote sensing data [15,64]. However, the efficacy of near real-time monitoring from ground-based sources, such as CBM, has not yet been investigated. Addressing these gaps in CBM is an important next step in the arena of REDD+ MRV and NFMS.

5. Conclusions

Community-based monitoring is gaining popularity, and large volumes of ground observations that can potentially enhance forest monitoring are being generated. To tap into this potential, we need a better understanding of local data contributions, in particular their consistency and complementarity with remote sensing.
In this article, we present a novel approach to monitor forest change through local experts and evaluate the accuracy and complementarity of local datasets over field-based reference measurements and high resolution satellite imagery from SPOT and RapidEye. We demonstrate the application of the approach by implementing a CBM case study with 30 local experts in the Kafa Biosphere Reserve in Ethiopia. The proposed approach helps us to understand the characteristics and competencies of local datasets. The results show that the local experts are accurate compared to field-based observations and high resolution remote sensing in providing the spatial, temporal and thematic details of the forest change process. Local monitoring data also offer a way to complement and enhance remote sensing-based forest change analysis. In future research, we foresee new ways to integrate local expert monitoring data with satellite-based monitoring data into NFMS in support of REDD+ MRV and near real-time forest change monitoring.

Acknowledgments

The work presented in this paper was made possible with funding and data from a number of sources and valuable input from a number of individuals. Funding for the work of Arun Kumar Pratihast was provided by the Centre for Natural Resources and Development (CNRD), the Institute for Technology and Resources Management in the Tropics and Subtropics (ITT), Cologne University of Applied Sciences, Germany, and the project, Google Deforestation Monitoring (5120906). The work of Ben DeVries was provided in the frame of the project “Climate Protection and Preservation of Primary Forests—A Management Model Using the Wild Coffee Forests in Ethiopia as an Example”, implemented by the Nature and Biodiversity Conservation Union (NABU), German and Ethiopian branches, with funding from the International Climate Initiative (IKI) of the German Federal Ministry for the Environment, Nature Conservation, Building and Nuclear Safety (BMU) (IKI-1 Project Number 09 II 066 ETH A Kaffeewälder). SPOT data were provided through a SPOT Planet Action project entitled “Forest biomass and change monitoring in UNESCOs Kafa Biosphere Reserve (Ethiopia) and the implementation of REDD+ carbon crediting”. RapidEye imagery was obtained through Blackbridge. We would also like to thank NABU and their local partners in Ethiopia for supporting this study. We particularly acknowledge Muluken Mekuria, Terefe Woldegebriel and the 30 local forest rangers of the Kafa Zone Bureau of Agriculture and Rural Development for their support and assistance in forest monitoring observations. Finally, we would like to thank the three anonymous reviewers for their helpful comments on this manuscript.

Author Contributions

Arun Kumar Pratihast, Ben DeVries, Lammert Kooistra and Martin Herold conceived and designed the study. Arun Kumar Pratihast carried out field work, data analysis and prepared the manuscript. Arun Kumar Pratihast, Ben DeVries and Valerio Avitabile designed the tools for ground data acquisition. Mesfin Tekle coordinated the work of the local experts. Sytze de Bruin contributed to the statistical analysis. All authors contributed to the preparation of the manuscript.

Appendix

Table A1. The details of SPOT and RapidEye scenes used in this study; the tile IDs of SPOT images are based on the SPOT K-J reference grid.
SensorTile IDDate of acquisition
SPOT4133–3362-03-2005
133–3352-03-2005
132–33512-22-2005
134–33612-11-2006
134–33512-11-2006
133–3366-07-2006
SPOT5133–33511-02-2007
133–33512-28-2008
133–3351-12-2009
133–3351-01-2010
133–33524-3-2011
134–3362-06-2011
134–3352-06-2011
134–3352-06-2011
133–3362-15-2011
133–3361-26-2011
133–3353-24-2011
133–3353-24-2011
133–3353-24-2011
132–3352-05-2011
RapidEye364242812-12-2012
364252812-12-2012
36425282-24-2013
364262712-12-2012
36426282-24-2013
36427272-24-2013
36427282-24-2013
374230210-17-2012
37424011-02-2013
374240210-17-2012
37425012-24-2013
37425021-05-2012
36424281-02-2013
364252712-12-2012
36428272-24-2013
36428282-24-2013
37423021-01-2012
37423022-25-2013
37424021-01-2012
37424022-25-2013
37424031-01-2012
374240310-17-2012
37424032-25-2013
37425011-02-2013
374250210-17-2012
37425021-02-2013
37425022-25-2013

Conflicts of Interest

The authors declare no conflict of interest.

References

  1. Hansen, M.C.; Potapov, P.V.; Moore, R.; Hancher, M.; Turubanova, S.A.; Tyukavina, A.; Thau, D.; Stehman, S.V.; Goetz, S.J.; Loveland, T.R.; et al. High-resolution global maps of 21st-century forest cover change. Science 2013, 342, 850–853. [Google Scholar] [CrossRef]
  2. IPCC. 2006 IPCC Guidelines for National Greenhouse Gas Inventories; Prepared by the National Greenhouse Gas Inventories Programme; Eggleston, H.S., Buendia, L., Miwa, K., Ngara, T., Tanabe, K., Eds.; Institutefor Global Environmental Strategies: Hayama, Kanagawa, Japan, 2006. [Google Scholar]
  3. Gullison, R.E.; Frumhoff, P.C.; Canadell, J.G.; Field, C.B.; Nepstad, D.C.; Hayhoe, K.; Avissar, R.; Curran, L.M.; Friedlingstein, P.; Jones, C.D.; Nobre, C. Tropical forests and climate policy. Science 2007, 316, 985–999. [Google Scholar] [CrossRef] [PubMed]
  4. UNFCCC. Methodological Guidance for Activities Relating to Reducing Emissions from Deforestation and Forest Degradation and the Role of Conservation, Sustainable Management of Forests and Enhancement of Forest Carbon Stocks in Developing Countries, Decision: 4/cp.15. In Proceedings of the UNFCC COP 15, Copenhagen, Denmark; 2009.
  5. UNFCCC. Outcome of the Work of the ad Hoc Working Group on Long-Term Cooperative Action under the Convention Policy Approaches and Positive Incentives on Issues Relating to Reducing Emissions from Deforestation and Forest Degradation in Developing Countries and the Role of Conservation, Sustainable Management of Forests and Enhancement of Forest Carbon Stocks in Developing Countries, Decision 4/cp.16. In Proceedings of the UNFCC COP 16, Cancun, Mexico; 2010.
  6. UNFCC. Guidelines and Procedures for the Technical Assessment of Submissions from Parties on Proposed Forest Reference Emission Levels and/or Forest Reference Levels, Decision 13/cp.19. In Proceedings of the UNFCC COP 19, Warsaw, Poland; 2013.
  7. Danielsen, F.; Skutsch, M.; Burgess, N.D.; Jensen, P.M.; Andrianandrasana, H.; Karky, B.; Lewis, R.; Lovett, J.C.; Massao, J.; Ngaga, Y.; et al. At the heart of REDD+: A role for local people in monitoring forests? Conserv. Lett. 2011, 4, 158–167. [Google Scholar]
  8. GOFC-GOLD. A sourcebook of methods and procedures for monitoring and reporting anthropogenic greenhouse gas emissions and removals caused by deforestation, gains and losses of carbon stocks in forest remaining forests, and forestation. In GOFC-GOLD Report Version COP19-2; Wageningen University: Wageningen, The Netherlands, 2013. [Google Scholar]
  9. Sanz-Sanchez, M.; Herold, M.; Penman, J. Conference report: REDD+ related forest monitoring remains a key issue: A report following the recent UN climate conference in doha. Carbon Manag. 2013, 4, 125–127. [Google Scholar] [CrossRef]
  10. Herold, M.; Skutsch, M. Monitoring, reporting and verification for national REDD+ programmes: Two proposals. Environ. Res. Lett. 2011, 6, 014002. [Google Scholar] [CrossRef]
  11. Romijn, E.; Herold, M.; Kooistra, L.; Murdiyarso, D.; Verchot, L. Assessing capacities of non-annex i countries for national forest monitoring in the context of REDD+. Environ. Sci. Policy 2012, 19–20, 33–48. [Google Scholar] [CrossRef]
  12. Visseren-Hamakers, I.J.; Gupta, A.; Herold, M.; Peña-Claros, M.; Vijge, M.J. Will REDD+ work? The need for interdisciplinary research to address key challenges. Curr. Opin. Environ. Sustain. 2012, 4, 590–596. [Google Scholar] [CrossRef]
  13. Bucki, M.; Cuypers, D.; Mayaux, P.; Achard, F.; Estreguil, C.; Grassi, G. Assessing REDD+ performance of countries with low monitoring capacities: The matrix approach. Environ. Res. Lett. 2012, 7. [Google Scholar] [CrossRef]
  14. De Sy, V.; Herold, M.; Achard, F.; Asner, G.P.; Held, A.; Kellndorfer, J.; Verbesselt, J. Synergies of multiple remote sensing data sources for REDD+ monitoring. Curr. Opin. Environ. Sustain. 2012, 4, 696–706. [Google Scholar]
  15. Achard, F.; Stibig, H.J.; Eva, H.D.; Lindquist, E.J.; Bouvet, A.; Arino, O.; Mayaux, P. Estimating tropical deforestation from earth observation data. Carbon Manag. 2010, 1, 271–287. [Google Scholar] [CrossRef]
  16. DeVries, B.; Herold, M. The science of measuring, reporting and verication (MRV). In Law, Tropical Forests and Carbon: The Case of REDD+; Lyster, R., MacKenzie, C., McDermott, C., Eds.; Cambridge Univ Press: Cambridge, London, 2013; pp. 151–183. [Google Scholar]
  17. Achard, F.; Mollicone, D.; Stibig, H.J.; Aksenov, D.; Laestadius, L.; Li, Z.; Popatov, P.; Yaroshenko, A. Areas of rapid forest-cover change in boreal eurasia. For. Ecol. Manag. 2006, 237, 322–334. [Google Scholar] [CrossRef]
  18. DeFries, R.; Achard, F.; Brown, S.; Herold, M.; Murdiyarso, D.; Schlamadinger, B.; de Souza, C., Jr. Earth observations for estimating greenhouse gas emissions from deforestation in developing countries. Environ. Sci. Policy 2007, 10, 385–394. [Google Scholar] [CrossRef]
  19. Vargas, R.; Paz, F.; de Jong, B. Quantification of forest degradation and belowground carbon dynamics: Ongoing challenges for monitoring, reporting and verification activities for REDD+. Carbon Manag. 2013, 4, 579–582. [Google Scholar] [CrossRef]
  20. Strahler, A.H.; Boschetti, L.; Foody, G.M.; Friedl, M.A.; Hansen, M.C.; Herold, M.; Mayaux, P.; Morisette, J.T.; Stehman, S.V.; Woodcock, C.E. Global Land Cover Validation: Recommendations for Evaluation and Accuracy Assessment of Global Land Cover Maps; Report No. 25; GOFC-GOLD: Luxembourg, Luxembourg, 2006; pp. 1–51. [Google Scholar]
  21. Gibbs, H.K.; Herold, M. Tropical deforestation and greenhouse gas emissions. Environ. Res. Lett. 2007, 2, 045021. [Google Scholar] [CrossRef]
  22. Tomppo, E.; Gschwantner, M.; Lawrence, M.; McRoberts, R.E. National Forest Inventories: Pathways for Common Reporting; Springer: Heidelberg, Germany, 2010; pp. 1–609. [Google Scholar]
  23. Skutsch, M.M.; McCall, M.K.; Larrazabal, A.P. Balancing views on community monitoring: The case of REDD+: A response to “towards a more balanced view on the potentials of locally-based monitoring”. Biodivers. Conserv. 2014, 23, 233–236. [Google Scholar] [CrossRef]
  24. Skutsch, M.M.; Torres, A.B.; Mwampamba, T.H.; Ghilardi, A.; Herold, M. Dealing with locally-driven degradation: A quick start option under REDD+. Carbon Balance Manag. 2011, 6, 16. [Google Scholar] [CrossRef] [PubMed]
  25. Pratihast, A.K.; Herold, M.; de Sy, V.; Murdiyarso, D.; Skutsch, M. Linking community-based and national REDD+ monitoring: A review of the potential. Carbon Manag. 2013, 4, 91–104. [Google Scholar] [CrossRef]
  26. Danielsen, F.; Adrian, T.; Brofeldt, S.; van Noordwijk, M.; Poulsen, M.K.; Rahayu, S.; Rutishauser, E.; Theilade, I.; Widayati, A.; An, N.T.; et al. Community monitoring for REDD+: International promises and field realities. Ecol. Soc. 2013, 18. [Google Scholar] [CrossRef]
  27. Topp-Jørgensen, E.; Poulsen, M.K.; Lund, J.F.; Massao, J.F. Community-based monitoring of natural resource use and forest quality in montane forests and miombo woodlands of tanzania. Biodivers. Conserv. 2005, 14, 2653–2677. [Google Scholar] [CrossRef]
  28. Shrestha, R. Participatory carbon monitoring: An experience from the koshi hills, Nepal. In Proceedings of the National Conference on Forest-People Interaction, NUFU HIMUNET Project, Institute of Forestry, Pokhara, Nepal, 7–8 June 2010; pp. 1–14.
  29. Pratihast, A.K.; Herold, M.; Avitabile, V.; de Bruin, S.; Bartholomeus, H.; Souza, C.M., Jr.; Ribbe, L. Mobile devices for community-based REDD+ monitoring: A case study for central vietnam. Sensors 2012, 13, 21–38. [Google Scholar] [CrossRef]
  30. Fry, B.P. Community forest monitoring in REDD+: The “m” in mrv? Environ. Sci. Policy 2011, 14, 181–187. [Google Scholar] [CrossRef]
  31. Lawlor, K.; Madeira, E.; Blockhus, J.; Ganz, D. Community participation and benefits in REDD+: A review of initial outcomes and lessons. Forests 2013, 4, 296–318. [Google Scholar] [CrossRef]
  32. Goodchild, M.F. Citizens as Sensors: The World of Volunteered Geography. GeoJournal 2007, 69, 211–221. [Google Scholar] [CrossRef]
  33. Danielsen, F.; Burgess, N.D.; Jensen, P.M.; Pirhofer-Walzl, K. Environmental monitoring: The scale and speed of implementation varies according to the degree of people’s involvement. J. Appl. Ecol. 2010, 47, 1166–1168. [Google Scholar] [CrossRef]
  34. Conrad, C.C.; Hilchey, K.G. A review of citizen science and community-based environmental monitoring: Issues and opportunities. Environ. Monit. Assess. 2011, 176, 273–291. [Google Scholar] [CrossRef] [PubMed]
  35. Skarlatidou, A.; Haklay, M.; Cheng, T. Trust in web GIS: The role of the trustee attributes in the design of trustworthy web GIS applications. Int. J. Geogra. Inf. Sci. 2011, 25, 1913–1930. [Google Scholar] [CrossRef]
  36. Schmitt, C.B.; Denich, M.; Demissew, S.; Friis, I.; Boehmer, H.J. Floristic diversity in fragmented afromontane rainforests: Altitudinal variation and conservation importance. Appl. Veg. Sci. 2010, 13, 291–304. [Google Scholar]
  37. Stickler, C.M.; Nepstad, D.C.; Coe, M.T.; McGrath, D.G.; Rodrigues, H.O.; Walker, W.S.; Soares, B.S.; Davidson, E.A. The potential ecological costs and cobenefits of REDD: A critical review and case study from the amazon region. Glob. Chang. Biol. 2009, 15, 2803–2824. [Google Scholar] [CrossRef]
  38. Ratner, B.D.; Parnell, T. Building coalitions across sectors and scales in cambodia. In Forests and People: Property, Governance, and Human Rights; Sikor, T., Stahl, J., Eds.; Earthscan: Oxon, UK, 2011; pp. 203–216. [Google Scholar]
  39. Danielsen, F.; Burgess, N.D.; Balmford, A. Monitoring matters: Examining the potential of locally-based approaches. Biodivers. Conserv. 2005, 14, 2507–2542. [Google Scholar] [CrossRef]
  40. Danielsen, F.; Burgess, N.D.; Balmford, A.; Donald, P.F.; Funder, M.; Jones, J.P.G.; Alviola, P.; Balete, D.S.; Blomley, T.; Brashares, J.; et al. Local participation in natural resource monitoring: A characterization of approaches. Conserv. Biol. 2009, 23, 31–42. [Google Scholar] [CrossRef] [PubMed]
  41. OpenDataKit. Available online: http://opendatakit.Org (accessed on 17 march 2014).
  42. Pohl, C.; van Genderen, J. Review article multisensor image fusion in remote sensing: Concepts, methods and applications. Int. J. Remote Sens. 1998, 19, 823–854. [Google Scholar] [CrossRef]
  43. Haklay, M. How good is volunteered geographical information? A comparative study of openstreetmap and ordnance survey datasets. Environ. Plan. B: Plan. Design 2010, 37, 682–703. [Google Scholar] [CrossRef]
  44. Devillers, R.; Bédard, Y.; Jeansoulin, R.; Moulin, B. Towards spatial data quality information analysis tools for experts assessing the fitness for use of spatial data. Int. J. Geogr. Inf. Sci. 2007, 21, 261–282. [Google Scholar] [CrossRef]
  45. Castro, P.; Alonso, J.; Guerra, C.; Gonçalves, J.; Pôças, I.; Marcos, B.; Honrado, J. Novel tools to improve the management of spatial data quality in the context of ecosystem and biodiversity monitoring. In Proceedings of the GI Forum, Salzburg, Austria, 2–5 July 2013.
  46. ISO/TC211. In Geographic Information—Quality Principles; ISO: Berne, Switzerland, 2002.
  47. Johnson, N.L.; Kemp, A.W.; Kotz, S. Univariate Discrete Distributions; John Wiley & Sons: Newark, NJ, USA, 2005; pp. 1–633. [Google Scholar]
  48. Kennedy, R.E.; Cohen, W.B.; Schroeder, T.A. Trajectory-based change detection for automated characterization of forest disturbance dynamics. Remote Sens. Environ. 2007, 110, 370–386. [Google Scholar] [CrossRef]
  49. Schroeder, T.A.; Wulder, M.A.; Healey, S.P.; Moisen, G.G. Mapping wildfire and clearcut harvest disturbances in boreal forests with landsat time series data. Remote Sens. Environ. 2011, 115, 1421–1433. [Google Scholar] [CrossRef]
  50. Foody, G.M. Status of land cover classification accuracy assessment. Remote Sens. Environ. 2002, 80, 185–201. [Google Scholar] [CrossRef]
  51. Danielsen, F.; Jensen, P.M.; Burgess, N.D.; Altamirano, R.; Alviola, P.A.; Andrianandrasana, H.; Brashares, J.S.; Burton, A.C.; Coronado, I.; Corpuz, N.; et al. A multicountry assessment of tropical resource monitoring by local communities. BioScience 2014, 64, 236–251. [Google Scholar] [CrossRef]
  52. Bowler, D.E.; Buyung-Ali, L.M.; Healey, J.R.; Jones, J.P.; Knight, T.M.; Pullin, A.S. Does community forest management provide global environmental benefits and improve local welfare? Front. Ecol. Environ. 2011, 10, 29–36. [Google Scholar] [CrossRef]
  53. Getahun, K.; van Rompaey, A.; van Turnhout, P.; Poesen, J. Factors controlling patterns of deforestation in moist evergreen afromontane forests of southwest ethiopia. For. Ecol. Manag. 2013, 304, 171–181. [Google Scholar] [CrossRef]
  54. Sigrist, P.; Coppin, P.; Hermy, M. Impact of forest canopy on quality and accuracy of GPS measurements. Int. J. Remote Sens. 1999, 20, 3595–3610. [Google Scholar] [CrossRef]
  55. Verburg, P.H.; Neumann, K.; Nol, L. Challenges in using land use and land cover data for global change studies. Glob. Chang. Biol. 2011, 17, 974–989. [Google Scholar] [CrossRef]
  56. Roy, D.; Wulder, M.; Loveland, T.; Allen, R.; Anderson, M.; Helder, D.; Irons, J.; Johnson, D.; Kennedy, R.; Scambos, T. Landsat-8: Science and product vision for terrestrial global change research. Remote Sens. Environ. 2014, 145, 154–172. [Google Scholar] [CrossRef]
  57. Hansen, M.C.; Loveland, T.R. A review of large area monitoring of land cover change using landsat data. Remote Sens. Environ. 2012, 122, 66–74. [Google Scholar] [CrossRef]
  58. Li, X.; Wang, S.; Ge, Y.; Jin, R.; Liu, S.; Ma, M.; Shi, W.; Li, R.; Liu, Q. Development and experimental verification of key techniques to validate remote sensing products. ISPRS-Int. Archives Photogramm. Remote Sens. Spat. Inf. Sci. 2013, 1, 25–30. [Google Scholar] [CrossRef]
  59. Drusch, M.; Del Bello, U.; Carlier, S.; Colin, O.; Fernandez, V.; Gascon, F.; Hoersch, B.; Isola, C.; Laberinti, P.; Martimort, P.; et al. Sentinel-2: Esa’s optical high-resolution mission for GMES operational services. Remote Sens. Environ. 2012, 120, 25–36. [Google Scholar] [CrossRef]
  60. Noriko, H.; Martin, H.; Veronique De, S.; Ruth, S.D.F.; Maria, B.; Louis, V.; Arild, A.; Erika, R. An assessment of deforestation and forest degradation drivers in developing countries. Environ. Res. Lett. 2012, 7, 044009. [Google Scholar] [CrossRef]
  61. Dickson, B.; Kapos, V. Biodiversity monitoring for REDD+. Curr. Opin. Environ. Sustain. 2012, 4, 717–725. [Google Scholar] [CrossRef]
  62. Chhatre, A.; Lakhanpal, S.; Larson, A.M.; Nelson, F.; Ojha, H.; Rao, J. Social safeguards and co-benefits in REDD+: A review of the adjacent possible. Curr. Opin. Environ. Sustain. 2012, 4, 654–660. [Google Scholar] [CrossRef]
  63. Balderas Torres, A.; Skutsch, M. Splitting the difference: A proposal for benefit sharing in reduced emissions from deforestation and forest degradation (REDD+). Forests 2012, 3, 137–154. [Google Scholar]
  64. Verbesselt, J.; Zeileis, A.; Herold, M. Near real-time disturbance detection using satellite image time series. Remote Sens. Environ. 2012, 123, 98–108. [Google Scholar] [CrossRef]

