


In The Netherlands, fat intake is above daily recommended levels, while fruit and vegetable intakes are below recommended levels1. Previous studies have shown a gap between perceived and actual dietary intakesReference Brug, Van Assema, Kok, Lenderink and Glanz2–Reference Shim, Variyam and Blaylock4. Awareness of personal dietary intakes seems to be important for the development of successful nutrition interventions. Lack of awareness has serious consequences, because people who believe they eat healthily are not motivated to change their nutrition behaviourReference Van Assema, Brug and Lechner5. Creating awareness is the first step in behavioural change and is the primary concept of the Precaution Adoption Process ModelReference Weinstein6. According to the Stages of Change Model, awareness of personal risk behaviour is essential in motivating people to move from pre-contemplation to further stages of behavioural changeReference Prochaska and Velicer7.
To address these issues, two qualitative studies were first conducted to measure pre-existing knowledge, attitudes, and beliefs about food. These studies left the impression that Dutch adults lacked nutrition awarenessReference Van Dillen, Hiddink, Koelen, De Graaf and Van Woerkum8. On the basis of several empirical studies, we developed a hypothetical model for nutrition awarenessReference Van Dillen, Hiddink, Koelen, De Graaf and Van Woerkum8 using sociodemographic as well as psychosocial correlates, including individualReference Worsley and Worsley9–Reference Falk, Sobal, Bisogni, Connors and Devine17 and environmentalReference Hiddink, Hautvast, Van Woerkum, Fieren and Van’t Hof12–14, Reference Falk, Sobal, Bisogni, Connors and Devine17–Reference Buttriss23 variables. In this model, our working definition of nutrition awareness was as follows: a realisation of one’s own personal risk behaviour regarding nutritionReference Weinstein6. Few studies have actually explored the relationship between nutrition awareness and sociodemographic correlatesReference Lechner, Brug and De Vries3, Reference De Graaf, Van der Gaag, Kafatos, Lennerman and Kearney24–Reference Girois, Kumanyika, Morabia and Mauger27. Two studiesReference Lechner, Brug and De Vries3, Reference Glanz, Brug and Van Assema25 compared subjective food intake with objective food intake (with the aid of a food-frequency questionnaire) in order to construct an awareness variable. In another two studiesReference Sapp and Jensen26, Reference Girois, Kumanyika, Morabia and Mauger27, awareness was measured using several diet–health linkages, and in a separate studyReference De Graaf, Van der Gaag, Kafatos, Lennerman and Kearney24 it was measured using the Stages of Change Model. However, no clear definition of nutrition awareness emerged. Therefore, we considered unravelling the concept of nutrition awareness to be a useful effort. In the present paper, a novel approach is embraced wherein nutrition awareness is comprehensively measured using several propositions that reflect Dutch dietary guidelines28. In comparisons with the above-mentioned studies, care should be taken due to the alternative measurement methods we chose to employ.
Method
Study population and design
Our study population was Dutch adults aged 18–80 years. A stratified sample of 923 respondents was taken from the market research office GfK ScriptPanel, which was representative of the Dutch population with regard to gender, age, education level and residence29. Six hundred and three respondents agreed to participate in the face-to-face interview-assisted questionnaire. Response rate was 65%. The sample consisted of 385 women (64%) and 218 men (36%), meaning that women were slightly overrepresented. The mean age was 48 years. A non-response questionnaire, containing questions about nutrition knowledge, nutrition interest and nutrition-related behaviours, was conducted by telephone with 82 respondents (9%).
Questionnaire
Based on our qualitativeReference Van Dillen, Hiddink, Koelen, De Graaf and Van Woerkum8 and empirical studiesReference Worsley and Worsley9–Reference Buttriss23, a comprehensive model for nutrition awareness was developed. We decided to condense that model down to its most important variables, which resulted in our hypothetical model for nutrition awarenessReference Van Dillen, Hiddink, Koelen, De Graaf and Van Woerkum8. The dependent variable for measurement was nutrition awareness. We decided not to include a stage of change measure, since we were only interested in the first stages of behavioural change. We took a novel approach by measuring nutrition awareness with the use of several propositions, to reflect dietary guidelines28. For the construction of this variable, we took eight items from the general health interest scaleReference Roininen, Lähteenmäki and Tuorila30 (items 1–8), three items from the health awareness scaleReference Oude Ophuis and Avlonitis31 (items 9–11) and six self-composed items (items 12–17). Nutrition awareness was thus assessed by 17 propositions using a 5-point Likert scale (from strongly agree to strongly disagree) (Cronbach’s α = 0.89). Table 1 shows the results of the factor analysis. Consequently, we constructed one scale by summing up the 17 items. The independent variables (environmental and individual) and external variables (including sociodemographic) are described below.
Table 1 Description of the items of the nutrition awareness scale

Environmental variables were operationalised as perceived attributes of nutrition information sources, which we measured using four questions pertaining to which people or institutions were spontaneously perceived as: most reliable, possessing the most expertise, having the greatest clearness, and as being most accessible in matters of health and nutritionReference Van Dillen, Hiddink, Koelen, De Graaf and Van Woerkum32. Initially, we intended to include all of the information sources into just three factors, i.e. commercial, neutral and social. However, factor analysis did not support the use of such straightforward factors. Therefore, we decided to compute an overall score for each single source based on perceived reliability, expertise, clearness and accessibility (Cronbach’s α between 0.69 and 0.92). An additional factor analysis resulted in seven reliable factors; Cronbach’s α varied from 0.67 to 0.81. In the end, eight individual variables were included. Interest in nutrition was operationalised as involvement with nutrition (i.e. the value placed on (new information about) nutrition), and included one item related to the importance of the topic nutritionReference Hiddink, Hautvast, Van Woerkum, Fieren and Van’t Hof12 and one self-composed item related to the importance of new information about nutrition using a 4-point scale (from not important to very important). The new variable ‘involvement with nutrition’ had a Cronbach’s α of 0.69. Perception of the role of behaviour and heredity in health (i.e. an estimation of the contribution of behavioural factors and heredity to state of health) was adoptedReference Hiddink, Hautvast, Van Woerkum, Fieren and Van’t Hof12, measured by seven questions using a 10-point scale (from very little influence to very much influence) (Cronbach’s α = 0.65). Health awareness (i.e. an interest in health, which is reflected in healthy food choices and physical activity) was adoptedReference Oude Ophuis and Avlonitis31 by 11 questions using a 5-point scale (from strongly agree to strongly disagree) (Cronbach’s α = 0.89). Health locus of control (HLC) (i.e. belief in control of health) was adoptedReference Wallston and Wallston33 and measured using nine questions and a 5-point scale. Three separate scales were constructed, namely Internal HLC (self-control; Cronbach’s α = 0.66), Powerful Others HLC (health professionals’ control; Cronbach’s α = 0.74) and Chance HLC (control by fate; Cronbach’s α = 0.43). Because of low internal consistency, chance HLC was not included in the analysis. Beliefs about food were operationalised as associations with food (i.e. the meaning attached to food in daily life) and measured with one question – asking respondents what comes to mind when thinking about the word ‘food’. Factor analysis revealed no reliable factors, so we decided to include single associations. Because some associations were rarely mentioned, we used only the seven associations mentioned by more than 10% of the respondents. Attitudes toward food topics were operationalised as perceived relevance of food topics (i.e. importance of food topics) and measured by one question: respondents were provided with 18 food topic cards (e.g. balanced diet, eating less fat) and asked to pick out five cards that were personally relevant and to sequence them in order of importanceReference Van Dillen, Hiddink, Koelen, De Graaf and Van Woerkum32. Factor analysis revealed no reliable factors, so single food topics were used instead. From the 18 food topics, 11 were mentioned by more than 10% of the respondents and were thus used in the analysis. Information needs regarding food topics (i.e. the need for specific knowledge to obtain answers to important questions about food topics) were assessed by five questions probing as to whether respondents needed more information about the five food topics that had already been identified as important (yes–no categories)Reference Van Dillen, Hiddink, Koelen, De Graaf and Van Woerkum32. Since factor analysis revealed no reliable factors, single information needs were used. Our cut-off line was 10%, allowing seven information needs to be taken into analysis. Information behaviour (i.e. the way someone obtains information – both passively and actively) was assessed by one question that asked respondents spontaneously from whom (persons or institutions) they had sought information about nutrition and health over the past year.
Sociodemographic variables, including gender, age, education level, income, lifecycle (living situation: living independently or together, having children or not) and residence, were obtained from the GfK ScriptPanel database.
Nutrition-related behaviours were objectively measured in other studiesReference Lechner, Brug and De Vries3, Reference Glanz, Brug and Van Assema25 by means of food-frequency questionnaires. Since these are very time-consuming, we took an alternative approach, using recommended amounts of eight different foods (bread, cheese on bread, meat on bread, potatoes, meat/fish, vegetables, fruits, milk (products)) for adults, as stated by The Netherlands Nutrition Center34. Nutrition-related behaviours were measured by means of eight items (e.g. How many pieces of fruit do you eat a day? 1, 2 or 3 or more). Factor analysis delivered no clear factor.
Data analysis
SPSS 10.5 (SPSS Inc.) was used for the statistical analyses. After computing descriptive statistics, principal component factor analyses with varimax rotation were performed in order to construct scales. Scales were verified using reliability analysis. Moreover, multivariate variance analysis tests with Hotelling’s Trace were used to analyse significant differences in individual and environmental variables between respondents with low and high nutrition awareness, based on median split. Next, χ 2 tests were used for associations between nutrition awareness and sociodemographic correlates. In addition, Pearson correlation coefficients between nutrition awareness and independent variables were computed. Finally, our hypothetical model for nutrition awareness was tested using a multiple linear regression analysis, combining forward and backward procedures. Furthermore, for unravelling a possible relationship between nutrition awareness and nutrition-related behaviours, we used Pearson correlation coefficients, χ 2 tests and multiple linear regression analyses. For all analyses, a significance level of P ≤ 0.05 was chosen.
Results
Descriptive statistics
Scores for nutrition awareness ranged between 32 and 84. The mean score was 60.35. Based on the median, two groups for nutrition awareness were established, one consisting of adults with low nutrition awareness (n = 283; 47%) and the other being made up of adults with high nutrition awareness (n = 320; 53%). Nutrition-related behaviour scores for eight foods were divided into three categories: consumption below, consistent with and above the daily recommended levels. It appears that 23% met recommended levels for bread, eating five to seven slices of bread per day. About two-thirds ate the recommended one or two slices of cheese, and one or two slices of meat on their bread per day (68% and 66%, respectively). Next, 48% met the recommended intake level for potatoes (three to five pieces per day). The recommendation for meat/fish consumption of 100 g per day was met by 42% of the sample. Furthermore, 44% ate 200 g of vegetables daily and 39% ate two pieces of fruit. Finally, 48% consumed enough milk (products), drinking two to three glasses per day.
Differences in correlates between adults with low and high nutrition awareness
Respondents with high nutrition awareness associated food significantly more often with healthy food, compared with respondents with low nutrition awareness (26% vs. 11%; F = 23.2, df = 1, P = 0.00; data not shown). Adults with low nutrition awareness thought more often about tasty food than adults with high nutrition awareness (52% vs. 42%; F = 5.4, df = 1, P = 0.02).
Respondents with high nutrition awareness perceived food topics, such as lowering cholesterol (28% vs. 16%; F = 13.8, df = 1, P = 0.00) and eating less fat (61% vs. 49%; F = 9.6, df = 1, P = 0.00), as more relevant than respondents with low nutrition awareness. Respondents who were less aware of nutrition perceived two food topics to be more relevant than the high nutrition awareness group, namely sports and nutrition (31% vs. 21%; F = 8.8, df = 1, P = 0.00) and vitamins (50% vs. 42%; F = 4.5, df = 1, P = 0.03). Adults with high nutrition awareness expressed a greater need for information about eating less fat (21% vs. 10%; F = 14.8, df = 1, P = 0.00) and about fruits and vegetables (22% vs. 13%; F = 6.9, df = 1, P = 0.00) than adults with low nutrition awareness.
Respondents with high nutrition awareness were more involved with nutrition (F = 187.3, df = 1, P = 0.00), sought more information about nutrition (F = 8.1, df = 1, P = 0.01), and held stronger beliefs related to health controlled by powerful others (F = 8.0, df = 1, P = 0.01) than respondents with low nutrition awareness. Surprisingly, respondents with low nutrition awareness demonstrated higher health awareness (F = 78.1, df = 1, P = 0.00) than those with high nutrition awareness.
Family doctors (F = 11.6, df = 1, P = 0.00) and the government (F = 4.3, df = 1, P = 0.04) were found to be the most suitable information sources for respondents with low nutrition awareness, while those with high nutrition awareness relied more on magazines (F = 6.4, df = 1, P = 0.01). Respondents with high nutrition awareness found independent organisations and the media (of borderline significance) to be more suitable for providing information about nutrition and health than respondents with low nutrition awareness (Table 2). Respondents with low nutrition awareness found health professionals more suitable than respondents with high nutrition awareness (of borderline significance).
Table 2 Perceived attributes of nutrition information sources among adults with low (LNA; n = 283) and high nutrition awareness (HNA; n = 320). Hotelling’s Trace (F = 2.7, df = 7, P = 0.01)
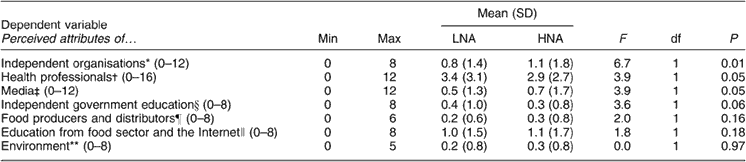
Min – minimum score; Max – maximum score; SD – standard deviation.
Range of scores for sources is given in parentheses. See Methods.
The higher the score, the higher the attributes of a group of nutrition information sources were perceived, which means that they were perceived as more suitable.
* Independent organisations: consumer alliances, national education offices, scientific organisations.
† Health professionals: family doctor, dietitian, medical specialist, pharmacist.
‡ Media: written education materials, television, magazines.
§ Independent government education: The Netherlands Nutrition Center, government.
¶ Food producers: food manufacturers, retail trade.
∥ Education from food sector and the Internet: education offices of food sector, Internet.
** Environment: direct environment, newspapers.
Further analysis looking at men (n = 218) and women (n = 385) with respect to nutrition awareness found significant differences (χ 2 = 52.6, df = 1, P = 0.00). Men were balanced between low and high nutrition awareness, while significantly more women expressed high nutrition awareness (77%). Age was also significant: 23% were young (18–30 years), 49% were middle-aged (31–50 years) and 28% were old (51–80 years) in the low nutrition awareness group, whereas 8% were young, 38% middle-aged and 54% old in the high nutrition awareness group (χ 2 = 51.3, df = 2, P = 0.00). Nutrition awareness was also associated with having children (χ 2 = 18.3, df = 1, P = 0.00). Other sociodemographic variables were not significantly different.
Regression model
First, we tested our hypothetical model for nutrition awarenessReference Van Dillen, Hiddink, Koelen, De Graaf and Van Woerkum8. Nutrition awareness was best predicted by involvement with nutrition (i.e. value placed on (new information about) nutrition), which explained 31.9% of the variance (Table 3). Health awareness added 9.4%, association with healthy food 2.4%, perceived relevance of eating less fat 1.6%, association with necessity 1.0%, perceived attributes of independent organisations 0.7%, and perceived relevance of vitamins 0.9%. Gender and age added 5.8% (3.4% and 2.4%, respectively). The model explained 53.7% of the total variance (Fig. 1).
Table 3 Regression model for nutrition awareness (n = 603)

* Involvement with nutrition: importance of (new information about) nutrition.
† Health awareness: interest in health, which is reflected in choosing healthy food products and physical activity.
‡ Association with healthy food: meaning attached to healthy food in daily living.
§ Perceived relevance of eating less fat: importance of food topic ‘eating less fat’.
¶ Association with necessity: meaning attached to food in daily living is necessity.
∥ Perceived attributes of independent organisations: perceived suitability of consumer alliances, national education offices and scientific organisations.
** Perceived relevance of vitamins: importance of food topic ‘vitamins’.

Fig. 1 Model for nutrition awareness
Relationship between nutrition awareness and nutrition-related behaviours
The highest correlation was found between nutrition awareness and fruit consumption (r = 0.30, P = 0.00). The relationship with vegetable consumption was also positive (r = 0.23, P = 0.00), while the others – i.e. with meat/fish (r = −0.27, P = 0.00), meat on slices of bread (r = −0.16, P = 0.00), potato (r = −0.15, P = 0.00) and bread consumption (r = −0.10, P = 0.02) – were negative. Relationships with cheese on slices of bread and milk consumption were not significant.
Adults with low nutrition awareness were more likely to consume three to five potatoes and five to seven slices of bread per day (following the recommendation) than adults with high nutrition awareness (55% vs. 45%, χ 2 = 7.7, df = 2, P = 0.02 and 57% vs. 43%, χ 2 = 19.7, df = 2, P = 0.00 respectively). The group with high nutrition awareness was more likely to consume two pieces of fruit (63% vs. 37%, χ 2 = 31.5, df = 2, P = 0.00), 100 g meat/fish (62% vs. 38%, χ 2 = 29.2, df = 2, P = 0.00), 200 g vegetables (53% vs. 47%, χ 2 = 17.0, df = 2, P = 0.00), one or two slices of meat on their bread (53% vs. 47%, χ 2 = 14.0, df = 2, P = 0.00) and two or three milk products (53% vs. 47%, χ 2 = 10.2, df = 2, P = 0.01) daily, in accordance with the recommendations, compared with the group with low nutrition awareness. Respondents with high nutrition awareness did not consume more cheese on their bread than people with low nutrition awareness (45% vs. 55%, χ 2 = 4.0, df = 2, P = 0.14).
The variance in fruit consumption was explained by nutrition awareness with 15.3%. Nutrition awareness was also a predictor of consumption of vegetables (11.3%), meat/fish (5.4%) and meat on slices of bread (2.6%), but not a predictor for bread, cheese on slices of bread, potato and milk consumption.
Discussion
Our model explains nutrition awareness rather well (explained variance 53.7%). Sociodemographic correlates were gender and age. Psychosocial correlates were involvement with nutrition and health awareness (together 41%), while the others – i.e. association with healthy food, perceived relevance of eating less fat, association with necessity, and perceived attributes of independent organisations – appeared to be relatively minor. The relationship between nutrition awareness and nutrition-related behaviours proved to be very complicated.
As found in other studiesReference De Graaf, Van der Gaag, Kafatos, Lennerman and Kearney24–Reference Girois, Kumanyika, Morabia and Mauger27, women tended to be more aware of nutrition than men. The association of age with nutrition awareness is less consistent. In accordance with another studyReference Sapp and Jensen26, the elderly appeared to be more nutritionally aware. A pan-European studyReference De Graaf, Van der Gaag, Kafatos, Lennerman and Kearney24 on consumer attitudes about nutrition found that people over 25 years of age were more likely to be nutritionally aware, whiles other studiesReference Glanz, Brug and Van Assema25, Reference Girois, Kumanyika, Morabia and Mauger27 found no significant difference. However, that different measurement methods were used in these comparisons should be kept in mind.
To our knowledge, no other studies have analysed the psychosocial correlates for nutrition awareness. As expected, adults with high nutrition awareness associated food more often with health, whereas adults with low nutrition awareness associated food more often with taste. Apparently, taste is important for the latter group. This is supported by the pan-European study, in which respondents in the pre-contemplation stage (low nutrition awareness) found taste more important, while people in maintenance stage (high nutrition awareness) found that health was more importantReference De Graaf, Van der Gaag, Kafatos, Lennerman and Kearney24.
With respect to food topics, respondents with high nutrition awareness perceived lowering cholesterol and eating less fat as being most relevant. It is interesting that they choose these specific food topics, which were actually multidimensional and complex. The fat guideline contains complex nutrition information and, as such, has been reported as being conceptually difficult for consumers to understandReference Keenan, AbuSabha and Robinson35. Sports and nutrition, and vitamins were perceived as more relevant by adults with low nutrition awareness, probably because they had a limited view of when nutrition is important.
As expected, involvement with nutrition was higher among respondents with high nutrition awareness and this appeared to be the strongest correlate for nutrition awareness (explained variance 31.9%). Involvement is an important concept in the Elaboration Likelihood ModelReference Petty and Cacioppo36. People with high involvement take the central route to persuasion, after diligent consideration of the information available. This is in line with other results, showing that people with high nutrition awareness found media in general and magazines in particular more suitable. Although media often provide misleading information, people with high nutrition awareness were probably more able to discriminate between incorrect and correct information. People with low involvement rely more on peripheral cues, such as reliable and expert sources, and our results showed that people with low nutrition awareness relied more on health professionals in general and family doctors in particular. In our study, suitability scores were the highest for family doctors, dietitians and education offices of the food sectorReference Van Dillen, Hiddink, Koelen, De Graaf and Van Woerkum32. In another study, family doctors and dietitians were also the leading information sourcesReference Hiddink, Hautvast, Van Woerkum, Fieren and Van’t Hof12. Contradictory to another studyReference Girois, Kumanyika, Morabia and Mauger27, health awareness and nutrition awareness were negatively associated. Apparently nutrition awareness deals with a very specific part of health awareness, which suggests that further investigation is needed.
Some relationships between nutrition-related behaviours and nutrition awareness were expressed, especially for fruits and vegetables. According to previous studiesReference Krebs-Smith, Heimendinger, Patterson, Subar, Kessler and Pivonka37, Reference Van Duyn, Kristal, Dodd, Campbell, Subar and Stables38, awareness is strongly associated with increased fruit and vegetable intake. Respondents with high nutrition awareness ate more often, following recommendations, whereas people with low nutrition awareness overruled the recommendations by eating too much carbohydrate (e.g. bread and potatoes) and fat (e.g. cheese and meat). Possibly, adults with high nutrition awareness more often choose alternatives: rice, pasta and meat-replacements.
There were some limitations. First, women were overrepresented in this study. Second, on the basis of the cross-sectional design, one cannot make predictions about causality between correlates and nutrition awareness. Moreover, nutrition-related behaviours were not measured with a food-frequency questionnaire. In general, in comparison with surveys in the population, the response rate of surveys with a panel such as we carried out is higher and the control over the non-response is better (higher response rate on the non-response questionnaire and known demographics of the non-response). However, we cannot exclude potential sampling bias, as members of the panel (although representative of the Dutch population with regard to gender, age, education level and residence) may differ from members of the population in other ways.
Implications for research and practice
The value of our study lies in its unravelling of the concept of nutrition awareness. Understanding the correlates can contribute to a more effective application of behavioural change modelsReference Weinstein6, Reference Prochaska and Velicer7. Most behaviour change interventions are designed for individuals who are already prepared for actionReference Campbell, deVellis, Strecher, Ammerman, deVellis and Sandler39. However, action-oriented advice is inappropriate for people who are still unaware of personal risk behaviour. Communication strategies such as feedback, education and media campaignsReference Prochaska and Velicer7 aimed at raising consciousness can effect a shift from pre-contemplation (unaware) to contemplation (aware) stage.
Our study has shown involvement with nutrition to be the most important correlate for nutrition awareness. Involvement can be increased by using the person’s name and other personal characteristics, and tailoring to the motivational stageReference Brug, Glanz, Van Assema, Kok and Van Breukelen40. Adults at pre-contemplation stage can be provided with personalised feedback, such as estimates of usual nutrient intakeReference Kristal, Glanz, Curry and Patterson41. Furthermore, comparisons with recommended and peer-group average intake levels can help adults make more realistic assessments, as applied in computer-tailoring and self-testsReference Oenema and Brug42.
Since adults with high nutrition awareness relied on the media, scientific organisations need to better engage and communicate with the media. Moreover, a novel finding is that health professionals are especially appropriate for providing nutrition information to adults with low nutrition awareness. Appropriate nutrition training should be offered. The question remains as to whether health professionals are capable of motivating these patients. This demands further investigation.
Acknowledgements
Sources of funding: The study was funded by the Dutch Dairy Association.
Conflict of interest declaration: None.
Authorship responsibilities: All authors were participants of the project group of the project called ‘Nutrition Education through Health Professionals’. They were all involved in the design of the study, including the development of the questionnaire. G.J.H. and S.M.E.v.D. organised the data collection in cooperation with market research office GfK. S.M.E.v.D. was responsible for data analysis and M.A.K. helped to analyse the data. Furthermore, all authors contributed to the discussion of the results. Finally, S.M.E.v.D. wrote the manuscript and the other authors critically revised the manuscript.
Acknowledgements: We would like to thank the market research office GfK (Lianne van der Wijst and Kamieke van de Riet) for their collaboration in this research. We gratefully thank the participants for their time and contributions. Finally, we extend our appreciation to the Dutch Dairy Association for financial support.


