


Waist circumference is a proxy measure of abdominal fat mass and a strong predictor of obesity-related morbidity and mortality(Reference Ross, Berentzen and Bradshaw1). Fish consumption has been suggested to prevent obesity but the results are conflicting. Fish consumption is the major dietary source of the long-chain n-3 PUFA EPA (20 : 5n-3) and DHA (22 : 6n-3), which according to rodent experiments may reduce body fat mass and prevent obesity through alterations of gene expression that increase fat oxidation and energy expenditure and reduce fat deposition(Reference Buckley and Howe2). Moreover, it has been shown that pollock fish protein hydrolysate feeding, abundant in the amino acids taurine and glycine, results in higher circulating bile acid concentrations and reduced body fat mass, relative to soya protein feeding(Reference Liaset, Madsen and Hao3). The mechanisms were seemingly increased expression of genes involved in fat oxidation and energy expenditure. On the other hand, recent human studies have suggested that fish consumption has no appreciable association with body-weight gain (unpublished results). However, important changes in body composition and shape may occur without changes in weight. In two follow-up studies, the association between total fish consumption and subsequent change in waist circumference among women and men has been investigated(Reference Halkjaer, Sorensen and Tjonneland4, Reference Halkjaer, Tjonneland and Overvad5). In those studies, no appreciable associations have been found. In a randomised trial of overweight or obese women and men, the effect of including lean or fatty fish, or fish oil capsules, as part of an energy-restricted diet has been investigated(Reference Thorsdottir, Tomasson and Gunnarsdottir6). After 8 weeks, the decrease in waist circumference was statistically significantly greater in the groups receiving fish or fish oil capsules when compared with the control group receiving an isoenergetic energy-restricted diet without marine food, but among men only. A specific effect of long-chain n-3 PUFA may explain the results of the diets including fatty fish or fish oil but not the results of the diet including lean fish. Thus, the results from that study suggest that there are components of fish other than long-chain n-3 PUFA that may decrease waist circumference such as proteins and specific amino acids.
We investigated the association between fish consumption and subsequent change in waist circumference. Based on previous findings, we hypothesised that both total fish consumption and consumption of subgroups of fish (lean and fatty fish) are negatively associated with change in waist circumference. Sex, age and waist circumference at enrolment were considered as potential effect modifiers.
Materials and methods
Study design and population
In a follow-up study, we investigated the association between fish consumption and subsequent change in waist circumference. The study is a part of the Diet, Obesity and Genes (DiOGenes) project. The participants (n 146 543) were from six cohorts within five countries participating in the European Prospective Investigation into Cancer and Nutrition (EPIC): Aarhus/Copenhagen in Denmark; Potsdam in Germany; Florence in Italy; Amsterdam/Maastricht and Doetinchem in The Netherlands (as two separate cohorts due to differences in data collection methods); Cambridge in the UK(Reference Riboli and Kaaks7, Reference Riboli, Hunt and Slimani8). The participants were from the general population (the Aarhus/Copenhagen, Potsdam, Amsterdam/Maastricht, Doetinchem and Cambridge cohort) or screening clinic attendees (the Florence cohort)(Reference Riboli, Hunt and Slimani8). At enrolment, which took place between 1993 and 1998, information on anthropometry (height, weight and waist circumference), habitual diet, sociodemographic (sex, age, menopausal status and highest educational level achieved) and lifestyle (tobacco consumption, physical activity and alcohol consumption) characteristics, and medication (hormone replacement therapy use) was collected. Follow-up information on waist circumference was collected 3·7–9·9 years (median 5·5 years) after enrolment. The study was conducted according to the guidelines laid down in the Declaration of Helsinki, and all procedures involving human subjects were approved by the ethical review boards of the International Agency for Research on Cancer (Lyon in France) and all the local recruiting institutions. All participants provided written informed consent.
From the 146 543 participants enrolled across the six cohorts, our final study population consisted of 89 432 participants (58 % women), after exclusions. The exclusion criteria were as follows: no follow-up data available (primarily due to non-response at follow-up, n 44 197); pregnancy (n 133); missing information on diet (n 113); reported energy intake < 1 % or >99 % percentile of the ratio of reported energy intake to estimated energy requirement (n 1803); missing information on anthropometry or follow-up time (n 2022); extreme anthropometric data (height < 130 cm, BMI < 16 kg/m2, waist circumference < 40 cm or >160 cm, waist circumference < 60 cm if BMI >25 kg/m2, weight change >5 kg/year, or waist circumference change >7 cm/year, n 331); chronic disease (prevalent diabetes, cancer or CVD) at enrolment (n 8512). The rationale for exclusion of persons with chronic disease was the likelihood of changes in dietary habits and anthropometry as a result of diagnosis and treatment. In the subgroup analyses of lean and fatty fish, the Potsdam cohort was excluded because of the lack of sufficient detail in the questionnaire for classifying fish consumption into lean and fatty fish, leaving 73 125 persons (58 % women) in the analyses of lean and fatty fish consumption. A flowchart of the exclusion criteria is shown in the Fig. S1 of the supplementary material (available online at http://www.journals.cambridge.org/bjn).
Dietary assessments
Information on habitual dietary intake was collected at enrolment through country-specific self-administered FFQ developed and validated within the countries participating in the EPIC(Reference Riboli, Hunt and Slimani8). The FFQ were validated against twelve 24 h dietary recalls in two of the four countries(Reference Kaaks, Slimani and Riboli9). Averaged over subgroups by country and sex, the correlation coefficient between the individuals' average total fish consumption estimated from the 24 h recalls and total fish consumption estimated from the FFQ was 0·37. Lean fish was classified as fish with less than 4 g fat/100 g fish and fatty fish as fish with 4 g fat/100 g fish or more(Reference Welch, Lund and Amiano10). In a random sample of 6790 participants among the 89 432 participants, information on dietary intake was also collected through a standardised 24 h dietary recall interview using a software program (EPIC-SOFT) developed to standardise dietary intakes reported across the EPIC study centres(Reference Slimani, Kaaks and Ferrari11, Reference Slimani, Deharveng and Unwin12). Data collected through this method were used to account for potential measurement error introduced by the country-specific FFQ.
Anthropometric measurements
At enrolment, trained staff measured height, weight and waist circumference according to a pre-specified protocol in all six cohorts, with participants wearing no shoes and either light indoor clothing (Cambridge in the UK and Amsterdam/Maastricht and Doetinchem in The Netherlands) or underwear (Aarhus/Copenhagen in Denmark, Potsdam in Germany and Florence in Italy). Weight and waist circumference were adjusted to reduce heterogeneity due to protocol differences in clothing worn during measurement. For participants in light clothing, the adjustment was − 1 kg for weight and − 2·0 cm for waist circumference(Reference Haftenberger, Lahmann and Panico13). At follow-up, waist circumference measurements were performed as at enrolment in the Doetinchem and Cambridge cohorts. In the other cohorts, current waist circumference was self-measured by the participants and reported in a follow-up questionnaire. The accuracy of self-measured waist circumference by comparison with technician-measured waist circumference has been assessed previously, and self-measured waist circumference was found to be sufficiently accurate for identifying associations in epidemiological studies(Reference Spencer, Roddam and Key14, Reference Bigaard, Spanggaard and Thomsen15). The outcome measure was defined as waist circumference at follow-up minus waist circumference at enrolment expressed as average 1-year change. BMI was calculated as weight in kg divided by height in m2 (Reference Keys, Fidanza and Karvonen16).
Covariates
Information on sociodemographic and lifestyle characteristics and medication was collected through standardised questionnaires at enrolment. Smoking behaviour was defined as non-smokers, stable smokers, starting smokers and stopping smokers by using smoking information at enrolment and at follow-up. A four-level physical activity index (inactive, moderately inactive, moderately active and active) was derived by combining occupational physical activity together with time spent in biking and other physical exercise (such as keep fit, aerobics, swimming and jogging) over the past year(Reference Wareham, Jakes and Rennie17).
Statistical analyses
The associations between fish consumption (10 g/d) and 1-year change in waist circumference (cm) were investigated using mixed-effect linear regression with random effects on intercept, taking into account the clustering of the data within cohorts nested within countries. Analyses were carried out among all participants and separately for women and men. We fit two models. The covariates in model 1 were country, cohort and an indicator variable for fish consumption (consumers and non-consumers). Lean and fatty fish consumption were analysed in mutually adjusted models. The covariates in model 2 were the covariates in model 1 plus suggested risk factors for development of obesity: sex (all participants); age; height; weight; waist circumference at enrolment; menopausal status (pre-, peri- and post-menopausal; women only); hormone replacement therapy use (yes and no; women only); highest educational level achieved (no graduation, primary school, technical or professional school, secondary school, university degree and not specified); smoking behaviour (non-smokers, stable smokers, starting smokers and stopping smokers); physical activity level (inactive, moderately inactive, moderately active and active); total energy intake (including energy intake from alcohol consumption). Adjustment for continuous variables was done using restricted cubic spline regression. For categorical variables, missing values (n 1273 for hormone replacement therapy, n 1579 for education, n 1440 for smoking and n 3319 for physical activity) were treated as a separate category. By stratifying the data, possible effect modification by age (classified as age at enrolment of < 60 and ≥ 60 years) and waist circumference (classified as quartiles of waist circumference at enrolment) was investigated. We assessed the associations for fish consumption for non-linearity in restricted cubic spline regression models. No violations were detected (data not shown). To assess potential heterogeneity among the cohorts, analyses were rerun using mixed-effect linear regression with random effects on intercept and slope. No substantial heterogeneity was detected (data not shown).
Sensitivity analyses were performed by excluding persons with incident chronic disease during the follow-up and by excluding the Potsdam cohort from the analyses of total fish consumption and change in waist circumference. In order to adjust for potential systematic over- or underestimation of fish consumption measurements by the country-specific FFQ, the analyses were rerun using predicted fish consumption data obtained from the regression of the standardised 24 h dietary recall interview measurements on the country-specific FFQ measurements(Reference Ferrari, Day and Boshuizen18). Covariates as listed above (model 2), the season of the year in which the 24 h dietary recall interview was collected, and a cross-product term between cohort and FFQ were included in the prediction model. The standard errors of the coefficients were estimated using bootstrap sampling (300 loops). Data analyses were performed using Stata statistical software, release 10.1 (Stata Corporation).
Results
Characteristics of the study population are shown in Table 1. The median follow-up time was 5·5 years (80 % central range 4·0, 9·9) among women and 5·4 years (80 % central range: 3·9, 9·7) among men.
Table 1 Characteristics of the study population
(Medians and 80 % central ranges)

* In the subgroup analyses of lean and fatty fish, the Potsdam cohort in Germany was excluded because of the lack of sufficient detail in the questionnaire for classifying fish consumption into lean and fatty fish.
Table 2 shows the associations between fish consumption and subsequent change in waist circumference among all participants and separately for women and men. Among all participants, the annual waist circumference change was − 0·01 cm/10 g higher total fish consumption per d (95 % CI − 0·01, 0·00) and − 0·01 cm/10 g higher fatty fish consumption per d (95 % CI − 0·02, − 0·01). Lean fish consumption was not associated with change in waist circumference. Using calibrated fish consumption data did not systematically change the observed associations, but the 95 % CI became slightly wider (Table 2). The results in subgroups analyses stratified by sex were not systematically different; neither were the results when stratified by age (Table 3) or waist circumference at enrolment (Table 4). Also the results from analyses among persons with and without incident chronic disease during the follow-up were not systematically different (data not shown). Finally, exclusion of the Potsdam cohort from the analyses of total fish consumption and change in waist circumference attenuated the observed weak negative associations (data not shown).
Table 2 Association between fish consumption and 1-year change in waist circumference
(β Coefficients and 95 % confidence intervals)
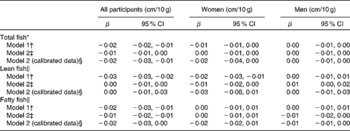
* n 89 432 for all participants, n 52 307 for women and n 37 125 for men.
† From multilevel mixed-effect linear regression with random effects on intercept, taking into account the clustering of the data within cohorts nested within countries plus adjusting for an indicator variable for fish consumption. Lean and fatty fish consumption were analysed in mutually adjusted models.
‡ Model 1 plus adjusting for sex (all participants), age, height, weight, waist circumference at enrolment, menopausal status (women only), hormone replacement therapy use (women only), highest educational level achieved, smoking behaviour, physical activity level and total energy intake.
§ In order to adjust for potential systematic over- or underestimation of fish consumption measurements by the country-specific FFQ, the analyses were rerun using predicted fish consumption data obtained from the regression of standardised 24 h dietary recall interview measurements on the country-specific FFQ measurements. Covariates as listed above (model 2), the season of the year in which the 24 h dietary recall interview was collected and a cross-product term between cohort and FFQ were included in the prediction model. The standard errors of the coefficients were estimated using bootstrap sampling (300 loops).
∥ n 73 125 for all participants, n 42 214 for women and n 30 911 for men.
Table 3 Association between fish consumption and 1-year change in waist circumference stratified by age at enrolment
(β Coefficients and 95 % confidence intervals)
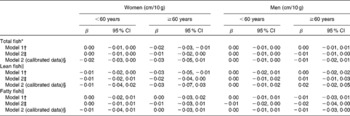
* n 40 922 for women aged < 60 years and n 11 385 for women aged ≥ 60 years; n 28 431 for men aged < 60 years and n 8694 for men aged ≥ 60 years.
† From multilevel mixed-effect linear regression with random effects on intercept, taking into account the clustering of the data within cohorts nested within countries plus adjusting for an indicator variable for fish consumption. Lean and fatty fish consumption were analysed in mutually adjusted models.
‡ Model 1 plus adjusting for sex (all participants), age, height, weight, waist circumference at enrolment, menopausal status (women only), hormone replacement therapy use (women only), highest educational level achieved, smoking behaviour, physical activity level and total energy intake.
§ In order to adjust for potential systematic over- or underestimation of fish consumption measurements by the country-specific FFQ, the analyses were rerun using predicted fish consumption data obtained from the regression of standardised 24 h dietary recall interview measurements on the country-specific FFQ measurements. Covariates as listed above (model 2), the season of the year in which the 24 h dietary recall interview was collected and a cross-product term between cohort and FFQ were included in the prediction model. The standard errors of the coefficients were estimated using bootstrap sampling (300 loops).
∥ n 32 401 for women aged < 60 years and n 9813 for women aged ≥ 60 years; n 23 436 for men aged < 60 years and n 7475 for men aged ≥ 60 years.
Table 4 Association between fish consumption and 1-year change in waist circumference stratified by waist circumference at enrolment
(β Coefficients and 95 % confidence intervals)
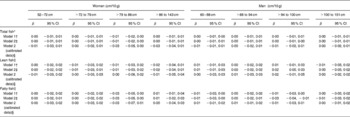
* n 13 524 for women with waist circumference of 52–72 cm, n 13 400 for women with waist circumference of >72 to 79 cm, n 13 001 for women with waist circumference of >79 to 86 cm and n 12 382 for women with waist circumference of >86 to 143 cm; n 9646 for men with waist circumference of 60–88 cm, n 9465 for men with waist circumference of >88 to 94 cm, n 9646 for men with waist circumference of >94 to 100 cm and n 8368 for men with waist circumference of >100 to 151 cm.
† From multilevel mixed-effect linear regression with random effects on intercept, taking into account the clustering of the data within cohorts nested within countries plus adjusting for an indicator variable for fish consumption. Lean and fatty fish consumption were analysed in mutually adjusted models.
‡ Model 1 plus adjusting for sex (all participants), age, height, weight, waist circumference at enrolment, menopausal status (women only), hormone replacement therapy use (women only), highest educational level achieved, smoking behaviour, physical activity level and total energy intake.
§ In order to adjust for potential systematic over- or underestimation of fish consumption measurements by the country-specific FFQ, the analyses were rerun using predicted fish consumption data obtained from the regression of standardised 24 h dietary recall interview measurements on the country-specific FFQ measurements. Covariates as listed above (model 2), the season of the year in which the 24 h dietary recall interview was collected and a cross-product term between cohort and FFQ were included in the prediction model. The standard errors of the coefficients were estimated using bootstrap sampling (300 loops).
∥ n 10 813 for women with waist circumference of 52–72 cm, n 10 850 for women with waist circumference of >72 to 79 cm, n 10 618 for women with waist circumference of >79 to 86 cm and n 9933 for women with waist circumference of >86 to 143 cm; n 8044 for men with waist circumference of 60–88 cm, n 7913 for men with waist circumference of >88 to 94 cm, n 8053 for men with waist circumference of >94 to 100 cm and n 6901 for men with waist circumference of >100 to 151 cm.
Discussion
In the present study, with participation from five European countries, fish consumption was weakly negatively associated with subsequent change in waist circumference accounted for by fatty fish consumption. Expressed in terms of portion sizes, the annual waist circumference change was − 0·03 cm per one portion size (140 g) higher fatty fish consumption per week (95 % CI − 0·04, − 0·01). The association is thus without any implications at the individual level and probably with minor, if any, implications at the population level.
We used data from different populations with different diets, which allowed us to investigate the association between fish consumption and subsequent change in waist circumference among women and men and over a wide range of exposures (6–61 g fish/d among women and 7–71 g fish/d among men). Exclusions were primarily due to non-response at follow-up. Non-response may be related to either the exposure to fish consumption or to the change in waist circumference but most probably not to both the exposure to fish consumption and the change in waist circumference. Thus, selection bias is unlikely to have affected the results. Measurement error may have affected the results. In order to adjust for potential systematic over- or underestimation of fish consumption measurements by the FFQ, the analyses were rerun using calibrated fish consumption data. This did, however, not systematically change the observed associations, but the 95 % CI became slightly wider. At enrolment, waist circumference was measured by trained staff but at follow-up, information on waist circumference was self-measured by the participants in most centres. Most probably, however, the reporting of follow-up waist circumference was not related to the exposure to fish consumption. Thus, information bias is of limited concern. Detailed information on the potential confounders reduces the possibility of residual confounding. However, confounding from other risk factors for development of obesity not taken into account remains a possible explanation for the findings. Adjustment for total energy intake has two implications: first, non-energy effects of fish consumption are investigated and, second, a substitution model is introduced. Fish consumption and food choices associated with fish consumption may replace food choices, which potentially affect body composition and shape, but in the present study, the replacement foods were not specified. To address this issue, future studies should specify in more details the substitutions of foods.
The principal long-chain n-3 PUFA in the diet are EPA and DHA, with fish consumption being the main source of long-chain n-3 PUFA. In a clinical trial, the substitution of fish oil capsules (1·8 g long-chain n-3 PUFA/d) for visible fats (butter, olive oil, sunflower oil and peanut oil) statistically significantly decreased body fat mass among healthy young adults(Reference Couet, Delarue and Ritz19). Furthermore, the substitution of fish oil for visible fat increased basal fat oxidation, suggesting that long-chain n-3 PUFA may to some extent modulate the partitioning of fat between oxidation and deposition.
The findings of no appreciable associations between fish consumption and change in waist circumference are in agreement with previous follow-up studies(Reference Halkjaer, Sorensen and Tjonneland4, Reference Halkjaer, Tjonneland and Overvad5). The present results, however, cannot be considered completely independent of the results from the follow-up study by Halkjaer et al. (Reference Halkjaer, Tjonneland and Overvad5), as the present study was partly based on the same participants. In a randomised trial of overweight or obese women and men, the effect of including lean fish (0·3 g long-chain n-3 PUFA/d), fatty fish (3·0 g long-chain n-3 PUFA/d) or fish oil capsules (1·5 g long-chain n-3 PUFA/d), as part of an energy-restricted diet, has been investigated(Reference Thorsdottir, Tomasson and Gunnarsdottir6). After 8 weeks, the decrease in waist circumference was statistically significantly greater in the groups receiving fish or fish oil capsules when compared with the control group receiving an isoenergetic energy-restricted diet without marine food, but among men only. A specific effect of long-chain n-3 PUFA may explain the results of the diets including fatty fish or fish oil but not the results of the diet including lean fish. Thus, the results from that study suggest that there are components of fish other than long-chain n-3 PUFA that may decrease waist circumference such as proteins and specific amino acids. However, in the present study, the weak negative association between fish consumption and change in waist circumference was accounted for by fatty fish consumption. The clinical trials(Reference Thorsdottir, Tomasson and Gunnarsdottir6, Reference Couet, Delarue and Ritz19) used high pharmacological doses of long-chain n-3 PUFA to ensure maximal therapeutic effects, but failed to provide information on potential threshold effects, particularly with respect to lower intakes compatible with median intakes in the general population which has been estimated to be 0·57 g/d among women and 0·70 g/d among men(Reference Joensen, Schmidt and Dethlefsen20). In the present study, we found no appreciable associations between fish consumption and change in waist circumference within the wide range of exposure in the general population.
The association between fish consumption as a proxy for intake of long-chain n-3 PUFA and body fat mass may depend on the size of the fat mass at enrolment. The size of the fat mass measured as waist circumference at enrolment was considered as a potential effect modifier in the present study. Sex and age were also considered as potential effect modifiers due to sex- and age-related differences in the size of the fat mass. However, the present study did not suggest systematic differences in the associations across strata of sex, age or waist circumference at enrolment.
In conclusion, the present study provides evidence to support that fish consumption does not prevent increase in waist circumference.
Acknowledgements
This study is part of the DiOGenes project, which is a pan-European study within the European Union Sixth Framework Programme for Research and Technological Development (2005–9; Contract FOOD-CT-2005-513946, http://www.diogenes-eu.org/). This integrated programme was set up to target the issue of obesity problem from a dietary perspective, seeking new insights and new routes to prevention. We thank the EPIC study investigators. Furthermore, this study is part of the project Hepatic and Adipose Tissue and Functions in the Metabolic Syndrome (www.hepadip.org), which is supported by the European Commission as an Integrated Project under the Sixth Framework Programme (contract LSHM-CT-2005-018734), and part of the research programme of the Danish Obesity Research Centre (www.danorc.dk), which is supported by the Danish Council for Strategic Research (contract 2101-06-0005). None of the authors had any conflicts of interest. M. U. J., E. J. M. F., T. I. A. S and K. O. designed the research; A. T., H. B., D. P., N. J. W. and K. O. collected the data; K. M. D. and C. D. performed the statistical analysis; M. U. J., K. M. D., C. D., J. H., C. H., N. G. F., A. T., H. B., B. B., D. P., G. M., H. D., D. L. v. d. A., N. J. W., E. J. M. F., T. I. A. S and K. O. wrote the manuscript; M. U. J. had primary responsibility for the final content. All authors read and approved the final manuscript.


