
Abstract
Mass peak alignment (ion-wise alignment) has recently become a popular method for unsupervised data analysis in untargeted metabolic profiling. Here we present MSClust—a software tool for analysis GC–MS and LC–MS datasets derived from untargeted profiling. MSClust performs data reduction using unsupervised clustering and extraction of putative metabolite mass spectra from ion-wise chromatographic alignment data. The algorithm is based on the subtractive fuzzy clustering method that allows unsupervised determination of a number of metabolites in a data set and can deal with uncertain memberships of mass peaks in overlapping mass spectra. This approach is based purely on the actual information present in the data and does not require any prior metabolite knowledge. MSClust can be applied for both GC–MS and LC–MS alignment data sets.
1 Introduction
In both GC–MS and LC–MS-based metabolomics platforms, untargeted data analysis using unbiased mass peak acquisition followed by their chromatographic alignment, i.e. ion-wise alignment, has become a popular approach for comparative metabolomics. Software tools that can implement this approach, such as MetAlign (Bamba and Fukusaki 2006; Boccard et al. 2010; De Vos et al. 2007; Ducruix et al. 2008; Keurentjes et al. 2006; Lommen 2009; Lommen et al. 2007; Mal et al. 2009; Peters et al. 2009; Rijk et al. 2009; Tikunov et al. 2005; Tikunov et al. 2010; Vorst et al. 2005), MZMine (Katajamaa et al. 2006), or XCMS (Kind et al. 2007; Nordström et al. 2006; Smith et al. 2006; Wikoff et al. 2007), are nowadays widely used in metabolomics studies. They are used for primary processing of raw GC–MS or LC–MS chromatograms (Fig. 1) and they enable a comprehensive comparative analysis of complex metabolic mixtures by aligning quantitative values of individual mass peaks across samples analyzed. Resulting data matrices can be directly subjected to comparative analysis using various statistical tools. However, this approach has a few drawbacks. Firstly, the resulting mass peak alignment matrices are often extremely large with a disproportionate variable-to-sample ratio, as the amount of variables (i.e. detected mass peaks) may reach tens of thousands. Up to 90% of the variables may be redundant, since each metabolite will be represented by a number of different mass peaks, including molecular fragments, adducts, molecular fragments and isotopes thereof. Moreover, this redundancy may vary between profiling platforms and metabolites, depending upon their concentration, ionization efficiency and specific chemical nature. This leads to an unequal representation of metabolites in the dataset and complicates subsequent multivariate or statistical analyses. Secondly, a direct interpretation of the experimental results is hardly possible, because both the structural information of a metabolite, such as a mass spectrum in case of GC–MS and in-source fragments in case of LC–MS, is not provided directly as a result of the alignment.

A general workflow of a comparative metabolomics data analysis which is based on mass peak alignment approach. MSClust receives a mass peak alignment data matrix of size M × S, where M is a number of mass peaks (often tens thousands) aligned across a number of samples profiled S. As the result it produces a reduced data matrix of size C × S, where C a number of putative compounds each represented by a single mass peak (normally a few hundred) aligned across the same number of samples S. Besides, it extracts a mass spectra for each of the compounds C, that in case of GC–MS data is compatible with the NIST MSSearch compound identification software
Previously, we have reported a mass signal correlation analysis approach that can reduce the metabolite signal redundancy in untargeted ion-wise aligned GC–MS datasets and to extract mass spectra of individual metabolites without using mass spectral libraries or other structural sources (Tikunov et al. 2005). Here we present a computational implementation of this approach—MSClust. In an untargeted metabolomics data analysis workflow it can be placed between the mass peak alignment step and metabolite identification followed by data interpretation. MSClust clusters the aligned mass peaks into reconstructed metabolites, thereby (i) reducing the signal redundancy per metabolite into single representative variables, and (ii) reconstructing original mass spectra, thus providing structural information of the metabolites. This MSClust software tool can be applied to both GC–MS and LC–MS-derived datasets, and for both nominal mass and accurate mass data. The MSClust tool aligns with the Metabolomics Standards Initiative for data processing.
2 Method and implementation
The MSClust algorithm aims to remove metabolite signal redundancy in aligned mass peaks tables and to retrieve mass spectral information of metabolites using mass peak clustering. Many clustering methods, e.g. k-means or c-means clustering, self-organizing maps etc., require prior knowledge about a number of clusters in the data. Therefore, these methods cannot be used for chromatography-mass spectrometry data clustering as a number of metabolites is unknown and may vary from tens to hundreds from experiment to experiment. The subtractive fuzzy clustering (Chiu 1994) implemented in the MSClust algorithm allows unsupervised determination of a number of clusters and simultaneous clustering of mass peaks in the mass peak alignment data. The algorithm of MSClust performs clustering of ion-fragments in the dataset that originate from a single metabolite, based on two properties: (i) similarity of chromatography, i.e. retention time span covered by a chromatographic peak of a metabolite, and (ii) quantitative similarity of ion-fragment patterns across a number of samples analyzed. The algorithm performs the following tasks:
-
(1)
A number of mass peak clusters (putative metabolites) present in an ion-wise alignment data matrix and cluster centers (centrotype mass peaks) are determined in an unsupervised manner using the potential density (PD) method (Chiu 1994) (Fig. 2A, B) (for detailed explanation of the algorithm see User Manual, Supplemental Data).
Fig. 2 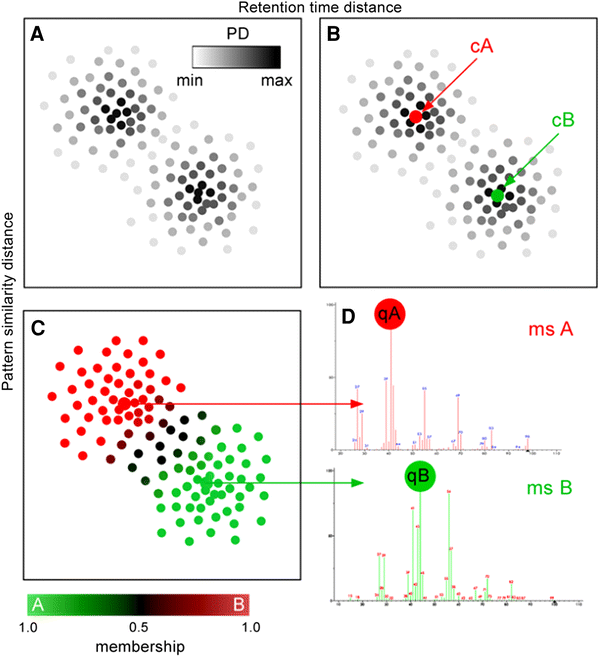
The schema illustrates basic steps of the MSClust algorithm. A—computing PD of each ion fragment based on two distances: the retention time distance between mass peak peak apices (determined by an alignment software) (X-axis of A, B and C) and an intensity pattern similarity distance (Y-axis of A, B and C). The more close neighbours an mass peak has in the two-dimensional feature space, the higher its PD is (the darker its dot in plot A). B—selection of ‘centrotype’ ion fragments as centres of clusters (cA and cB). C—classification: computing memberships of each ion fragment in the cluster centers. The dots depicted in brown have uncertain (intermediate) membership and can represent mass peaks common for cA and cB. D—conversion of clustering results into reconstructed mass spectra (‘ms A’ and ‘ms B’) and selection of most representative mass peaks (‘qA’ and ‘qB’). The red-green color scale below reflects the membership of mass peaks in cluster A (green) and B (red)
-
(2)
All mass peaks are clustered around the centers of their cluster (centrotypes) using a subtractive fuzzy clustering method (Chiu 1994). This clustering approach allows each mass signal to have multiple cluster memberships, which resembles situations where two or more co-eluting compounds produce similar masses, so that the quantitative information of these common masses can be mixed and membership in the overlapping compound mass spectra is uncertain (fuzzy) (Fig. 2C). A conventional binary (‘certain’) clustering would assign an ion-fragment common to all overlapping compounds only to the single mass spectrum to which it correlates the most, resulting in incomplete mass spectra of the other overlapping compounds. The fuzzy clustering method enables sharing of common ion-fragments between overlapping mass spectra by allowing multiple cluster memberships.
-
(3)
Mass peak clusters are converted into a putative compound mass spectra list that in case of GC–MS is directly compatible with the NIST mass spectra library search tool (Fig. 2D).
-
(4)
A single representative mass peak is selected from each putative mass spectrum based on its abundance and cluster membership, so that each putative compound extracted from the biological sample can be represented by one representative variable in further multivariate statistical analysis (Fig. 2D).

The algorithm was implemented in C++ as a Microsoft Windows application and the graphical user interface was created using Borland C++ Builder, version 6.
3 Results
The performance of MSClust was evaluated using two different types of chromatography-mass spectrometry datasets, originating from untargeted metabolic profiling of ripe fruits of 94 different tomato cultivars: (i) nominal mass GC–MS data of volatile compounds originating from GC separation coupled to quadrupole-MS with 70 eV electron impact ionization (Tikunov et al. 2005; 2010); (ii) accurate mass LC–MS data of semi-polar non-volatile compounds originating from C18-reversed phase HPLC separation coupled to high resolution QTOF-MS operating in negative mode with 10 eV electrospray ionization (De Vos et al. 2007; Tikunov et al. 2010). Both the GC–MS and LC–MS mass peaks were extracted from the chromatograms and aligned using MetAlign software. Resulting outputs of other alignment programs were not tested, but we anticipate that their outputs can be readily processed by MSClust after convertion to the text format used by MSClust (see User Manual).
3.1 GC–MS dataset
The MetAlign-assisted alignment of the 94 GC–MS chromatograms obtained by headspace analysis of tomato fruits and subsequent data filtering (see Supplemental User Manual) resulted in a data matrix with the relative abundances of 6,618 mass signals aligned across all samples. Using MSClust, 237 mass signal clusters, representing 237 reconstructed compounds and their mass spectra, in this experiment with a threshold of at least five ion-fragments per spectrum, were extracted from the complete data matrix within 10 s. The mass spectra retrieved were then subjected to putative identification by matching to the NIST07 mass spectral library using the NIST MSSearch software. Of the 45 volatile compounds previously identified using authentic standards (Tikunov et al. 2005), 42 compounds (i.e. 93%) were found back by matching their reconstructed MSClust mass spectra to the NIST07 mass spectral library. Using a reference series of alkanes, the experimental retention indices (RI) were determined for all 237 putative compounds and for 114 compounds their RIs were also provided by the NIST library. For 87% of these 114 compounds the deviation of the experimentally observed RI from the published NIST library RI was less than 3.3%, which was about the largest RI deviation we measured within the series of 45 unambiguously identified compounds (Supplemental Table I).
3.2 LC–MS dataset
Despite using a lower ionization energy, there is unavoidably some mass redundancy in LC–MS data sets due to the presence of natural isotopes as well as to unintended but inevitably occurring metabolite fragmentation and/or adduct formation. This redundancy is a key, however, to the use of MSClust in LC–MS datasets. The alignment of the 94 high mass resolution LC-QTOF-MS chromatograms tested resulted in a data matrix of 1,092 mass signals aligned across all samples. MSClust extracted 179 clusters with at least two ions per metabolite. Comparison of the mass signals in some clusters corresponding to known tomato metabolites with LC–MS mass spectral databases and other experimental tomato fruit data (Iijima et al. 2008; Moco et al. 2006; Tikunov et al. 2010) indicated that the mass peaks known to originate from the same metabolite, including the molecular ion, fragments, adducts and their natural isotopes, were successfully grouped together into the same reconstructed metabolite (see Supplemental Table II). The exact mass difference between mass signals enables the annotation of each ion detected, thereby facilitating the identification of the molecular ion to be searched for in in-house mass-retention time databases or publicly available mass databases, for instance MotoDB (http://appliedbioinformatics.wur.nl/moto/) and the Komics DB (http://webs2.kazusa.or.jp/komics) in the case of tomato fruit, or in the Human Metabolite DB (www.hmdb.ca), MassBank (www.massbank.jp) and the Dictionary of Natural Products (http://dnp.chemnetbase.com). The unintended ion source or collision cell-induced fragmentation, if present, can provide additional information about the structure of the metabolite underlying the cluster of mass peaks.
References
Bamba, T., & Fukusaki, E. (2006). Technical problems and practical operations in plant metabolomics. Journal of Pesticide Science, 31, 300–304.
Boccard, J., Veuthey, J. L., & Rudaz, S. (2010). Knowledge discovery in metabolomics: An overview of MS data handling. Journal of Separation Science, 33, 290–304.
Chiu, S. L. (1994). Fuzzy model identification based on cluster estimation. Journal of Intelligent and Fuzzy Systems, 2, 267–278.
De Vos, R. C. H., Moco, S., Lommen, A., Keurentjes, J. J. B., Bino, R. J., & Hall, R. D. (2007). Untargeted large-scale plant metabolomics using liquid chromatography coupled to mass spectrometry. Nature Protocols, 2, 778–791.
Ducruix, C., Vailhen, D., Werner, E., Fievet, J. B., Bourguignon, J., Tabet, J. C., et al. (2008). Metabolomic investigation of the response of the model plant Arabidopsis thaliana to cadmium exposure: Evaluation of data pretreatment methods for further statistical analyses. Chemometrics and Intelligent Laboratory Systems, 91, 67–77.
Iijima, Y., Nakamura, Y., Ogata, Y., Tanaka, K., Sakurai, N., Suda, K., et al. (2008). Metabolite annotations based on the integration of mass spectral information. Plant Journal, 54, 949–962.
Katajamaa, M., Miettinen, J., & Oresic, M. (2006). MZmine: Toolbox for processing and visualization of mass spectrometry based molecular profile data. Bioinformatics, 22, 634–636.
Keurentjes, J. J. B., Fu, J., De Vos, C. H. R., Lommen, A., Hall, R. D., Bino, R. J., et al. (2006). The genetics of plant metabolism. Nature Genetics, 38, 842–849.
Kind, T., Tolstikov, V., Fiehn, O., & Weiss, R. H. (2007). A comprehensive urinary metabolomic approach for identifying kidney cancerr. Analytical Biochemistry, 363, 185–195.
Lommen, A. (2009). Metalign: Interface-driven, versatile metabolomics tool for hyphenated full-scan mass spectrometry data preprocessing. Analytical Chemistry, 81, 3079–3086.
Lommen, A., van der Weg, G., van Engelen, M. C., Bor, G., Hoogenboom, L. A. P., & Nielen, M. W. F. (2007). An untargeted metabolomics approach to contaminant analysis: Pinpointing potential unknown compounds. Analytica Chimica Acta, 584, 43–49.
Mal, M., Koh, P. K., Cheah, P. Y., & Chan, E. C. Y. (2009). Development and validation of a gas chromatography/mass spectrometry method for the metabolic profiling of human colon tissue. Rapid Communications in Mass Spectrometry, 23, 487–494.
Moco, S., Bino, R. J., Vorst, O., Verhoeven, H. A., De Groot, J., Van Beek, T. A., et al. (2006). A liquid chromatography-mass spectrometry-based metabolome database for tomato. Plant Physiology, 141, 1205–1218.
Nordström, A., O’Maille, G., Qin, C., & Siuzdak, G. (2006). Nonlinear data alignment for UPLC–MS and HPLC–MS based metabolomics: Quantitative analysis of endogenous and exogenous metabolites in human serum. Analytical Chemistry, 78, 3289–3295.
Peters, S., Van Velzen, E., & Janssen, H. G. (2009). Parameter selection for peak alignment in chromatographic sample profiling: Objective quality indicators and use of control samples. Analytical and Bioanalytical Chemistry, 394, 1273–1281.
Rijk, J. C. W., Lommen, A., Essers, M. L., Groot, M. J., Van Hende, J. M., Doeswijk, T. G., et al. (2009). Metabolomics approach to anabolic steroid urine profiling of bovines treated with prohormones. Analytical Chemistry, 81, 6879–6888.
Smith, C. A., Want, E. J., O’Maille, G., Abagyan, R., & Siuzdak, G. (2006). XCMS: Processing mass spectrometry data for metabolite profiling using nonlinear peak alignment, matching, and identification. Analytical Chemistry, 78, 779–787.
Tikunov, Y., Lommen, A., De Vos, C. H. R., Verhoeven, H. A., Bino, R. J., Hall, R. D., et al. (2005). A novel approach for nontargeted data analysis for metabolomics. Large-scale profiling of tomato fruit volatiles. Plant Physiology, 139, 1125–1137.
Tikunov, Y. M., de Vos, R. C. H., Paramas, A. M. G., Hall, R. D., & Bovy, A. G. (2010). A role for differential glycoconjugation in the emission of phenylpropanoid volatiles from tomato fruit discovered using a metabolic data fusion approach. Plant Physiology, 152, 55–70.
Vorst, O., de Vos, C. H. R., Lommen, A., Staps, R. V., Visser, R. G. F., Bino, R. J., et al. (2005). A non-directed approach to the differential analysis of multiple LC–MS-derived metabolic profiles. Metabolomics, 1, 169–180.
Wikoff, W. R., Gangoiti, J. A., Barshop, B. A., & Siuzdak, G. (2007). Metabolomics identifies perturbations in human disorders of propionate metabolism. Clinical Chemistry, 53, 2169–2176.
Acknowledgments
This work was supported by the Centre of BioSystems Genomics and the Netherlands Metabolomics Centre, both are part of the Netherlands Genomics Initiative/Netherlands Organization for Scientific Research.
Open Access
This article is distributed under the terms of the Creative Commons Attribution Noncommercial License which permits any noncommercial use, distribution, and reproduction in any medium, provided the original author(s) and source are credited.
Author information
Authors and Affiliations
Corresponding author
Additional information
Availability and implementation
MSClust is freely available for non-commercial users at http://www.metalign.nl.
Electronic supplementary material
Below is the link to the electronic supplementary material.
Rights and permissions
Open Access This is an open access article distributed under the terms of the Creative Commons Attribution Noncommercial License (https://creativecommons.org/licenses/by-nc/2.0), which permits any noncommercial use, distribution, and reproduction in any medium, provided the original author(s) and source are credited.
About this article
Cite this article
Tikunov, Y.M., Laptenok, S., Hall, R.D. et al. MSClust: a tool for unsupervised mass spectra extraction of chromatography-mass spectrometry ion-wise aligned data. Metabolomics 8, 714–718 (2012). https://doi.org/10.1007/s11306-011-0368-2
Received:
Accepted:
Published:
Issue Date:
DOI: https://doi.org/10.1007/s11306-011-0368-2