Fine-Scale Tracking of Ambient Temperature and Movement Reveals Shuttling Behavior of Elephants to Water
 Maria Thaker
 Pratik R. Gupte
 Herbert H. T. Prins
 Rob Slotow
 Abi T. Vanak
- 1Centre for Ecological Sciences, Indian Institute of Science, Bangalore, India
- 2School of Life Sciences, University of Kwazulu-Natal, Pietermaritzburg, South Africa
- 3Ashoka Trust for Research in Ecology and the Environment, Bangalore, India
- 4Groningen Institute for Evolutionary Life Sciences, University of Groningen, Groningen, Netherlands
- 5Department of Coastal Systems, Royal Netherlands Institute for Sea Research, Texel, Netherlands
- 6Resource Ecology Group, Wageningen University, Wageningen, Netherlands
- 7Department of Genetics, Evolution and Environment, University College, London, United Kingdom
- 8DBT/Wellcome Trust India Alliance, Hyderabad, India
Movement strategies of animals have been well studied as a function of ecological drivers (e.g., forage selection and avoiding predation) rather than physiological requirements (e.g., thermoregulation). Thermal stress is a major concern for large mammals, especially for savanna elephants (Loxodonta africana), which have amongst the greatest challenge for heat dissipation in hot and arid environments. Therefore, elephants must make decisions about where and how fast to move to reduce thermal stress. We tracked 14 herds of elephant in Kruger National Park (KNP), South Africa, for 2 years, using GPS collars with inbuilt temperature sensors to examine the influence of temperature on movement strategies, particularly when accessing water. We first confirmed that collar-mounted temperature loggers captured hourly variation in relative ambient temperatures across the landscape, and, thus, could be used to predict elephant movement strategies at fine spatio-temporal scales. We found that elephants moved slower in more densely wooded areas, but, unexpectedly, moved faster at higher temperatures, especially in the wet season compared to the dry season. Notably, this speed of movement was highest when elephants were approaching and leaving water sources. Visits to water showed a periodic shuttling pattern, with a peak return rate of 10–30 h, wherein elephants were closest to water during the hotter times of the day, and spent longer at water sources in the dry season compared to the wet season. When elephants left water, they showed low fidelity to the same water source, and traveled farther in the dry season than in the wet season. In KNP, where water is easily accessible, and the risk of poaching is low, we found that elephants use short, high-speed bursts of movement to get to water at hotter times of day. This strategy not only provides the benefit of predation risk avoidance, but also allows them to use water to thermoregulate. We demonstrate that ambient temperature is an important predictor of movement and water use across the landscape, with elephants responding facultatively to a “landscape of thermal stress.”
Introduction
Ranging behavior of mammals is influenced by an optimization of multiple ecological drivers, from maximizing resource acquisition and habitat selection (Fortin et al., 2003; Bastille-Rousseau et al., 2018), to minimizing predation risk and competition (Valeix et al., 2009; Thaker et al., 2011; Vanak et al., 2013). We have a strong understanding of movement strategies based on the ecology of animals, but the importance of animal physiology in driving movements is becoming increasingly apparent. For example, the energetics of movement strongly influence how terrestrial carnivores use terrain and other habitat features during hunting (Scantlebury et al., 2014; Williams et al., 2014; Bryce et al., 2017). Similarly, the intensity of locomotion (number of strokes) of Weddell seals (Leptonychotes weddellii) directly affects post-dive oxygen consumption (Williams et al., 2004). In ungulates, adaptation to temperature fluctuations influence activity patterns (Hetem et al., 2011; Shrestha et al., 2012) and in savanna elephants (Loxodonta africana), chronic stress can restrict the home-ranges of herds and increase use of refugia (Jachowski et al., 2012, 2013; Wato et al., 2016). With advances in animal telemetry allowing for the incorporation of a range of sensors (Kays et al., 2015), and the rapidly developing field of movement ecology (Nathan et al., 2008), we now have an opportunity to understand movement strategies not only as an outcome of balancing ecological drivers, but as a function of physiological requirements and constraints.
One of the strongest drivers of how animals use their environment is ambient temperature (Shrestha et al., 2014; Mitchell et al., 2018). Animals respond to environmental temperature by thermoregulating with physiological adaptations and behavioral strategies (Angilletta, 2009). Most desert dwelling mammals have multiple physiological adaptations to reduce water loss (Cain et al., 2006; Fuller et al., 2014), but they also shift their activity peaks to cooler times of the day or are nocturnal (Walsberg, 2000; Aublet et al., 2009). Occupying habitats or using environmental features that either promote heat loss, such as water sources, or reduce heat gain, such as shade under dense vegetation, constitutes an important class of behavioral responses to heat stress. For example, moose (Alces alces) seek refuge from high temperatures in shady coniferous forest in summer (van Beest et al., 2012), and Arabian oryx (Oryx leucoryx) select for covered sites during the hottest part of the day (Hetem et al., 2012). Some landscape features, such as water sources, may promote both behavioral and physiological thermoregulation. Replenishment of body water reserves staves off dehydration, and also makes evaporative cooling a viable thermoregulatory strategy (Dunkin et al., 2013). Hence, large herbivores such as Cape buffalo (Syncerus caffer) and savanna elephant both wallow as well as drink at water sources to cool down (Prins, 1996; Bennitt et al., 2014; Purdon, 2015).
When water sources are limited, mammals must balance the thermoregulatory benefits against the costs of increased predation and competition (Valeix et al., 2009; Cain et al., 2012; Chamaillé-Jammes et al., 2013; Owen-Smith and Goodall, 2014). Individuals may attempt to avoid such costs by shuttling, i.e., moving frequently between water and safer sites, but this movement increases travel costs and decreases time that could have been spent foraging or resting (Johnson et al., 2002; Cain et al., 2012; Chamaillé-Jammes et al., 2013; Giotto et al., 2015). Water-dependence can introduce periodicity to movement strategies in the short term, and may further result in strong fidelity to known water sources (Giotto et al., 2015). Long term seasonal differences in the distribution and accessibility of water can also influence movement strategies; for example, buffalo in the Okavango delta are closer to permanent water sources in the dry season, when ephemeral sources dry up and water availability across the landscape is reduced (Bennitt et al., 2014). Thus, for mammals living in hot arid and semi-arid areas, temperature is the underlying environmental driver that dictates when and how frequently they access water.
Here we investigate how ambient temperature drives the ranging behavior of the largest land mammal, the savanna elephant. The large size of the elephant makes heat dissipation a greater challenge than heat retention (Wright and Luck, 1984; Williams, 1990). In response, elephants use a range of thermoregulatory strategies, involving both physiological and behavioral mechanisms of losing heat (Buss and Estes, 1971; Wright and Luck, 1984; Myhrvold et al., 2012; Dunkin et al., 2013; Mole et al., 2016). For example, elephants seek shade (Kinahan et al., 2007b), lose heat via the trunk (Williams, 1990), and flap their ears (Hiley, 1975; Wright, 1984; Wright and Luck, 1984), as non-evaporative cooling strategies. At larger spatio-temporal scales, elephants avoid thermal stress by shifting their activity peaks to cooler times of the day, and selecting for thermally stable landscapes with lower variation in daily temperatures (Kinahan et al., 2007a). Elephants are also heavily water dependent, and make periodic visits to water to hydrate, as well as to use evaporative cooling to thermoregulate (Dunkin et al., 2013; Valls-Fox, 2015). Thus, at the landscape scale, environmental temperature and the distribution of accessible water are expected to be important drivers of elephant movement strategies (Purdon and van Aarde, 2017; Wato et al., 2018). Yet, there has been little work to understand the role of thermoregulation on the dynamic landscape-scale movement decisions of elephants (Dunkin et al., 2013). Although other studies have examined the effect of temperature on animal movement, this key environmental predictor is typically derived from global environmental datasets, such as BIOCLIM (Guralnick, 2006), remotely sensed satellite data (Purdon and van Aarde, 2017), or weather station data (Purdon and van Aarde, 2017). Such data, however, are either temporally or spatially mismatched to the scale of animal movement. Here, we use high-resolution position data from GPS telemetry, coupled with instantaneous data from temperature loggers on GPS collars, to track both elephant movement and variation in ambient temperature across the heterogeneous savanna landscape. We first establish that collar temperature is well predicted by ambient temperature, and thus can be used as a fine-scaled measure of variation in the thermal landscape. This approach allows us to test the hypothesis that relative differences in ambient temperature are an important driver of movement strategies of elephants in Kruger National Park, South Africa. We then closely examine movement behavior in relation to water visits, focusing in particular on the distance traveled and movement rates as elephants approach and leave water sources. With dynamic tracking of the variable thermal landscape and movements at fine spatio-temporal scales, we show how water dependency in wild savanna elephants is dictated by variation in environment temperature.
Methods
Elephant Tracking Data
The study was conducted in the central and southern part of Kruger National Park (extent: 31.1 °E−32.0 °E, 23.9 °S−25.4 °S) in South Africa, where 14 female African elephants, each from a different herd, were fitted with GPS logger collars (African Wildlife Tracking, Figure 1) set to record a location every half hour. Details of the capture and collaring of these elephants can be found in Birkett et al. (2012). Collars on elephants had inbuilt temperature loggers that were mounted on the GPS chipset, and the entire electronic unit was embedded in dental acrylic. The temperature recorded by the collar-mounted sensor is a combination of ambient, circuit-generated and elephant body temperature (African Wildlife Tracking, pers. comm.). For this study, we used location and temperature data from 14 collared elephants over 731 days between August 2007 and August 2009. We classified the data from the study period into the dry and wet seasons based on actual rainfall data during those years (as per Birkett et al., 2012). Each elephant was tracked for an average of 562 days (SD = 175; range = 260–723) over the study period. We obtained 283,737 GPS positions in total from 14 elephants, with roughly equal points in the dry (n = 138,764) and wet seasons (n = 144,973).
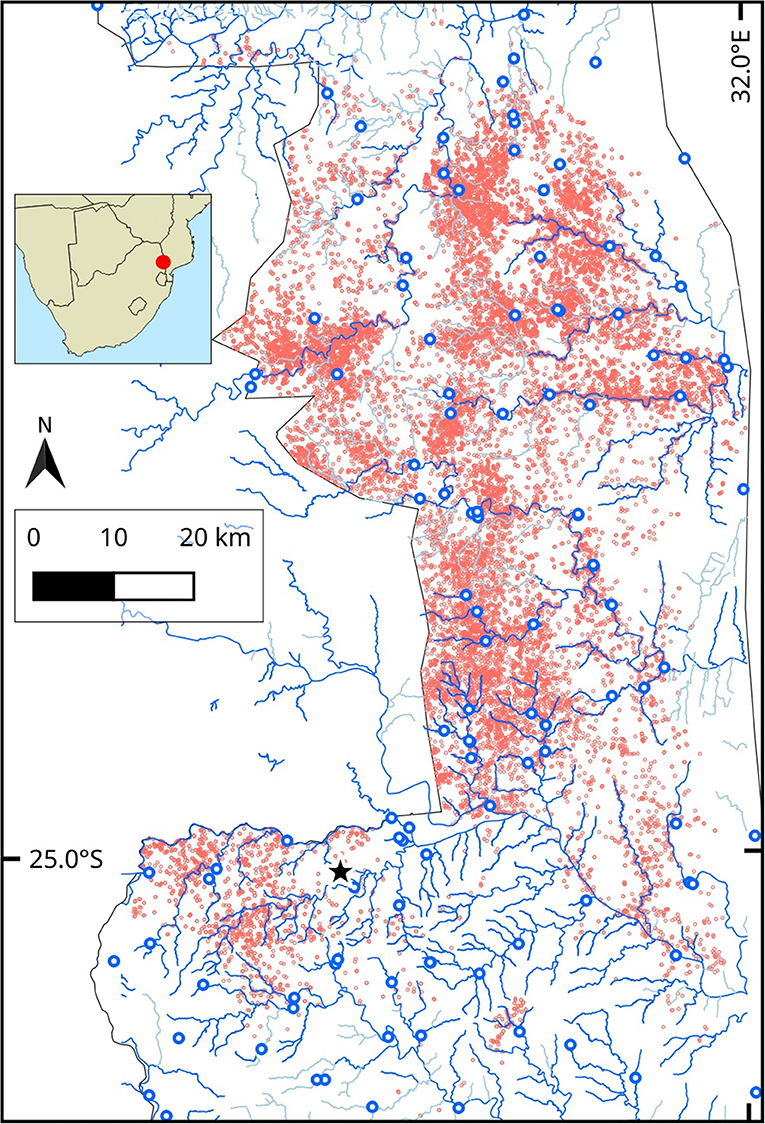
Figure 1. Study area (red circle, inset) in Kruger National Park (KNP), South Africa, showing: Park boundary (gray line), seasonal, and perennial rivers (solid blue lines), open waterholes (blue circles), location of the Skukuza flux tower (star) and positions of 14 elephants over 2 years between August 2007 and 2009 (red points). Only a subset of elephant positions (noon and midnight) are shown for better visibility (red points).
Landscape Data
We obtained the following landscape-level data for the study area: (1) percent woody cover, extracted from Bucini et al. (2010), (2) map (line shapefiles) of all waterways logged on OpenStreetMap (n = 939), and (3) locations of active park waterholes (n = 124, South African National Parks). Waterways in the study area included perennial and seasonal rivers (nperennial = 72, nseasonal = 11), streams (nseasonal = 460, nperennial = 363), and one canal. Seasonal rivers and streams were only included in the calculations for the wet season, when we expected them to have water. Waterholes in the study area were of different types and included boreholes (n = 74), concrete dams (n = 8), concrete weir dams (n = 5), earthen dams (n = 30), and pipeline troughs (n = 7). All open waterholes were included in the distance to water calculations in each season. Waterholes were on average 4 km (SD = 3.2 km; range = 0.1–14 km) from each other.
We obtained two measures of ambient temperature at different spatio-temporal scales. At a fine temporal scale, we obtained half-hourly ambient temperature data from the flux tower at Skukuza (24.9°S, 31.5°E from a Rotronic HygroClip2 Temp/RH probe mounted at 16 m height; South African National Parks) over the study period. Ambient temperature data from the Skukuza flux tower (n = 52,608) ranged from 5.6 to 39.3°C in the dry season and 4.2 to 36.9°C in the wet season (seasons defined as per Birkett et al., 2012); daily means ± SD were 21.9 ± 5.4°C and 21.5 ± 5.2°C in the dry and wet seasons, respectively.
At the coarse landscape-scale, we obtained surface reflectance satellite images of the study area taken in the low-gain thermal infrared range (Band 6; wavelength 10.4–12.5 μm; units: Kelvin, converted to degree Celsius) by the Thematic Mapper sensor onboard LANDSAT-5 over the study period (US Geological Service; Schmidt et al., 2013). These remote sensing data were obtained and handled at a resolution of 30 m using Google Earth Engine (Gorelick et al., 2017). As our study area is covered by three separate LANDSAT-5 scenes, we obtained a variable number (minimum = 8) of surface reflectance thermal snapshots at each point from LANDSAT-5 over the study period with < 10% cloud cover. We created a spatial composite in Google Earth Engine, and then averaged those at each position; the resulting two-year-mean raster comprised 15,249,291 data points covering the study area. Because LANDSAT-5 crossed the study area between ~08:30 h and 09:00 h, the data represent only the diurnal thermal landscape (temperature range: 19.4–33.8°C).
Collar Temperature as a Measure of the Thermal Landscape
We tested whether collar temperatures capture variation in the thermal landscape as experienced by elephants at two spatio-temporal scales. At a fine temporal scale, we tested the relationship between collar temperature data with ambient temperature data from the Skukuza flux tower. For this, we collated all elephant positions that were within a 10 km radius of the Skukuza flux tower between 2006 and 2011 (1,706 days; three elephants, n = 7,672 in dry season, 21,181 in see addition wet season). For each hour of day, we constructed a linear mixed model (LMM) with collar temperature as the response variable, ambient temperature from the flux tower and season as fixed effects, with elephant identity and hour of day as random effects.
We then created Bland-Altman limits of agreement plots (Bland and Altman, 1986), with modifications suitable to repeated measures (Myles and Cui, 2007) to examine deviations of collar temperature from the ambient temperature recorded by the flux tower. The modification consisted of deriving the limits of agreement as the mean ± standard normal deviate [(1.96) * standard deviation attributable to elephant identity] from the LMM above. We took the average of the standard deviation due to elephant identity over each hour to obtain general limits of agreement for a Bland-Altman plot for this data.
At the large spatial scale, we used a linear mixed model to test whether elephant collar temperature was influenced by the following environmental variables: LANDSAT-5 temperature at that location, percent woody cover, and season, with elephant identity as a random effect. We then tested the significance of each fixed effect using a Type II Wald chi-squared test. Since LANDSAT-5 provides data only during the morning, we restricted this analysis to only using collar temperature data between 08:00 h and 10:00 h each day (n = 35,135).
Elephant Movement in Relation to Temperature, Water, and Habitat Features
To test whether collar temperature was a significant predictor of elephant movement, we used a generalized additive mixed effects model (GAMM) on the speed of movement (km/h). The GAMM also included season as a categorical fixed effect, density of woody vegetation as a continuous fixed effect, and elephant identity as a random effect. We did not include distance to water as a predictor variable in this analysis because that parameter would not distinguish between the movement toward or away from water. We also did not include time of day in the analysis because it is strongly correlated with collar temperature (see Figure 3A).
To understand how elephants are distributed relative to water sources we compared actual locations of elephants to 200,000 random points in the landscape in each season using a Kolmogorov-Smirnov test. We then identified GPS positions at which elephants entered and exited a 200 m buffer zone around water sources. We used a 200 m buffer (approximately mean step length for elephant is 195 m in 30 min) to capture visits to water that may have occurred between successive GPS position fixes. We grouped each individual's positions into a set of track segments as follows: Each segment began with the first location when the elephant exited the 200 m buffer around the water source (pt0, Figure 2), and ended when the elephant re-entered a 200 m buffer (at the same or different water source; ptn, Figure 2). We further identified consecutive GPS positions within the 200 m buffer and classified those as residence at water (ptw, Figure 2). The last position of each segment could either be followed by residence at water, or by the first position of the next segment. Positions were not duplicated between segments and residence at water, i.e., a segment end point ptn was never classified as a residence at water point ptw.
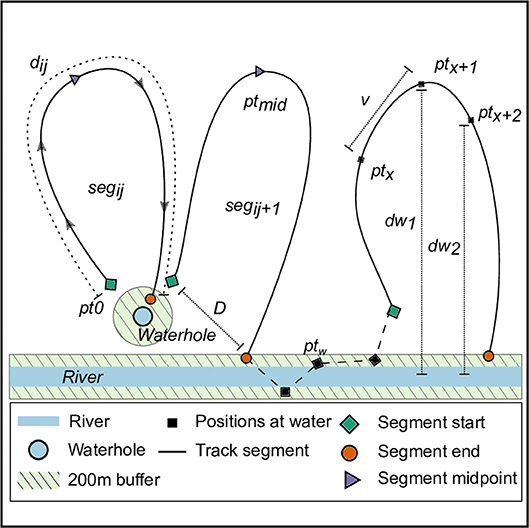
Figure 2. Schematic of elephant track segments between water points. The positions of elephants (black squares, denoted by ptx) from GPS transmitters on collars within 200 m (green area) of a water source (river: blue rectangle, waterhole: blue circle) were identified as visits to water. For each individual elephant i, we identified track segments j (solid lines, denoted segij) as the path joining all positions chronologically between successive departures from and arrivals at water points. Each segment began as the elephant departed the 200 m zone around water (green rhombi, pt0), and ended at the position where the elephant arrived within a 200 m zone around water (orange circle). Positions at which elephants were continuously within 200 m of a water source (black square, ptw) are joined by a dashed line, and were not included in the characterization of segments away from water. We calculated the time-difference between each segment's start and end points as the segment time (tseg), and identified the segment's midpoint (purple triangle, pt50) as the elephant position when half the segment time had elapsed (tseg/2). We computed the distance traveled between successive positions (ptx → ptx+1) in a segment as the steplength (v), and the sum of all v in a segment as the distance traveled along the segment (segment distance, dij). We calculated the linear distance (segment displacement, D) between each segment's start and end points. Finally, we obtained the linear distance from each elephant position to the nearest water source (dw), the relative change in distance to water at each position (Δdw = dw2-dw1), and the collar temperature at each position (Tx).
We calculated the linear distance (hereafter segment displacement) between the start and end positions of a segment (D, Figure 2). Next, we computed the actual distance moved along each segment dij (hereafter, segment distance d) as the sum of the steplengths (, Figure 2), i.e., the cumulative distances between successive points along a segment (ptxij to ptx+1ij). We also calculated the time difference between the start and end positions of a segment as the segment duration. To standardize segments of different durations, we calculated the proportion of the segment completed at each position along the segment, such that the segment start (pt0 in Figure 2) had a value of 0, and the segment end (ptn) had a value of 1. We characterized the distance to water, collar temperature, and elephant speed at each position in relation to the proportion of the segment traversed.
We then used a segmentation and clustering method that identifies stationary phases in a time series (Picard et al., 2007) to classify positions in each segment based on the change in distance to water at that position in the segment (see dw1 and dw2, Figure 2). The algorithm clustered segments into three classes of behavioral states: (1) Movement away from water, represented by successive positive values of change in distance to water dw; (2) no change in position relative to a water source, which was expected to be represented by low variance in values of dw; and, (3) movement toward water, which would be represented by successively decreasing distances to water, and, thus, consistent negative values of dw. The minimum length criteria required for determining each behavioral state was 5 GPS positions (2.5 h for data collected at 30 min intervals). We removed segments of over 120 h duration from further consideration as these may represent trips to water sources that are unmapped or ephemeral (n = 26,347, 9.3% of data away from water). Each of the three behavioral states described above could recur in a segment so long as the minimum length criterion was met, and the total number of state changes was 4 or fewer (five possible phases overall; minimum segment duration required = 25 positions or 12.5 h; maximum allowed duration = 120 h). We identified a total of 2,835 segments, comprising of 137,106 positions (~ 48% of the raw data) that met the duration criteria required by the stationary-phase based clustering algorithm. From these, we identified points where the behavioral state changed from state 2 (no change relative to water) to state 3 (movement toward water). We used a LMM to determine whether collar temperature and season influenced when elephants begin to move toward water (i.e., “start seeking water,” as defined by a state change from 2 to 3), with elephant identity as a random effect.
We used the R statistical environment (R Core Team, 2017) for all analyses, and, specifically, the lme4, mgcv, segclust2d, move, and sf packages to implement LMM, GAMM, stationary phase classification, and general movement and spatial data analyses, respectively (Wood, 2013; Bates et al., 2014; Kranstauber and Smolla, 2016; Patin et al., 2018; Pebesma, 2018). Figure 1 was generated in QGIS 3.2 (QGIS Development Team, 2018), Figure 2 was generated in Inkscape 0.92.3, and the remaining figures were generated in R.
Ethical Statement
Ethics approval for the capture, handling and collaring of elephants was obtained from the University of KwaZulu-Natal Animal Ethics Committee (Ref: 009/10/Animal). This project was also approved by the South African National Parks (Ref: SLOR660).
Results
General Elephant Movement
Over the two-year study period, collared elephants traveled on average 7.4 (SD = 1.8) and 7.9 (SD = 1.8) km each day in the dry and wet seasons, respectively (LMM estimate = 603.8, t-value = 7.4, Wald II chi-square test X2 = 55.3, p < 0.01, with individual elephant variation explaining only 4% of the variance).
Collar Temperatures as a Measure of the Thermal Landscape
Collar temperatures were well predicted by ambient temperatures at both the fine temporal scale and large spatial scale. At the fine temporal scale, collar temperatures from elephant positions ≤ 10 km away from the Skukuza flux tower were well predicted by hour-matched ambient temperatures from the flux tower (LMM estimate = 0.69; t-value = 121.8; Wald II chi-square test X2 = 14,837, p < 0.01) and by season (estimate = 0.78; t-value = 15.6; Wald II chi-square test X2 = 243.2, p < 0.01; Figures 3A,B). Of the random effects, elephant identity explained 6.9% of the variance, while hour of day explained 14.2%; the residual variance was 21.4%.
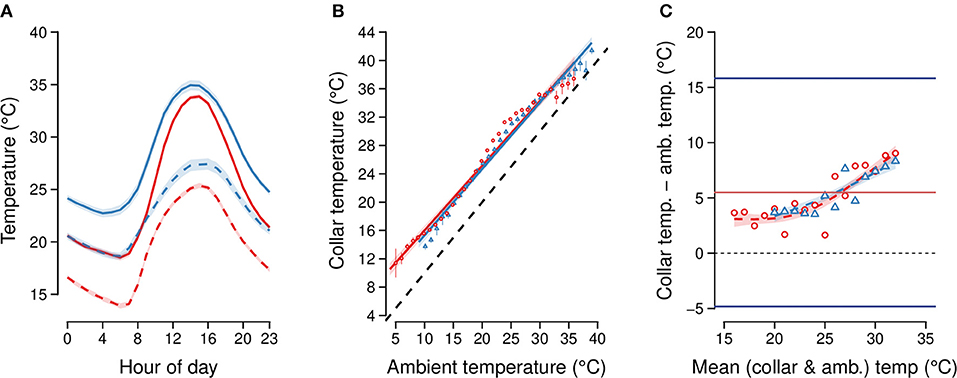
Figure 3. (A) Mean collar temperature (solid lines) and measured ambient temperature from Skukuza flux tower (dashed lines) at each hour of day in each season (dry: red lines, wet: blue lines) over the study period. Ninety-Five percent confidence intervals (CI) about each line are shaded. (B) Correlation between mean collar temperature from elephants within 10 km of the Skukuza flux tower (from n = 3 elephants) and time-matched ambient temperatures measured by the flux tower in each season (dry: red circles, wet: blue triangles). The dashed line denotes the line of identity where collar temperature equals ambient temperature. Bars represent 95% CI at each point. (C) Bland-Altman limits of agreement plot comparing collar temperatures and ambient temperatures from the Skukuza flux tower, accounting for repeated measures of individual elephants and hour of day (n = 28,853 total comparisons). The bias between the two measures at each mean temperature is marked by symbols colored by season (dry: red circles, wet: blue triangles). The black dashed line marks zero difference between the two measures. The upper and lower limits of agreement are shown as the standard normal deviate (1.96) times the standard deviation due to elephant identity, and are marked by solid blue lines, while the mean difference in measures is marked by the solid red line.
Elephant identity and hour of day as random effects contributed a standard deviation of 5.3°C which, after multiplication by the standard normal deviate (1.96), was used as the range of agreement between the two temperature measures (Figure 3C for Bland-Altman plot). We further found that the mean of the two temperature measures modeled as a thin-plate spline smoothed term was a significant predictor of the difference between the ambient and collar temperatures in each season (GAM, p < 0.01, adjusted R2 = 0.75). The GAM fits are increasing curves over the range 15°C−35°C, indicating that the correspondence between collar temperature and flux tower temperature is best at lower temperatures, and decreases at higher temperatures (Figure 3C; cf. Figure 3A).
At the large spatial scale, daytime collar temperatures were also well predicted by the two-year mean LANDSAT-5 temperature (LMM estimate = 0.9, t-value = 4.2; Wald II chi-square test X2 = 17.9, p < 0.01) and season (LMM estimate = 0.3, t-value = 6.0; Wald II chi-square test X2 = 36.3, p < 0.01). Percent woody cover was also a predictor of collar temperature at this scale (LMM estimate = 0.01, t-value = 2.2; Wald II chi-square test X2 = 5.0, p = 0.03).
Overall, we conclude that collar temperature captures variation in environmental temperature at the spatio-temporal scale of interest, and may be used as a reliable indicator of the variation in thermal landscape as experienced by elephants in the study area.
Elephant Movement in Relation to Temperature, Water, and Other Habitat Features
Based on data from all collared elephants over the 2 year study period, we found that collar temperature was a significant predictor of speed (GAMM F = 4,544, p < 0.01, Figure 4A). Elephants moved faster in the wet season (0.42 ± 0.49 km/h SD) than the dry season (0.39 ± 0.46 km/h SD, GAMM estimate = 15.6, t-value = 17.8, p < 0.01). The speed of elephant movement was also lower in denser woodlands (GAMM estimate = −1.6, t-value = −47, p < 0.01, Figure 4B).
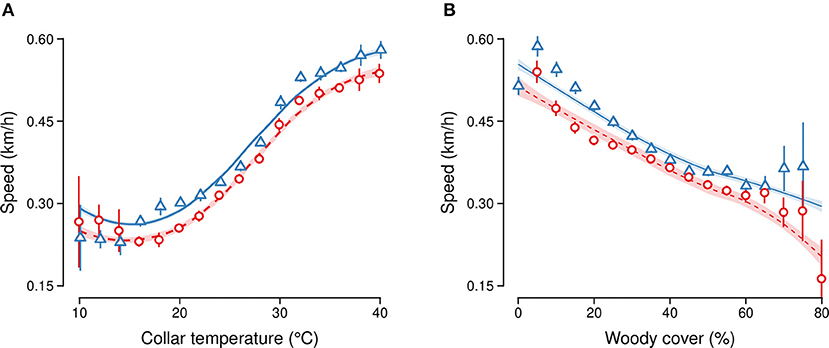
Figure 4. Speed of elephant movement in relation to (A) collar temperature (at 2°C intervals) and (B) % woody cover (at 5 unit intervals) in the dry (red circles) and wet season (blue triangles). GAMM fit (lines) and 95% confidence intervals (vertical line ranges and shaded areas) are shown for each season separately.
Elephants were distributed closer to water than would be expected by chance (Kolmogorov-Smirnov test; dry season D = 0.09, p < 0.01, wet season D = 0.08, p < 0.01). Collared elephants were on average 1.5 km (range: 0–8.6 km) and 0.9 km (range: 0–5.9 km) from the nearest water source in the dry and wet seasons, respectively (LMM estimate = −653.8, t-value = –147.9, Wald II chi-square test X2 = 21,886, p < 0.01). Elephant locations were ≤ 200 m from a water source 21.6% of the time (n = 61,252 positions; 19.6% of dry season points; 23.5% of wet season points). From these positions, elephants spent on average 2.6 h (± 2.7 SD) in continuous residence at water in the wet season and 3.5 h (± 4.1 SD) at water in the dry season (LMM estimate = −0.86, t-value = −11.0, Wald II chi-square test X2 = 121.4; p < 0.01). Collar temperatures were on average 29.5°C (± 6.4 SD) while elephants were at a water source, with an effect of season (dry season mean = 29.8°C, wet season mean = 29.2°C; LMM estimate = −0.4, t-value = −7.5, Wald II chi-square test X2 = 56.8; p < 0.01) and hour of day (LMM estimate = 0.1, t-value = 13.9, Wald II chi-square test X2 = 192.4; p < 0.01).
Shuttling behavior to water sources in the dry season typically began at 14:00 (± 5 h SD), when elephants left water, and ended at 11:00 (± 5 h SD) when they returned to water. In the wet season, this segment of movement typically began at 13:00 (± 5 h SD) and ended at 10:00 (± 5 h SD). While moving along these segments, elephants traveled 12 ± 8.5 km over 31 ± 20 h in the dry season, and 10 ± 7 km over 27 ± 7 h in the wet season (all values are mean ± SD; see dij in Figure 2). In 92 % of segments (n = 2,570 segments), the segment displacement (D, Figure 2) was ≥500 m, with a small seasonal difference (mean = 3.8 ± 3.7 km SD in the dry season, 3.6 ± 3.5 km in the wet season; LMM estimate = −273.9, t-value = −2, Wald II chi-square test X2 = 4.2; p = 0.04). Segment displacement positively correlated with segment distance traveled in both the dry and wet seasons (t-value = 29.6; Wald II chi-square test X2 = 875.2; p < 0.001; Figure 5).
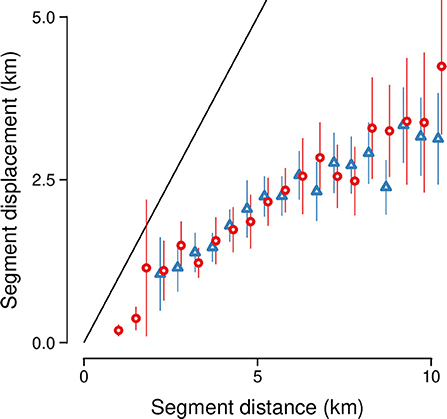
Figure 5. Segment displacement (km) between successive visits to water was positively correlated with the distance traveled along the segment (km). Vertical line ranges show 95% confidence intervals around mean values for the dry season (red circles) and wet season (blue triangles), respectively. The solid black line denotes values where displacement = distance.
Elephants moving along segments traveled at most a distance of 2.6 km (±1.2 SD; range = 0.4–6.9 km) and 1.9 km (± 0.9 SD; range = 0.4–6 km) from the nearest water source in the dry and wet seasons, respectively (dw in Figures 2, 6A; LMM estimate = −0.5, t-value = −88, Wald II chi-square test X2 = 7886.2; p ≤ 0.01). Elephants moved at an average speed of 0.4 km/h (± 0.2 SD; range = 0.1–1.5 km/h) along segments, with only minor seasonal differences (Figure 6B; LMM estimate = 0.01, t-value = 3.8, Wald II chi-square test X2 = 14.4; p < 0.01). Notably, however, elephant speed was highest in the initial (mean ± SD = 0.6 ± 0.6 km/h) and final (mean ± SD = 0.8 ± 0.8 km/h) tenth of each segment, and lowest at the segment midpoint (mean ± SD = 0.3 ± 0.4 km/h); this represents a slowing down to 46% of initial speed (approximately half as fast) between the segment start and midpoint, and then a speeding up to 137% (around 1.5 times faster) of initial speed at the segment end (Figure 6B; LMM estimate = 0.1, t-value = 52.3, Wald II chi-square test X2 = 2738.6; p < 0.01). Collar temperature at the beginning of the segment, as elephants were leaving water, was 29.6°C (± 6.1 SD), dropping to a mean of 26.0°C (SD = 6.22) at segment midpoints, and rising to 30.2°C (± 6.3 SD) at segment endpoints when elephant returned to water (Figure 6C; LMM estimate = 1.1, t-value = 21.1, Wald II chi-square test X2 = 442.9; p < 0.01). Seasonal differences in collar temperature were detected (LMM estimate = −0.2, t-value = −5.7, Wald II chi-square test X2 = 32.1; p < 0.01) but were within the sensitivity of the loggers (1°C).
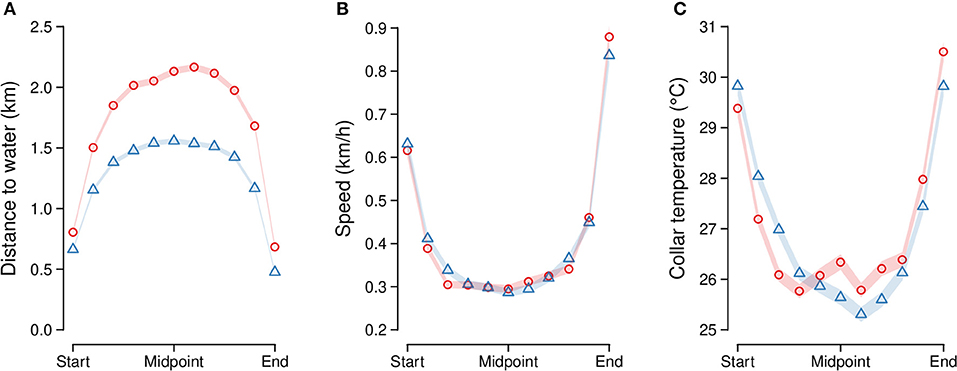
Figure 6. Elephant movement variables along segments between water points at 10% intervals of the segment stage (measured in time): (A) distance to the nearest water source (km), (B) speed (km/h), and (C) collar temperature (°C). Points are separated by season (dry = red circles, wet = blue triangles), and connected by lines. Ninety-five percent confidence intervals around each point are shown (note: CI may be too small to be visible for some points).
From the stationary-phase based clustering algorithm analysis, we identified 2,111 state-change points where elephants began to move toward water (n = 1,003 in dry season; 1,108 in wet season). Although elephants began moving toward water at a higher temperature in the dry season than the wet season, this difference was small, with the dry season state change mean only 1°C higher than the wet season mean (dry season mean ± SD = 26 ± 6.4°C, wet season mean = 25 ± 6.1°C; LMM: t-value = −4.1, Wald II X2 = 16.7, p < 0.01).
Discussion
Heat dissipation is a major concern for large mammals, especially for mega-herbivores such as the savanna elephant (Wright and Luck, 1984; Williams, 1990; Weissenböck et al., 2012). Here, we show that temperature and water-dependency are strong drivers of the movement of wild free-ranging savanna elephants across large spatio-temporal scales. In KNP, we find that elephants moved faster at higher temperatures. This is a counter-intuitive result, since elephants, like other savanna dwelling herbivores, are expected to reduce metabolic heat generation by resting during the hotter parts of the day (Kinahan et al., 2007a; Leggett, 2010; Mole et al., 2016). If they have to move, they are expected to move slowly, which would generate metabolic heat at a lower rate (Rowe et al., 2013). Importantly, the high rates of movement of elephants in KNP were directed toward a water source, such that they moved fastest when approaching and leaving water, similar to that seen in elephants in Hwange National Park, Zimbabwe (Chamaillé-Jammes et al., 2013). Elephants in KNP were also closest to water at hotter times of the day (similar to Purdon and van Aarde, 2017), contrary to what is seen in other regions of southern Africa (Valeix et al., 2007; Loarie et al., 2009).
In general, elephants in KNP traveled 7–8 km per day, with very low seasonal differences. This is also unexpected, since savanna elephants in the broader southern African region are constrained around water holes during the dry season (“dry season bottleneck”: Owen-Smith, 1988; Loarie et al., 2009; Young et al., 2009), and only forage farther afield at the onset of the wet season (Birkett et al., 2012). However, in the southern region of KNP, the density of water holes and surface water is high, and, thus, accessible to elephants throughout the year. We find that speed of movement was marginally faster in the wet season compared to the dry season and matches expectations from earlier studies (Birkett et al., 2012; Chamaillé-Jammes et al., 2013). Although they are moving slightly faster in the wet season, likely because they are grazing more than browsing (Codron et al., 2006), the total distance moved by elephants is similar across seasons. Elephants also moved slower in more densely wooded habitats, irrespective of temperature, likely while foraging or seeking shade (Kinahan et al., 2007a).
The Importance of Accessing Water
The use of various thermoregulatory strategies, such as heat sinks, thermal windows, ear flapping, shade seeking, and dust bathing behavior, are well recognized for elephants (Wright, 1984; Williams, 1990; Kinahan et al., 2007b; Weissenböck et al., 2010; Myhrvold et al., 2012; Dunkin et al., 2013). Perhaps the most important strategy, however, is through evaporative cooling, especially since cutaneous water loss increases with ambient temperature (Dunkin et al., 2013). Thus, heat dissipation through evaporative cooling is more important than water conservation (Dunkin et al., 2013). In hot, water-scarce habitats within the range of savanna elephant, this thermoregulatory mechanism is expected to result in high daily water debt. Therefore, elephants should anchor their movement strategies to water sources (Dunkin et al., 2013). We find that elephants in KNP are rarely more than 1.5 km away from water, and spend ~22% of the time close to a water source, with longer residence at water during the dry season compared to the wet season. Their movement away from water shows a distinct cyclical pattern in all seasons, with a return to water peaking in frequency at a 10–30 h periodicity (see also Chamaillé-Jammes et al., 2013). During this shuttling, they rarely returned to within 0.5 km of the same water source. Furthermore, the distance that elephants moved between water sources was positively correlated to the total distance moved, indicating that elephants show low fidelity to water sources in KNP, unlike in other southern African countries (Loarie et al., 2009; Valls-Fox, 2015). While shuttling between water visits, elephants moved farther away from water sources and traveled for longer durations in the dry season compared to the wet, although there were marginal differences in the total distance they traveled along the route, or where they returned to. This is again in contrast to that seen in other regions, where elephants tend to move less and have greater site fidelity in the dry season than in the wet season (Loarie et al., 2009).
Water is required for thermoregulatory reasons and for maintaining osmoregulation. However, access to water has costs in terms of higher competition, and predation or poaching risk (Valeix et al., 2008, 2009; Rashidi et al., 2016). In areas with high poaching risk or human activity, elephants use water sources at night to reduce the risk of encountering humans (Von Gerhardt et al., 2014). On the other hand, predation risk at waterholes, especially from lions, typically peaks toward the cooler, night-time hours (Valeix et al., 2010). Therefore, animals looking to reduce predation risk should access water during the day (Valeix et al., 2009). However, animals generally avoid waterholes at the hottest time of the day due to the lack of cover [“sacrifice area”: (Brits et al., 2002)] which can induce thermal overloading. Indeed, herbivores across a range of body sizes move less and find shade during the hottest time of day (Walsberg, 2000; Hetem et al., 2007, 2012; Aublet et al., 2009; van Beest et al., 2012). In KNP, where water is easily accessible and the risk of poaching is low, elephants use short, high-speed bursts of movement to get to water at hotter times of the day. This strategy not only provides the benefit of predation risk avoidance, but also allows them to hydrate and immediately cool down. The advantage of never being too far from water is that elephants can benefit from both direct (evaporation) and indirect (reducing water debt from cutaneous evaporative water loss) cooling, since water is the fastest way for large herbivores to lose heat (Dunkin et al., 2013). By shuttling to water in this way, elephants can trade-off a number of ecological and physiological drivers, with physiology in the form of thermoregulation as an important determinant of movement at this spatio-temporal scale.
Using Collar-Mounted Temperature Sensors to Generate a Dynamic Thermal Landscape
The use of collar-mounted temperature sensors allowed us to capture the relative differences in the thermal landscape at the scale of animal movement decisions. Although the temperature recorded from these instruments is always higher than the ambient temperature (especially at higher ambient temperatures) because of the heat generated by the GPS circuitry as well as the animal, we show that the collar-mounted temperature data are still well correlated with ambient temperatures across space and time (as validated from both precise as well as extensive environmental data, even with the variation across seasons, time of day and percent woody cover). We recognize that a more accurate measure of both ambient temperature and heat incidence can be derived from either distributing a large number of temperature sensors in the landscape (Kinahan et al., 2007b) or from animal-mounted black-globe sensors (Hetem et al., 2007), or both (Shrestha et al., 2012, 2014). However, the former is logistically challenging to deploy at the large spatial scales required to capture temperature differences across habitat features. The latter is suitable only for animals that are unlikely to damage the delicate instruments. Our approach here, therefore, uses an instrument that is now easily included in most commercial GPS tracking collars, thereby enabling the examination of movement strategies as a function of relative ambient temperature conditions. We do caution against using such collar mounted sensor data to make inferences about the actual ambient, or the animal's body temperature.
The Need for Water to Thermoregulate has Management Implications
The incorporation of physiological factors into understanding animal ranging and distribution is now being highlighted as essential (Dunkin et al., 2013; Jachowski et al., 2013; Hetem et al., 2014). As large mammals are increasingly restricted to areas smaller than their natural home range (Packer et al., 2013; Di Minin et al., 2016), both the resources they require and the impact that they have on habitats becomes more intensive (Kerley et al., 2008). Thus, more comprehensive management planning, or more intensive management intervention, such as placement of artificial waterholes (cf. Mwakiwa et al., 2013; Hilbers et al., 2015) or food provisioning, can be necessary. Conventionally, managers only consider the ecological basis of such interventions, such as edge effects from boundaries (Laurance, 2000; Vanak et al., 2010) or the piosphere effect (Chamaillé-Jammes et al., 2009). Managers also consider the importance of a “landscape of fear” (Laundré et al., 2001; Cromsigt et al., 2013), and the potential use of this for achieving spatial heterogeneity in elephant distribution and their impacts on vegetation (SANParks, 2006). Here, we have demonstrated that the importance of facultative responses by elephants, which includes dependence on water, underpins their spatial decisions at the daily scale. Perhaps a physiologically based “landscape of thermal stress” may be a more important determinant of space use for a megaherbivore with low predation risk than the “landscape of fear.”
Considering animal movement from a physiological point of view could change the perspective of managers, and, therefore, the basis of their planning and interventions. For example, elephants are known to over-exploit vegetation around water sources (Chamaillé-Jammes et al., 2009), and, thus, managers close artificial water holes to reduce impact. However, water and water-points could be important limiting factors from a physiological rather than ecological perspective. We show that elephants are not site-faithful to water sources in KNP, where currently poaching for elephants is (still) minimal, and, thus, the removal of waterpoints in this reserve could have a greater impact on elephant biology, rather than the intended reduction of elephant-induced impact on vegetation. Reduced access to water may put more thermal stress on elephants, requiring them to walk farther and faster to water, and therefore increase their risk of mortality, especially in times of drought (e.g., Woolley et al., 2008). Such incorporation of both the ecological and physiological bases of animal movement strategies is fundamental to sustainable planning in the longer term, and can guide management interventions.
Data Availability Statement
The datasets analyzed for this study can be found on Movebank http://www.movebank.org/.
Author Contributions
MT, ATV, and RS designed the study and collected the primary data. PRG analyzed the data and generated the figures. MT, PRG, and ATV wrote the manuscript with inputs and edits from HHTP and RS.
Funding
This work is based on the research supported in part by the National Research Foundation of South Africa (Grant Numbers 103659 to ATV, and Grant FA2006032300024 to RS), Amarula Trust funding to RS, University of Kwazulu-Natal funding to RS, Wageningen University funding to HHTP, Department of Science and Technology of India (FIST) to MT, Department of Biotechnology (DBT-IISC partnership program) to MT.
Conflict of Interest Statement
The authors declare that the research was conducted in the absence of any commercial or financial relationships that could be construed as a potential conflict of interest.
Acknowledgments
We thank SANParks for providing weather data from the Skukuza flux tower, and for providing shapefiles of geographic features of Kruger NP. We also thank Markus Hofmeyer and the SANParks veterinary team for the collaring of elephants, and appreciate the critical reviews by AF amd BFD on this manuscript.
References
Angilletta, M. J. (2009). Thermal Adaptation: A Theoretical and Empirical Synthesis. New York, NY: Oxford University Press Inc. doi: 10.1093/acprof:oso/9780198570875.001.1
Aublet, J. F., Festa-Bianchet, M., Bergero, D., and Bassano, B. (2009). Temperature constraints on foraging behaviour of male Alpine ibex (Capra ibex) in summer. Oecologia 159, 237–247. doi: 10.1007/s00442-008-1198-4
Bastille-Rousseau, G., Murray, D. L., Schaefer, J. A., Lewis, M. A., Mahoney, S. P., and Potts, J. R. (2018). Spatial scales of habitat selection decisions: implications for telemetry-based movement modelling. Ecogr. Cop. 41, 437–443. doi: 10.1111/ecog.02655
Bates, D., Mächler, M., Bolker, B., and Walker, S. (2014). Fitting linear mixed-effects models using lme4. J. Stat. Softw. 67, 1–48. doi: 10.18637/jss.v067.i01
Bennitt, E., Bonyongo, M. C., and Harris, S. (2014). Habitat selection by African buffalo (Syncerus caffer) in response to landscape-level fluctuations in water availability on two temporal scales. PLoS ONE 9:e101346. doi: 10.1371/journal.pone.0101346
Birkett, P. J., Vanak, A. T., Muggeo, V. M., Ferreira, S. M., and Slotow, R. (2012). Animal perception of seasonal thresholds: changes in elephant movement in relation to rainfall patterns. PLoS ONE 7:e38363. doi: 10.1371/journal.pone.0038363
Bland, J. M., and Altman, D. G. (1986). Statistical methods for assessing agreement between two methods of clinical measurement. The Lancet 327, 307–310.
Brits, J., Van Rooyen, M. W., and Van Rooyen, N. (2002). Ecological impact of large herbivores on the woody vegetation at selected watering points on the eastern basaltic soils in the Kruger National Park. Afr. J. Ecol. 40, 53–60. doi: 10.1046/j.0141-6707.2001.00344.x
Bryce, C. M., Wilmers, C. C., and Williams, T. M. (2017). Energetics and evasion dynamics of large predators and prey: pumas vs. hounds. PeerJ 5:e3701. doi: 10.7717/peerj.3701
Bucini, G., Hanan, N. P., Boone, R., Smit, I. P. J., Saatchi, S., and Lefsky, M. A. (2010). “Woody fractional cover in Kruger National Park, South Africa: remote-sensing-based maps and ecological insights,” in Ecosystem Function in Savannas Measurement and Modeling at Landscape to Global Scales, eds M. J. Hill and N. P. Hanan (Boca Raton FL: CRC Press), 219–238.
Buss, I. O., and Estes, J. A. (1971). The functional significance of movements and positions of the pinnae of the African elephant, Loxodonta africana. J. Mammal 52, 21–27. doi: 10.2307/1378428
Cain, J. W., Krausman, P. R., Rosenstock, S. S., and Turner, J. C. (2006). Mechanisms of thermoregulation and water balance in desert ungulates. Wildl. Soc. Bull. 34, 570–581. doi: 10.2193/0091-7648(2006)34[570:MOTAWB]2.0.CO;2
Cain, J. W., Owen-Smith, N., and Macandza, V. A. (2012). The costs of drinking: comparative water dependency of sable antelope and zebra. J. Zool. 286, 58–67. doi: 10.1111/j.1469-7998.2011.00848.x
Chamaillé-Jammes, S., Fritz, H., and Madzikanda, H. (2009). Piosphere contribution to landscape heterogeneity: a case study of remote-sensed woody cover in a high elephant density landscape. Ecogr. Cop. 32, 871–880. doi: 10.1111/j.1600-0587.2009.05785.x
Chamaillé-Jammes, S., Mtare, G., Makuwe, E., and Fritz, H. (2013). African elephants adjust speed in response to surface-water constraint on foraging during the dry-season. PLoS ONE 8:e59164. doi: 10.1371/journal.pone.0059164
Codron, J., Lee-Thorp, J. A., Sponheimer, M., Codron, D., Grant, R. C., and de Ruiter, D. J. (2006). Elephant (Loxodonta africana) diets in kruger national park, south africa: spatial and landscape differences. J. Mammal 87, 27–34. doi: 10.1644/05-MAMM-A-017R1.1
Cromsigt, J. P. G. M., Kuijper, D. P. J., Adam, M., Beschta, R. L., Churski, M., Eycott, A., et al. (2013). Hunting for fear: innovating management of human–wildlife conflicts. J. Appl. Ecol. 50, 544–549. doi: 10.1111/1365-2664.12076
Di Minin, E., Slotow, R., Hunter, L. T., Montesino Pouzols, F., Toivonen, T., Verburg, P. H., et al. (2016). Global priorities for national carnivore conservation under land use change. Sci. Rep. 6:23814. doi: 10.1038/srep23814
Dunkin, R. C., Wilson, D., Way, N., Johnson, K., and Williams, T. M. (2013). Climate influences thermal balance and water use in African and Asian elephants: physiology can predict drivers of elephant distribution. J. Exp. Biol. 216, 2939–2952. doi: 10.1242/jeb.080218
Fortin, D., Fryxell, J. M., O'Brodovich, L., and Frandsen, D. (2003). Foraging ecology of bison at the landscape and plant community levels: the applicability of energy maximization principles. Oecologia 134, 219–227. doi: 10.1007/s00442-002-1112-4
Fuller, A., Hetem, R. S., Maloney, S. K., and Mitchell, D. (2014). Adaptation to heat and water shortage in large, arid-zone mammals. Physiology 29, 159–167. doi: 10.1152/physiol.00049.2013
Giotto, N., Gerard, J. F., Ziv, A., Bouskila, A., and Bar-David, S. (2015). Space-use patterns of the asiatic wild ass (Equus hemionus): complementary insights from displacement, recursion movement and habitat selection analyses. PLoS ONE 10:e0143279. doi: 10.1371/journal.pone.0143279
Gorelick, N., Hancher, M., Dixon, M., llyushchenko, S., Thau, D., and Moore, R. (2017). Google earth engine: planetary-scale geospatial analysis for everyone. Remote Sens. Env. 202, 18–27. doi: 10.1016/j.rse.2017.06.031
Guralnick, R. (2006). The legacy of past climate and landscape change on species' current experienced climate and elevation ranges across latitude: a multispecies study utilizing mammals in western North America. Glob. Ecol. Biogeogr. 15, 505–518. doi: 10.1111/j.1466-822X.2006.00231.x
Hetem, R. S., Fuller, A., Maloney, S. K., and Mitchell, D. (2014). Responses of large mammals to climate change. Temperature 1, 115–127. doi: 10.4161/temp.29651
Hetem, R. S., Maartin Strauss, W., Heusinkveld, B. G., de, Bie S, Prins, H. H. T., and van Wieren, S. E. (2011). Energy advantages of orientation to solar radiation in three African ruminants. J. Therm. Biol. 36, 452–460. doi: 10.1016/j.jtherbio.2011.07.012
Hetem, R. S., Maloney, S. K., Fuller, A., Meyer, L. C., and Mitchell, D. (2007). Validation of a biotelemetric technique, using ambulatory miniature black globe thermometers, to quantify thermoregulatory behaviour in ungulates. J. Exp. Zool. Part Ecol. Genet. Physiol. 307, 342–356. doi: 10.1002/jez.389
Hetem, R. S., Strauss, W. M., Fick, L. G., Maloney, S. K., Meyer, L. C., Shobrak, M., et al. (2012). Activity re-assignment and microclimate selection of free-living Arabian oryx: responses that could minimise the effects of climate change on homeostasis? Zoology 115, 411–416. doi: 10.1016/j.zool.2012.04.005
Hilbers, J. P., Van Langevelde, F., Prins, H. H., Grant, C. C., Peel, M. J., Coughenour, M. B., et al. (2015). Modeling elephant-mediated cascading effects of water point closure. Ecol. Appl. 25, 402–415. doi: 10.1890/14-0322.1
Jachowski, D. S., Montgomery, R. A., Slotow, R., and Millspaugh, J. J. (2013). Unravelling complex associations between physiological state and movement of African elephants (C Franklin, Ed). Funct. Ecol. 27, 1166–1175. doi: 10.1111/1365-2435.12118
Jachowski, D. S., Slotow, R., and Millspaugh, J. J. (2012). Physiological stress and refuge behavior by African elephants. PLoS ONE 7:e31818. doi: 10.1371/journal.pone.0031818
Johnson, C. J., Parker, K. L., Heard, D. C., and Gillingham, M. P. (2002). Movement parameters of ungulates and scale-specific responses to the environment. J. Anim. Ecol. 71, 225–235. doi: 10.1046/j.1365-2656.2002.00595.x
Kays, R., Crofoot, M. C., Jetz, W., and Wikelski, M. (2015). Terrestrial animal tracking as an eye on life and planet. Science 348:aaa2478. doi: 10.1126/science.aaa2478
Kerley, G. I. H., Landman, M., Kruger, L., Owen-Smith, N., Balfour, D., de Boer, W. F., et al. (2008). “Effects of elephants on ecosystems and biodiversity,” in Elephant Manag. A Sci. Assess, eds R. J. Scholes and K. G. Mennell (Johannesburg, ZA: Wits University Press), 146–205.
Kinahan, A. A., Inge-moller, R., Bateman, P. W., Kotze, A., and Scantlebury, M. (2007a). Body temperature daily rhythm adaptations in African savanna elephants (Loxodonta africana). Physiol. Behav. 92, 560–565. doi: 10.1016/j.physbeh.2007.05.001
Kinahan, A. A., Pimm, S. L., and van Aarde, R. J. (2007b). Ambient temperature as a determinant of landscape use in the savanna elephant, Loxodonta africana. J. Therm. Biol. 32, 47–58. doi: 10.1016/j.jtherbio.2006.09.002
Kranstauber, B., and Smolla, M. (2016). Move: Visualizing and Analyzing Animal Track Data. Available online at: http://CRAN.R-project.org/package=move
Laundré, J. W., Hernández, L., and Altendorf, K. B. (2001). Wolves, elk, and bison: reestablishing the “landscape of fear” in Yellowstone National Park, U.S.A. Can. J. Zool. 79, 1401–1409. doi: 10.1139/cjz-79-8-1401
Laurance, W. F. (2000). Do edge effects occur over large spatial scales? Trends Ecol. Evol. 15, 134–135. doi: 10.1016/S0169-5347(00)01838-3
Leggett, K. (2010). Daily and hourly movement of male desert-dwelling elephants. Afr. J. Ecol. 48, 197–205. doi: 10.1111/j.1365-2028.2009.01101.x
Loarie, S. R., Aarde, R. J. V., and Pimm, S. L. (2009). Fences and artificial water affect African savannah elephant movement patterns. Biol. Conserv. 142, 3086–3098. doi: 10.1016/j.biocon.2009.08.008
Mitchell, D., Snelling, E. P., Hetem, R. S., Maloney, S. K., Strauss, W. M., and Fuller, A. (2018). Revisiting concepts of thermal physiology: predicting responses of mammals to climate change. J. Anim. Ecol. 87, 956–973. doi: 10.1111/1365-2656.12818
Mole, M. A., Rodrigues DÁraujo, S., van Aarde, R. J., Mitchell, D., and Fuller, A. (2016). Coping with heat: behavioural and physiological responses of savanna elephants in their natural habitat. Conserv. Physiol. 4:cow044. doi: 10.1093/conphys/cow044
Mwakiwa, E., de Boer, W. F., Hearne, J. W., Slotow, R., van Langevelde, F., Peel, M., et al. (2013). Optimization of wildlife management in a large game reserve through waterpoints manipulation: a bio-economic analysis. J. Environ. Manage. 114, 352–361. doi: 10.1016/j.jenvman.2012.10.029
Myhrvold, C. L., Stone, H. A., and Bou-Zeid, E. (2012). What is the use of elephant hair? PLoS ONE 7:e47018. doi: 10.1371/journal.pone.0047018
Myles, P. S., and Cui, J. (2007). Using the Bland–Altman method to measure agreement with repeated measures. Br. J. Anaesth. 99, 309–311. doi: 10.1093/bja/aem214
Nathan, R., Getz, W. M., Revilla, E., Holyoak, M., Kadmon, R., Saltz, D., et al. (2008). A movement ecology paradigm for unifying organismal movement research. Proc. Natl. Acad. Sci. U.S.A. 105, 19052–19059. doi: 10.1073/pnas.0800375105
Owen-Smith, N. (1988). Megaherbivores: The Influence of Very Large Body Size on Ecology. Cambridge: Cambridge University Press. doi: 10.1017/CBO9780511565441
Owen-Smith, N., and Goodall, V. (2014). Coping with savanna seasonality: comparative daily activity patterns of African ungulates as revealed by GPS telemetry. J. Zool. 293, 181–191. doi: 10.1111/jzo.12132
Packer, C., Loveridge, A., Canney, S., Caro, T., Garnett, S. T., Pfeifer, M., et al. (2013). Conserving large carnivores: dollars and fence. Ecol. Lett. 16, 635–641. doi: 10.1111/ele.12091
Patin, R., Etienne, M.-P., Lebarbier, E., Chamaillé-Jammes, S., and Benhamou, S. (2018). Identifying stationary phases in multivariate time-series for highlighting behavioural modes and home range settlements. bioRxiv. doi: 10.1101/444794
Pebesma, E. (2018). Simple Features for R: standardized support for spatial vector data. R. J. 10, 439–446. doi: 10.32614/RJ-2018-009
Picard, F., Robin, S., Lebarbier, E., and Daudin, J.-J. (2007). A segmentation/clustering model for the analysis of array CGH data. Biometrics 63, 758–766.
Prins, H. H. T. (1996). Behaviour and Ecology of the African Buffalo: Social Inequality and Decision Making. London: Chapman and Hall. doi: 10.1007/978-94-009-1527-5
Purdon, A. (2015). Environmental Determinants of the Movement Patterns of Elephants in the Kruger National Park. University of Pretoria.
Purdon, A., and van Aarde, R. J. (2017). Water provisioning in Kruger National Park alters elephant spatial utilisation patterns. J. Arid. Env. 141, 45–51. doi: 10.1016/j.jaridenv.2017.01.014
QGIS Development Team (2018). QGIS Geographic Information System. Open Source Geospatial Foundation.
R Core Team (2017). R: A Language and Environment for Statistical Computing. Vienna: R Foundation for Statistical Computing.
Rashidi, P., Wang, T., Skidmore, A., Mehdipoor, H., Darvishzadeh, R., Ngene, S., et al. (2016). Elephant poaching risk assessed using spatial and non-spatial Bayesian models. Ecol. Model. 338, 60–68. doi: 10.1016/j.ecolmodel.2016.08.002
Rowe, M. F., Bakken, G. S., Ratliff, J. J., and Langman, V. A. (2013). Heat storage in Asian elephants during submaximal exercise: behavioral regulation of thermoregulatory constraints on activity in endothermic gigantotherms. J. Exp. Biol. 216, 1774–1785. doi: 10.1242/jeb.076521
Scantlebury, D. M., Mills, M. G., Wilson, R. P., Wilson, J. W., Mills, M. E., Durant, S. M., et al. (2014). Flexible energetics of cheetah hunting strategies provide resistance against kleptoparasitism. Science 346, 79–81. doi: 10.1126/science.1256424
Schmidt, G., Jenkerson, C. B., Masek, J., Vermote, E., and Gao, F. (2013). Landsat Ecosystem Disturbance Adaptive Processing System (LEDAPS) Algorithm Description. Reston, VA: U.S. Geological Survey.
Shrestha, A. K., van Wieren, S. E., van Langevelde, F., Fuller, A., Hetem, R. S., Meyer, L., et al. (2014). Larger antelopes are sensitive to heat stress throughout all seasons but smaller antelopes only during summer in an African semi-arid environment. Int. J. Biometeorol. 58, 41–49. doi: 10.1007/s00484-012-0622-y
Shrestha, A. K., van Wieren, S. E., van Langevelde, F., Fuller, A., Hetem, R. S., Meyer, L. C. R., et al. (2012). Body temperature variation of South African antelopes in two climatically contrasting environments. J. Therm. Biol. 37, 171–178. doi: 10.1016/j.jtherbio.2011.12.008
Thaker, M., Vanak, A. T., Owen, C. R., Ogden, M. B., Niemann, S. M., and Slotow, R. (2011). Minimizing predation risk in a landscape of multiple predators: effects on the spatial distribution of African ungulates. Ecology 92, 398–407. doi: 10.1890/10-0126.1
Valeix, M., Chamaillé-Jammes, S., and Fritz, H. (2007). Interference competition and temporal niche shifts: elephants and herbivore communities at waterholes. Oecologia 153, 739–748. doi: 10.1007/s00442-007-0764-5
Valeix, M., Fritz, H., Loveridge, A. J., Davidson, Z., Hunt, J. E., Murindagomo, F., et al. (2009). Does the risk of encountering lions influence African herbivore behaviour at waterholes? Behav. Ecol. Sociobiol. 63, 1483–1494. doi: 10.1007/s00265-009-0760-3
Valeix, M., Fritz, H., Matsika, R., Matsvimbo, F., and Madzikanda, H. (2008). The role of water abundance, thermoregulation, perceived predation risk and interference competition in water access by African herbivores. Afr. J. Ecol. 46, 402–410. doi: 10.1111/j.1365-2028.2007.00874.x
Valeix, M., Loveridge, A. J., Davidson, Z., Madzikanda, H., Fritz, H., and Macdonald, D. W. (2010). How key habitat features influence large terrestrial carnivore movements: waterholes and African lions in a semi-arid savanna of north-western Zimbabwe. Landsc. Ecol. 25, 337–351. doi: 10.1007/s10980-009-9425-x
Valls-Fox, H. (2015). To drink or not to drink? The Influence of Resource Availability on Elephant Foraging and Habitat Selection in a Semi-Arid Savanna. University of Montpellier.
van Beest, F. M., Moorter, B., and van, Milner J. M. (2012). Temperature-mediated habitat use and selection by a heat-sensitive northern ungulate. Anim. Behav. 84, 723–735. doi: 10.1016/j.anbehav.2012.06.032
Vanak, A. T., Fortin, D., Thaker, M., Ogden, M., Owen, C., Greatwood, S., et al. (2013). Moving to stay in place: behavioral mechanisms for coexistence of African large carnivores. Ecology 94, 2619–2631. doi: 10.1890/13-0217.1
Vanak, A. T., Thaker, M., and Slotow, R. (2010). Do fences create an edge-effect on the movement patterns of a highly mobile mega-herbivore? Biol. Conserv. 143, 2631–2637. doi: 10.1016/j.biocon.2010.07.005
Von Gerhardt, K., Van Niekerk, A. V., Kidd, M., Samways, M., and Hanks, J. (2014). The roles of elephant Loxodonta africana pathways as a spatial variable in crop-raiding location. Oryx 48, 436–444. doi: 10.1017/S003060531200138X
Walsberg, G. E. (2000). Small mammals in hot deserts: some generalizations revisited. Bioscience 50, 109–120. doi: 10.1641/0006-3568(2000)050[0109:SMIHDS]2.3.CO;2
Wato, Y. A., Heitkönig, I. M. A., van Wieren, S. E., Wahungu, G. M., Prins, H. T., and van Langevelde, F. (2016). Prolonged drought results in starvation of African elephant (Loxodonta africana). Biol. Conserv. 203, 89–96. doi: 10.1016/j.biocon.2016.09.007
Wato, Y. A., Prins, H. H. T., Heitkönig, I. M. A., Wahungu, G. M., Ngene, S. M., Njumbi, S., et al. (2018). Movement patterns of African elephants (Loxodonta africana) in a semi-arid savanna suggest that they have information on the location of dispersed water sources. Front. Ecol. Evol. 6:167. doi: 10.3389/fevo.2018.00167
Weissenböck, N. M., Arnold, W., and Ruf, T. (2012). Taking the heat: thermoregulation in asian elephants under different climatic conditions. J. Comp. Physiol. B 182, 311–319. doi: 10.1007/s00360-011-0609-8
Weissenböck, N. M., Weiss, C. M., Schwammer, H. M., and Kratochvil, H. (2010). Thermal windows on the body surface of African elephants (Loxodonta africana) studied by infrared thermography. J. Therm. Biol. 35, 182–188. doi: 10.1016/j.jtherbio.2010.03.002
Williams, T. M. (1990). Heat transfer in elephants: thermal partitioning based on skin temperature profiles. J. Zool. 222, 235–245. doi: 10.1111/j.1469-7998.1990.tb05674.x
Williams, T. M., Fuiman, L. A., Horning, M., and Davis, R. W. (2004). The cost of foraging by a marine predator, the Weddell seal Leptonychotes weddellii: pricing by the stroke. J. Exp. Biol. 207, 973–982. doi: 10.1242/jeb.00822
Williams, T. M., Wolfe, L., Davis, T., Kendall, T., Richter, B., Wang, Y., et al. (2014). Instantaneous energetics of puma kills reveal advantage of felid sneak attacks. Science 346, 81–85. doi: 10.1126/science.1254885
Wood, S. N. (2013). Generalized Additive Models: An Introduction With R. Chapman. Boca Raton, FL: Hall/CRC.
Woolley, L. A., Mackey, R. L., Page, B. R., and Slotow, R. (2008). Modelling the effect of age-specific mortality on elephant Loxodonta africana populations: can natural mortality provide regulation? Oryx 42, 49–57. doi: 10.1017/S0030605308000495
Wright, C. P., and Luck, C. P. (1984). Do elephants need to sweat? South Afr. J. Zool. 19, 270–274. doi: 10.1080/02541858.1984.11447892
Wright, P. G. (1984). Why do elephants flap their ears? South Afr. J. Zool. 19, 266–269. doi: 10.1080/02541858.1984.11447891
Keywords: Loxodonta africana, thermoregulation, GPS telemetry, temperature, water, habitat, shuttle
Citation: Thaker M, Gupte PR, Prins HHT, Slotow R and Vanak AT (2019) Fine-Scale Tracking of Ambient Temperature and Movement Reveals Shuttling Behavior of Elephants to Water. Front. Ecol. Evol. 7:4. doi: 10.3389/fevo.2019.00004
Received: 14 August 2018; Accepted: 08 January 2019;
Published: 25 January 2019.
Edited by:
Thomas Wassmer, Siena Heights University, United StatesReviewed by:
Andrea Fuller, University of the Witwatersrand, South AfricaBlandine Françoise Doligez, Center for the National Scientific Research (CNRS), France
Copyright © 2019 Thaker, Gupte, Prins, Slotow and Vanak. This is an open-access article distributed under the terms of the Creative Commons Attribution License (CC BY). The use, distribution or reproduction in other forums is permitted, provided the original author(s) and the copyright owner(s) are credited and that the original publication in this journal is cited, in accordance with accepted academic practice. No use, distribution or reproduction is permitted which does not comply with these terms.
*Correspondence: Maria Thaker, mthaker@iisc.ac.in
†These authors share first authorship