The Impacts of Cocoa Sustainability Initiatives in West Africa


1
Forest & Nature Conservation Policy Group, Wageningen University and Research, P.O. Box 100, 6708 PB Wageningen, The Netherlands
2
Wageningen Economic Research, Wageningen University and Research, P.O. Box 100, 6708 PB Wageningen, The Netherlands
3
Rainforest Alliance, De Ruyterkade 6, 1013 AA, Amsterdam, The Netherlands
*
Author to whom correspondence should be addressed.
Sustainability 2018, 10(11), 4249; https://doi.org/10.3390/su10114249
Submission received: 20 October 2018
/
Revised: 2 November 2018
/
Accepted: 4 November 2018
/
Published: 17 November 2018
(This article belongs to the Special Issue Public-Private Partnerships for Sustainable Development)
Abstract
:To tackle the multiple challenges facing the cocoa sector, voluntary sustainability standards and corporate initiatives, largely focusing on farm and farmer group scale, are often implemented by public–private–civil society partnerships of stakeholders further in the value chain. This paper looks at the social, economic, and environmental effects of such initiatives, based on empirical evidence from large-scale, mixed-method studies using a suite of socioeconomic, agronomic, and environmental indicators to compare the situation of UTZ certified with non-certified farmers in 2012 and 2015 in Ghana, and 2013 and 2017 in Ivory Coast. The results show that, on average, outcomes are mixed and generally modest. However, significant cocoa productivity and income increases were experienced by certified farmers receiving a full package of services. However, the type and intensity of services has changed over time, decreasing for half of the farmers, and productivity and income increases are levelling off. These findings suggest that whilst partnerships have created new governance arrangements with an increased focus on sustainable value chains, initiatives which result in a living income and optimise productivity, whilst limiting environmental impacts, require sectoral transformation, continued partnerships, plus a range of other policy instruments to address the persistent, wicked problems in cocoa production.
1. Introduction
1.1. Wicked Problems Converge on Cocoa Farms
The context of cocoa farming has changed little in the last sixty years during which cocoa has been traded as an international commodity [1]. Whilst the term cocoa means “the food of the gods”, at farm level, the cocoa sector faces a number of deeply embedded, interrelated challenges. These include old trees, pests and diseases, which lower tree productivity [2,3,4]; low farmer and worker profits and incomes [5,6,7,8]; persistent poor labour conditions; the use of child and forced labour [9,10]; negative environmental impacts, such as deforestation, soil degradation, and soil and water pollution [11]; coupled with political instability in many of the origin countries [12,13,14,15]. These wicked problems have proved difficult to solve because of incomplete, contradictory, and changing views on how sustainability has been defined in the cocoa sector [16]. Small-scale farmers continue to dominate cocoa production, particularly in West Africa, where they produced an estimated 73% of total production in 2015 [17]. These farmers generally rely on cocoa for a major proportion of their household income [18], and form part of a highly segmented value chain: selling dried and fermented cocoa beans to individual traders or cooperatives, who sell to traders and exporters. Traders then sell to processors and confectionary companies which process cocoa into intermediate products (cocoa powder, butter, and liquor) and, then, into food and cosmetic products [19].
1.2. The Growth of Voluntary Sustainability Standards and Services to Farmers
In contrast to the cocoa farm household scale, at a value chain level, virtually every dimension of international cocoa value chains has changed in the last two decades [20]. In major producing countries, such as Ivory Coast, Ghana, Indonesia, and Cameroon, since the 1990s, exports, market power, and price setting have been largely determined by the private sector. Sufficient quality supply has increasingly become an issue due to growing demand [7,21] and supply variability, due to large annual fluctuations in cocoa production caused by multiple factors, particularly the weather. The tight relationship between supply and long-term cyclical recession and expansion booms has affected global market and farm gate prices [12,13,14,15]. Bean quality has generally been increasing, due to training, increasing use of drying equipment, and market and regulatory standards. The governance of production and quality aspects, input credit and supply, extension services and market infrastructure, has been state-controlled in the main West African producing countries. However, producing country governments have gradually lost their ability to manage the international cocoa market and shape their own domestic markets. Since the late 1990s, a market-based corporate governance and price negotiation system has developed in many production countries, with the breakdown of national institutions, low yielding cocoa harvests, and pressure from international financial institutions for economic structural adjustment. Foreign companies have increased their investments, integration, and position in the chain. Exporters and major traders, such as Cargill, Barry Callebaut, Olam, and Armajaro, then began to buy and sell using London Cocoa Futures market prices. This liberalised system left farmers exposed to global price fluctuations and resulted in reforms in Ghana and Ivory Coast in 1999 and 2012, respectively, including privatising buying and setting minimum export prices [22,23]. Increases in cocoa prices have been more fully and rapidly transmitted to consumers than decreases, indicating the market power of traders and chocolate manufacturers [24,25,26] and the increasing concentration due to mergers, and vertical and horizontal integration. Processors Barry Callebaut and Cargill account for 70% to 80% of cocoa processing worldwide, with traders and grinders Barry Callebaut, Cargill, Olam, Ecom, Sucden, Touton, CEMOI, Cocoanect, and Blommer accounting for 60% to 80% of global cocoa processing. The six largest chocolate manufacturers (Mondelēz International, Nestlé, Mars, Hershey’s, Ferrero, Lindt und Sprüngli) transform 40% of chocolate products worldwide [14,26,27]. Despite large fluctuations in demand and supply [15], demand for cocoa grew by 3.3% annually from 2002 to 2011 [8,27,28].
These institutional, economic, and market changes and restructuring in the cocoa and chocolate value chain have created space for innovation, particularly new partnerships and sustainability initiatives [29], defined broadly in the terms embraced by the United Nations sustainable development goals as including ending poverty and hunger; improving health and education, water, and sanitation; reducing inequalities; decent work and economic growth; combating climate change; responsible consumption and production; protecting and restoring marine and terrestrial ecosystems; and reversing degradation and biodiversity loss.
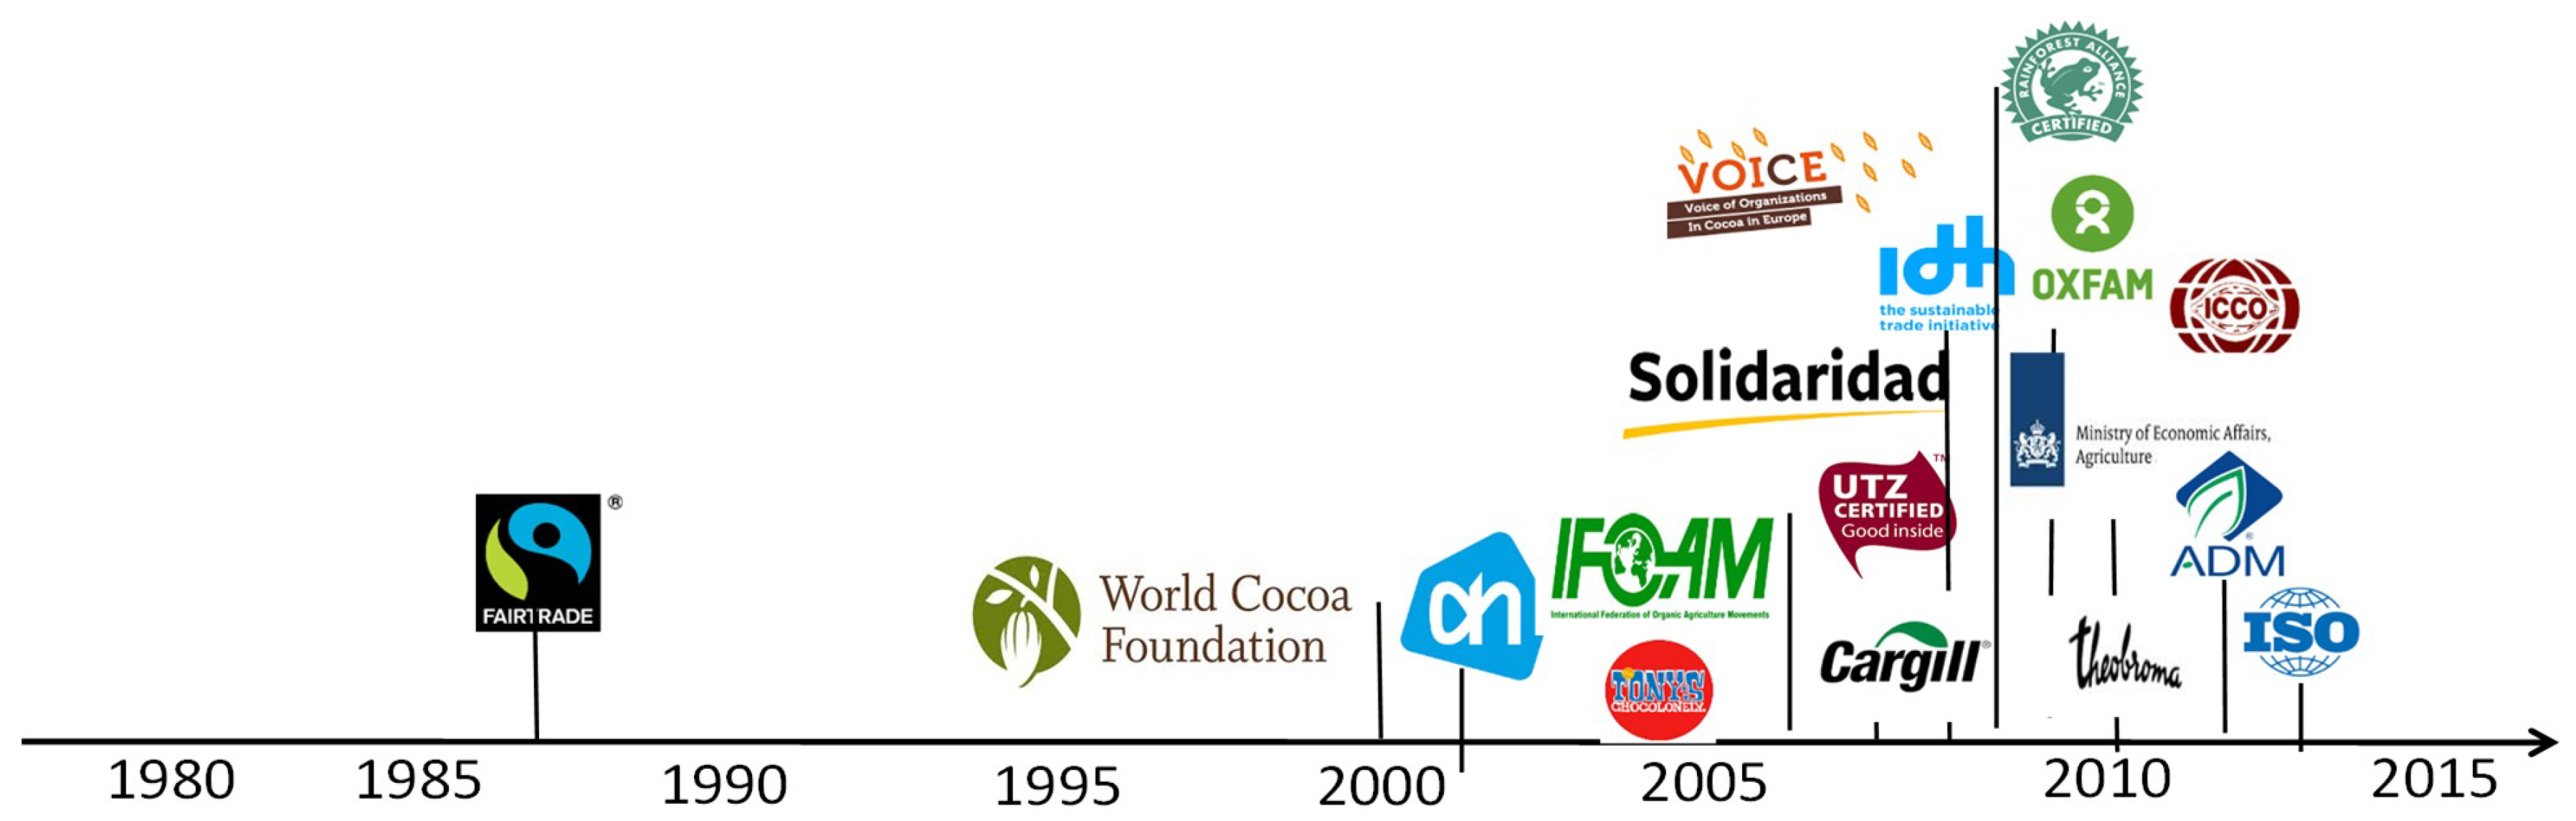
As Figure 1 shows, the majority of sustainability initiatives started in the mid-2000s, and have grown significantly, mainly by replication of similar projects and initiatives by different companies, NGOs, and service providers. They have focused on the two main producing countries, Ivory Coast and Ghana, with outscaling to other larger producer countries. Precise numbers of farmers and cooperatives participating, and volumes produced, are not available, as farmers can join more than one trader’s initiative and have multiple certifications.
Four types of sustainability initiatives are found in the cocoa value chain to address these multiple, long-running “wicked” problems [29,30]:
- (1)
- Voluntary sustainability standards (VSS) have a programmatic nature, and consist of different interlocking mechanisms of which the most important are standards (codes of conduct), internal management system requirements to allow for group certification, traceability requirements, and systems, independent verification, and consumer facing labels. VSS are usually owned and governed by different stakeholders, including producers, retailers, and NGOs [30]. Retailers, chocolate product manufacturers, traders, and processors have all adopted VSS, which is the main force driving the adoption by producers.
- (2)
- Individual corporate initiatives are a form of corporate social responsibility and self-regulation, whereby a business monitors and ensures active compliance with the spirit of the law, ethical standards, and national or international norms. A firm may engage in actions that appear to further a social or environmental good, beyond the interests of the firm and that required by law [31]. Corporate programmes have increasingly been used by traders-exporters, processors, and manufacturers since the mid-2000s, who have offered packages of interventions or services (such as organising farmers into groups, training, credit, and farm inputs (fertilisers, agrochemicals, cocoa seedlings, equipment) to farmers and their organisations, as a way to secure supplies of cocoa beans of specific quality, produced in specific, often traceable, environmental and social conditions.
- (3)
- Platforms, networks, and associations refer to partnerships of private, public, research, and/or civil society (CSO) or non-governmental (NGO) organisations collaborating on a common goal of sustainability with a declared policy or programme and plan of action.
- (4)
- NGO and CSO campaigns have aimed to raise awareness and lobbied for changes on a sector and chain scale.
Many of these sustainability initiatives overlap: platforms, networks and associations have been used to launch VSS and support the introduction of corporate initiatives. VSS have often been accompanied by packages of services, provided by CSOs, NGOs, and/or government agencies. There exist both producer country agencies, such as via the Ghana Cocoa Board (COCOBOD) in Ghana, and the Fonds Interprofessionnel pour la Recherche et le Conseil Agricole (FIRCA) and Conseil du Café Cacao in Ivory Coast; and consumer country government agencies, such as the Dutch Sustainable Trade Initiative (IDH), and embassy programs, such as German Development Cooperation (GIZ) and Swiss Economic and Development Cooperation (SECO). There have also been projects and programmes funded by international organisations, such as United Nations Food & Agriculture Organisation (FAO) and the United Nations Development Program (UNDP), and World Bank. Traders have also collaborated in a variety of national and international associations and platforms with certifiers, and partnered with research organisations, as well as with government organisations [29].
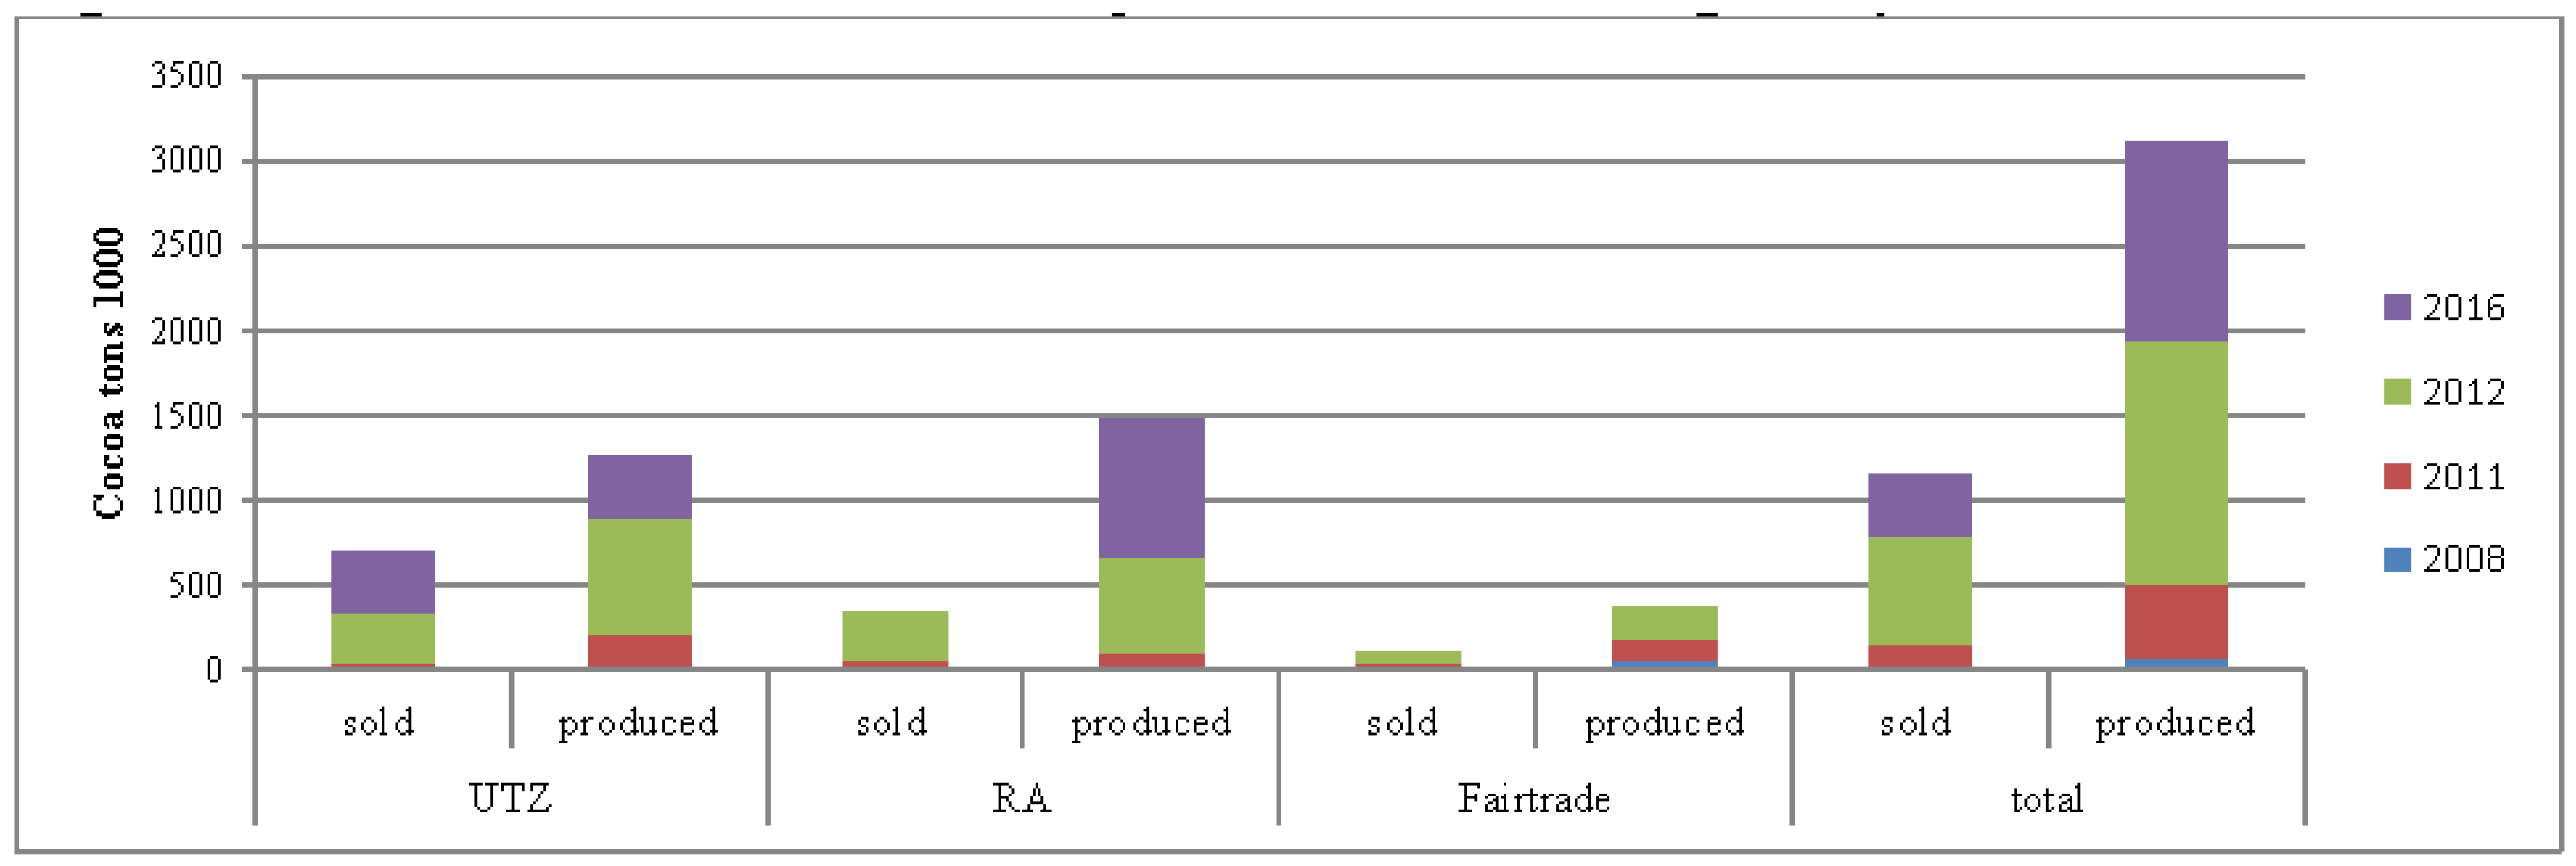
Voluntary sustainability standards have been some of the most notable sustainability initiatives in terms of their increase in scope, scale, and growing coverage of value chain stakeholders. UTZ is a certification program and a label for sustainable farming. UTZ merged with Rainforest Alliance in 2017. UTZ, followed by Fairtrade and Organic, have been the most popular VSS adopted by cocoa traders, chocolate manufacturing, and retail companies from 1987 onwards, shown in Figure 2. In West Africa, UTZ certified cocoa grew sevenfold from 2010 to 2017, by which time 329,978 farmers in Ivory Coast and 144,007 in Ghana were certified, producing 671,854 tons and 176,200 tons i.e., 34% and 19% respectively of the 2016/2017 national production [32,33,34,35]. The UTZ standard focuses on mainstreaming sustainability in farming practices, promoting improving farmer’s agricultural and management practices, with a chain of custody approaches, traceability, and transparency reflecting concerns by consumers and NGOs about chain governance. Seven of the main trader-exporters and processors in West Africa have adopted UTZ and, often, a second certification scheme.
Despite the growing body of literature assessing the impacts of sustainability initiatives [32,36,37,38], questions remain about whether voluntary sustainability standards and associated interventions are effective, and with what environmental and social-economic outcomes. Many evaluations attempting to answer these questions have been small scale, limited to specific locations, certification standards, and countries; cover a limited time period; and have been published as grey literature, where the methodology and robustness is often unclear. To fill this gap, this study uses a large sample of stakeholders in the two largest cocoa production countries, rigorous qualitative and quantitative methods to investigate the impacts of voluntary certification and related packages of services, asking what has been the impact of sustainability-focused interventions on cocoa farmers in West Africa?
2. Materials and Methods
2.1. Data Collection
To analyse the contribution of sustainability initiatives to farmer livelihoods, panel data were collected from over 778 cocoa farming households in Ghana and Ivory Coast between 2012 and 2017, 18 focus group interviews with farmers, and 22 interviews with other stakeholders in the value chain. Two rounds of farmer household surveys were implemented in each country among UTZ and non-certified farmers (see Table 1). In Ghana, a total of 385 farmers belonging to six cooperatives were interviewed in 2012, and 352 farmers were interviewed, again, in 2015. Two-thirds of the farmers were UTZ certified in both years. In Ivory Coast, 725 farmers belonging to 97 cooperatives were interviewed in 2013 and, in 2017, 426 farmers in 42 cooperatives. The sample size used is considered representative with the majority of farmers (80%) being UTZ certified in both rounds. High attrition rates and the share of farmers no longer certified prevented a random selection of the 2017 Ivory Coast sample. Tests were conducted to explore differences between this sample in 2014 and in 2017. Using regression analysis, the 2017 sample had more farmers in the “good agro-ecological zone”, owning a larger portion of their land and with a slightly higher share of cocoa income in their total gross income. These differences, however, did not bias the overall representativeness of findings.
To obtain a representative sample, UTZ farmers and comparable non-certified farmers were selected. Certified farmers were selected randomly from lists provided by UTZ and traders. Non-certified farmers (i.e., neither UTZ or certified by other certification schemes) were selected from lists of households in the community held by village chiefs and, in some cases, by snowball sampling. This group of comparison farmers were selected as being outside the direct influence of UTZ activities and living in communities far enough (at least 15 km) from certified farmers, such that they would not be affected by possible spillover effects. In both countries, UTZ farmers and non-certified farmers were sampled from three different agro-ecological climatic zones for cocoa production (excellent, good, and poor) [39], to allow representative findings at country level.
Table 2 provides an overview of the characteristics of certified and non-certified households in the baseline situation. These characteristics were used to compare certified and non-certified farmers because they constitute the main observable characteristics of cocoa farmers which are not expected to be directly influenced by certification. In Ghana, certified farmers had a lower share of hired labour and slightly more farms. Certified respondents were also more often female. However, generally, households were fairly similar in the baseline with no statistical differences for 11 of the 14 characteristics. In Ivory Coast, significant differences between certified and non-certified farmers were found, but were limited in size, with non-certified farmers having significantly smaller household sizes and smaller farm sizes (through relatively more under ownership), being older, more often living in agro-ecological zone 2 or 3, and being less dependent on cocoa as a source of income in 2013. These results confirm that the sampled certified and uncertified farmers were fairly comparable.
In addition to the farmer household survey, to increase validity [40], a mixed-method approach was taken, with qualitative data collected in focus group discussions and stakeholder interviews using structured questionnaires. In total, 18 focus group meetings were conducted in the communities where farmers and their cooperatives are located (10 in Ivory Coast in 2013 and 14 in 2017, 8 in Ghana in 2015). In-depth interviews were also conducted with cooperative managers in both periods (6 in Ivory Coast), traders (7 in Ivory Coast and 5 in Ghana), support organisations (2 in Ivory Coast and 2 in Ghana), and school teachers (6 in Ivory Coast).
2.2. Indicators
Indicators for data collection were established based on theory of change impact logics for both countries, developed together with UTZ, IDH, Solidaridad (for Ghana and Ivory Coast) and, also, Cargill (Ivory Coast). The impact logic draws on UTZ’s “Better farming, better future” theory of change. These indicators were transposed into the survey, focus group, and stakeholder interview questionnaires. In both countries, environmental, economic, and social indicators, shown in Table 3, were used to measure the outcomes of sustainability activities implemented.
2.3. Farmer Household Data Analyses
The farmer household survey data was quantitatively analysed. To empirically test for the contribution of UTZ certification using the farm household data, a difference-in-difference analysis was conducted. The difference-in-difference analysis compares the change in the performance of the outcome indicators between two moments in time (the first difference) for UTZ certified farmers, compared to changes in the same time period among uncertified farmers (the second difference). The change in outcome indicators (Y), shown in Table 3, Table 4 and Table 5, is a function of being UTZ certified in both years (UTZ), with (X) differing between Ghana and Ivory Coast, and subscripts i and t denoting household and time period (baseline and endline measurement), respectively. Differences over time might be the consequence of factors other than UTZ certification or the implementation of associated projects, such as specific farmer characteristics. To control for this influence, in our estimation of impact we include a set of farmer characteristics (aside from those controlled for in the sampling design and using panel data), as presented in Table 2. Equation (1) is estimated using ordinary least squares (OLS).
Equation (1) assumes UTZ certification is a one-size-fits-all “treatment”, which is not the case (see Introduction). Different farmers received different packages of services alongside certification, such as training, agricultural inputs, and/or credit. As all farmers in the process of certification in 2013 were fully certified by 2017, the associations between the types of services farmers received and different outcomes were evaluated. Four levels of service intensity were identified based on the farmer questionnaires. The services included were finance (advance payments on cocoa or credit), agricultural (“good agricultural practices” (GAPs) as defined in the UTZ Code of Conduct for cocoa) training, cooperative training, management training, social training, access to farm inputs via cooperative or service providers, and free farm inputs. In Ghana, this analysis was not conducted, due to the different context in which certification and associated services occurred. However, the influence of specific certification-related variables was evaluated: whether farmers participated in the certification-related training, the total number of training activities they participated in, and whether or not farmers are lead farmers in certification-related activities.
To empirically test the contribution of different service intensities on the performance of selected indicators, the change in outcome indicators (Y), in Table 3, as a function of service intensity Z, and a selection of farm household characteristics (X), was estimated using Equation (2), where subscripts i and t denote household and time period (baseline and endline measurement) respectively:
Equation (2) uses ordinary least squares (OLS) for UTZ certified farmers only, excluding non-UTZ farmers, as the number of farmers receiving higher intensity services levels was too small for advanced statistical analysis. As in Equation (1), a set of farmer characteristics was controlled for. Estimates from Equation (2) should not be interpreted as causal relations as some farmers may have decided to participate in some service packages and some types of farmers may be more likely to become certified than others.
2.4. Building the Counterfactual: Robustness Analysis and Validation
To build a strong counterfactual i.e. “What would have happened without UTZ certification and associated interventions?”, the results from Equations (1) and (2) were tested for robustness and combined with the results of qualitative data analysis to triangulate, validate, and explain differences or lack thereof. In Table 3, Table 4 and Table 5, we indicate results are robust if the quantitative models, discussed below, show similar results in terms of sign and significance.
In Ghana, the models were tested for robustness in two ways. First, an alternative OLS estimation (Equation (1)) using propensity score matching (PSM) was used. The propensity score, defined as the probability of receiving a treatment given observable covariates, was determined using a two-step process. First, the extent to which certified and non-certified farmers are comparable on a range of observable characteristics (“common support”) was tested, with common support high (see Table 2), indicating that certified and uncertified farmers are highly comparable. The second robustness test used clustered error terms at village level, to ensure the model was not biased by the similarity of farmers in the same community tending to be more similar than farmers in different communities. In Ivory Coast, as certification programs had started before baseline data was collected, the first test was a simple OLS model to explore baseline and endline differences in isolation. Secondly, Equation (1) was tested for robustness by including the number of years certified in the model. Thirdly, an effect model at the household level was used to control for omitted variable bias. The results are considered as robust when the results of all these models indicate the same direction in terms of sign (positive or negative) and statistical significance. Common support was tested (see Table 2) and found to be high.
Qualitative data were transcribed from interviews and coded based on the indicators, then analysed using content analysis and simple statistical analysis. These results were used to triangulate, validate, and explain results from the quantitative analysis. Preliminary results of all datasets were presented and verified at meetings in Ivory Coast and Ghana attended by cooperative managers, traders, government, and UTZ representatives after each data collection round. During these meetings, an assessment of external and unexpected influences which could affect farmers’ performance on the indicators—such as the Ivorian government’s reform of the sector and weather effects on cocoa production—was also conducted. Participants also triangulated and interpreted the findings, particularly when different data sources provided different results. Qualitative data was also used to interpret potential spillover effects.
3. Results
The results are presented for the three outcomes areas on the indicators. For each indicator, for the results of the farmer household survey the difference-in-difference coefficient, and whether it is statistically significant is reported and, also, whether the effect is robust to different model specifications and whether there are relationships between the difference-in-difference analyses. Results from the stakeholder interviews are also presented.
3.1. Better Incomes, Better Crops—Economic Indicators
Table 4 presents the status of certified and non-certified farmers on the five economic indicators: production practices, productivity per hectare, production cost per hectare, profit per hectare, and total cocoa income.
Farmers improved the implementation of good agricultural practices related to production over time. While uncertified farmers started at a slightly lower level, their implementation of good agricultural practices increased at the same pace. UTZ farmers perform slightly better, but far from optimal (a score of one). The change over time is slightly higher for non-certified farmers, but differences are not statistically significant. In Ivory Coast, the improvement over time is significantly bigger for farmers receiving the most complete packages of services in the past year.
Cocoa production per hectare increased over time for Ghana and Ivory Coast, although the increase is more prevalent in Ivory Coast. However, overall productivity levels continue to be generally low for all farmers, with an average of 321 kg/ha in Ghana and 480 kg/ha in Ivory Coast. In Ghana, the current level of production, as well as changes over time, were similar for UTZ and non-certified farmers. Whether farmers participated in the programme-related training, the total number of training activities they participated in, and whether or not farmers are lead farmers in the programme, were not related to changes over time. In Ivory Coast, UTZ farmers had significantly higher productivity, in 2013 and in 2017, than non-certified farmers. The average production of UTZ farmers stayed the same between 2013 and 2017, whilst non-UTZ farmers’ productivity increased considerably, to 146 kg/ha on average. Since non-UTZ farmers’ productivity increased, the difference in productivity between UTZ and non-certified farmers has become smaller. Results are robust for different models. The more services UTZ farmers received, the higher their yield in 2017. For farmers receiving the highest service package intensity, the difference between 2013 and 2017 is statistically significant compared to the changes in cocoa production of farmers receiving no services. Stakeholder interviews and the focus group discussions all highlighted that external factors affect productivity both positively and negatively, particularly weather conditions, with no clear trends for agro-ecological zones, and affecting both UTZ and non-UTZ farmers.
Overall total net cocoa income increased over time. Farmers experienced a significant increase in total production costs per hectare, attributed to the significant increase in labour costs. The cost of farmer’s and their household members own labour is not included in production cost calculations. In Ghana, production costs were higher for farmers participating in training more often. Cocoa price increases offset rising costs of production (especially for hired labour) and increased cocoa profitability, per hectare, for all farmers. The increase in production costs per hectare, profit per hectare, and total income from cocoa (net in Ghana, and gross in Ivory Coast) was not significantly different for certified and uncertified farmers. Profit per hectare and total cocoa income was higher for UTZ farmers than uncertified farmers. The few differences in cocoa income between UTZ and non-certified farmers were attributed to non-certified farmers also having access to farm inputs, services, and training, with increased income attributed to productivity increases as well as, in Ivory Coast, to the sector reform.
In 2017, Ivorian cocoa farmers had, on average, one other source of income, ranging from one to four sources, with 72% of farmers having a second source of income. In contrast, fewer Ghanaian farmers reported other sources of income in 2014 than in 2011 and, those who did, had fewer sources than in 2011. More farmers depended entirely on cocoa in 2014, with no differences in the change in average income earned from other sources for certified and uncertified farmers over time.
3.2. Better Lives—Social Indicators
Table 5 presents the status of UTZ and non-certified farmers regarding three social indicators: implementation of social practices; whether children conduct hazardous activities; and farmers’ use of personal protective equipment. For each indicator, the difference-in-difference coefficient and whether it is statistically significant are reported, whether the effect is robust to different model specifications, and whether relations between the difference-in-difference analyses support modalities.
The implementation scores for good social practices increased over time in both countries. Certified farmers performed slightly better, but no significant differences were found in improvements over time. A similar pattern emerges for indicators on child labour, use of protective equipment, and waste management. In both countries, there was a reduction in the number of farmers that report using child labour. In Ghana, children under the age of 14 worked significantly fewer days doing hazardous work than children on uncertified farms in 2014 and, for both groups, the number of days is extremely limited: 0.15 days versus 0.6 days per year, respectively, on average. There were no differences in the use of child labour between certified and uncertified farmers in 2011 and 2014, nor was there a noticeable change over time. In Ivory Coast, the proportion of all farmers reporting using child labour decreased over time, however, 14% of uncertified farmers and 16% of UTZ farmers reported children conduct activities prohibited by the UTZ Code of Conduct, which only permits children under 18 to conduct light work on family farms for a limited number of hours, as long as the work does not jeopardise their physical and mental well-being, or interfere with their schooling. In Ivory Coast, 35% of UTZ farmers knew the minimum age for children to work on the farm, compared to 18% of non-certified farmers. On average, 32% of farmers knew the correct minimum age. Knowing the minimum age is weakly positively correlated with being an UTZ certified farmer. The small decrease in the use of child labour was attributed in stakeholder interviews and focus group discussions to improved knowledge about child labour rights and schooling children due to projects and programmes, however, they also highlighted the continuing, general low awareness of farmers in respect of (inter)national labour standards.
In Ghana, few differences over time were found between certified and non-certified farmers in the use of personal protective equipment (PPE). In focus group discussions, most certified farmers attributed positive changes in their health to better health and safety practices, and training on chemical use, waste management, and PPE use. In Ivory Coast, UTZ certified farmers reported better implementation of GAPs on protective clothing than non-UTZ farmers, with no differences between UTZ farmers related to service intensity. UTZ farmers scored 0.46 points (on 0 to 1 scale), which indicates there is room for improvement as farmers do not use all protective items. The difference over time was higher for UTZ farmers, but not statistically significant once other farm and household characteristics were controlled for. Ivorian cooperative managers reported improved working conditions attributed to certification, such as the use of spraying gangs to apply farm chemicals, GAP training, and the presence of first aid kits, combined with community projects which included health centres.
3.3. Better Environment—Environmental Indicators
Table 6 presents the status of farmers from certified versus non-certified farmers regarding 3 different types of social indicators: (1) implementation of environmental practices, (2) whether farmers use compost on cocoa farms, (3) whether farmers have shade trees on cocoa farms, and (4) how they manage chemical waste.
The implementation of good environmental practices increased over time in both countries, although only very marginally in Ghana. Certified farmers performed slightly better than non-certified farmers, and have been catching up to the levels of certified farmers. Cooperative managers and focus groups indicated that soil and water quality had improved, mainly due to less or better input use and implementation of GAPs, and to better water pumps, partly provided by cooperatives and trader partners. In non-certified cooperatives, no such outcomes on environmental indicators were noted.
In Ivory Coast, more farmers used compost than in 2013 with, on average, 21% of UTZ and 18% of non-UTZ farmers using compost in 2017, compared to 14% and 4%, respectively, in 2013. There is no statistically significant difference between UTZ and non-certified farmers. Regarding shade trees, UTZ certified farmers perform much better but, also on this indicator, non-certified farmers are catching up. In 2013, 19% of UTZ farmers reported planting shade trees in the previous two years, compared to 0.5% of non-UTZ. In 2017, 27% UTZ and 2% non-certified farmers reported planting shade trees in the previous two years. In 2017, 18% of all farmers (of which 85% were UTZ farmers) did not plant shade trees because they already had enough shade trees on the farm. The results in Ghana are contrary to Ivory Coast (where there was no increase in GAP related to shade trees), but was an improvement in both groups, albeit not statistically significantly different. Scores on five questions regarding how farmers apply and manage agrochemicals and chemical waste were combined into a score between zero and one, with one indicating 100% compliance with GAP. UTZ farmers score higher in both years, although this difference decreased over time as non-certified farmers caught up. UTZ farmers scored 7.2 out of 10 on handling agrochemicals and waste, and non-certified farmers scored 7 out of 10. In the focus group discussions, the majority of farmers noted improved waste management practices and attributed this to training from the Agence Nationale d’Appui au Développement Rural (ANADER)—as part of certification and for non-certified cooperatives. Most cooperative managers also indicated that farmers had improved waste management practices.
3.4. Changes in Service Packages and Intensity
Certification in West Africa was increasingly accompanied by packages of services in the time period studied. In Ghana in 2011, 61% of UTZ farmers indicated that their producer organisation provided at least one additional service other than buying cocoa; in 2015, this increased to 67%. Trader data indicate that service delivery, in terms of the number and intensity of services and number of farmers using them, increased over time, but that not all farmers use the services every year. Certified and uncertified farmer’s satisfaction with the services provided over time increased, although not significantly. Numerous projects were implemented in the study area—providing training, seedlings, farm inputs, and community support, similar to that received by certified farmers, for example, the World Cocoa Foundation’s Cocoa Livelihoods Program and farmer business schools. In Ivory Coast, since 2012, traders, the Conseil Café-Cacao, and partners, have been supporting farmer organisation, with an estimated 33% [44] to 50% [45] farmers in groups. A growth in the number of projects by government agencies, international donor agencies, traders, grinder-processors, and cocoa manufacturers, as well as by intermediary buyers known as pisteurs, and cooperatives, was perceived. In focus group discussions, in both countries, it was noted that it takes time for some interventions, such as access to farm inputs, and especially seedlings, to have an effect on cocoa productivity and incomes.
4. Discussion
Given these results, the impacts of voluntary certification and related packages of services on cocoa farmers in West Africa are discussed first, followed by the extent to which these outcomes meet sustainability challenges.
4.1. Positive, Mixed, and Modest Impacts of Certification and Service Packages for Farmers
UTZ certified farmers have productivity rates of on average 321 kg/ha in Ghana and 480 kg/ha in Ivory Coast, with farmers achieving up to 1491 kg/ha in Ghana and 1400 kg/ha in Ivory Coast. As production nationally averages between 500 to 600 kg/ha, with potential for 1900 kg/ha in West Africa [1], this finding suggest there continues to be room for major productivity improvements. However, the costs of making these improvements, both financially and in terms of changing farming systems, the effects and trade-offs for other crops and food produced for subsistence use [18], and environmental impacts—such as biodiversity [46,47], need to be taken into account. Certified farmers receiving more intensive service packages have higher productivity levels. Input provision, combined with targeted training, appear to be the most effective interventions. The reliance on one predominant species and dominance of low-yielding cocoa varieties may contribute to low yields, and increases the risk of vulnerability to pests and diseases [48,49,50]. UTZ farmers in Ivory Coast and Ghana continue to have significantly higher net cocoa income and profit, and higher production and labour efficiency than non-certified farmers, but this decreased slightly in the endline measurements in both countries. Farmers attribute income changes in part due to productivity, but also to external factors such as price reforms, and the weather—highlighting how important short-term, but also longer-term, resilience in responding to climate changes is. Notably, in both countries, farmers faced increased costs—particularly for labour—which decreased profits for all groups, pointing to the importance of looking at cocoa farming as just one part of the resilience of household income generating strategies, a factor highlighted in recent studies [18,25]. Again, over time, non-certified farmer’s incomes caught up with UTZ farmers. These findings, related to increased productivity and incomes for certified farmers, match those of other certified commodities [32,36,37,38].
UTZ certified farmers, however, seem to have reached a plateau in terms of production and income, aided by packages of training and high intensity services. These results suggest that it is difficult to go beyond this ceiling to achieve significant income improvements that result in a living income for the majority of cocoa farmers with the current approach. Also, that scaling up that results in moving a larger group of farmers towards a higher income and profitability has not been possible, although non-certified farmers are catching up to this celling. Productivity increases by non-certified farmers are explained by the fact they have also received similar services and organisational support, although not with the same intensity as the UTZ certified cooperatives. Services are now also being offered to non-certified farmers by pisteurs and traitants (types of intermediary trader-wholesalers) as an incentive to ensure farmer loyalty. Cooperatives have been created and certified as a means to access markets, rather than in the cooperative spirit common in the early years of the UTZ and company programmes. These aspects help explain why farmers are less satisfied with their cooperatives. However, farmers are still happy to have received “new” services and, particularly, the premiums that cooperatives receive are valued and used for a variety of local cocoa, but also, social community development initiatives.
Reasons why non-certified farmers have caught up with certified farmers are that uncertified farmers have also received training, which allowed them to develop in a similar way as certified farmers. such mainstreaming also appears over time for other certified commodities [38]. The impact of input services provided by traders also probably has not taken effect yet, as not all farmers use these services yet, and it takes time for fertiliser applications, pruning, and planting seedlings to affect productivity. Unfavourable climatic conditions were indicated to have negatively influenced productivity in 2014, affecting both uncertified and certified farmers and, thus, was not the impact of certification.
4.2. Sustainability Initiatives: Separating Certification from “Certification Plus”
Both prior to, and during, UTZ certification, there have and continue to be over 40 sustainability interventions [51,52,53,54]. Many interventions occur both nationally and on a very local scale, implemented by multiple partners. There is significant similarity between these interventions, and those implemented as part of UTZ, Rainforest Alliance, and Fairtrade certification, which makes it difficult to attribute changes specifically to UTZ certification. Specific activities implemented by traders participating in the UTZ certification programmes included cooperative capacity building, farmer training, farm and farmer professionalisation, provision of inputs and equipment, financial support and enabling access to credit, cooperative, and community development. Strong differences were found between traders’ approaches to implementing certification as a stand-alone activity, or as part of a package of activities.
Service packages appear to lead to positive socioeconomic impacts, with specific packages (the “agricultural training + one input” package, and the “agricultural training + pesticides and fertiliser” package) being significantly associated with increased productivity and net cocoa income improvement for UTZ farmers. UTZ farmers with a complete agricultural service package earn a significantly higher net cocoa income and a higher net cocoa income per hectare in 2017. Cocoa income is also higher for UTZ farmers who received a fuller agricultural service package (agricultural training + one input, agricultural training + pesticides and fertiliser). UTZ certified farmers receive more intensive service packages: the majority received more than two services. However, 47% of UTZ farmers experienced a decreased intensity of services in 2017 compared to 2013, which has implications for their productivity and income in the short-term future, which could be expected to remain static.
4.3. Spillover from Certification
Certification provided a means to rapidly upscale sustainable cocoa production and allow farmers to access to certified markets where they aim to benefit from premium prices, as an additional price reward for sustainable cocoa production practices. Certification has promoted more professional producer associations, which farmers perceive as providing a wider range of benefits. Although farmers are generally satisfied, they indicated that services can be improved.
By revitalising the sector, certification appears to have contributed to making cocoa farming more attractive. Other outcomes of certification were that it provided a means for traders, grinders-processors, and manufacturers to rapidly upscale the volumes of certified cocoa production, and allowed farmers to access certified markets where they can benefit from premium prices. However, depending on the standard, between 40% and 80% of cocoa produced as certified gets sold as certified [14]. Certification promoted professional producer associations, which farmers perceive as providing a range of benefits, although some of which farmers and cooperatives indicated these could be improved.
Certification in general, and specifically UTZ in the cases measured, has created ripples at company and service provider level, creating a “cooperative + service package” model that is now common in both the corporate cocoa sector, as well as in government extension service provision. Certification can be seen as a vehicle to which services have been attached, enabling an increased intensity and broader package of services to be provided.
The growth of cocoa certification in Ghana and Ivory Coast since the baseline measurements has meant that there is more chance that non-certified farmers, who are cooperative members and, plausibly, also farmers who are not members of cooperatives, come into contact with certified farmers. This was evidenced by the UTZ data on cooperative growth and locations, the qualitative data, and verification meeting. This means that the chance of spillover of knowledge and practices from certified to non-certified farmers has increased. Farmer data also indicate that certified farmers share lessons from training they have received with other farmers. When farmers share knowledge, they notice that others changed their practices. Therefore, although not anticipated in the UTZ theory of change, spillover effects contribute to the impact of certification.
4.4. Positive Outcomes, but Still Insufficient?
The need for sectoral transformation to achieve “sustainable” cocoa has been heatedly debated, for example, in the annual World Cocoa Conferences, which have brought together many stakeholders in the chain since 2012. Transformation models, so far, have used a supply chain or a sector approach, but despite considerable progress, have not yet led to the desired results [55,56]. Whilst innovations in the sector (particularly certification and public–private partnerships) and upscaling of investment occurring in the cocoa sector on sustainability are recognised, the risk of continuing these current, mainly voluntary, often non-inclusive and unaligned approaches, in the “broken” cocoa supply chain [57], is that only incremental change in the sector will occur. This risk has been emphasised not only by academics [56], but also by cocoa farmer groups [58] and civil society organisations [14,26]. The private sector continues to emphasise the use of public–private partnerships to accelerate change [59]. However, these current approaches, whilst sustaining the industry, do so under deteriorating conditions, leading to decreased farmer socioeconomic and environmental system resilience, without enabling smallholders to claim rights, have a voice and greater representation (i.e., transition), or tackle the fundamental causes of smallholder vulnerability. Current approaches also fall short of increasing the resilience of producers to climate change (i.e., transformation) [56], and addressing structural problems in the supply of good quality sustainable cocoa. Sectoral reforms in West Africa have, in contrast, shifted away from the market liberalisation in the 1980s towards more state involvement and regulation of the value chain—including market and pricing mechanisms, licensing buyers and exports, controlling cocoa genetic materials, capacity building of farmers, and aligning private and civil society interventions in the sector.
Sustainable sector transformation, therefore, needs to be holistic, relying not just on public–private partnerships, but on a much wider societal partnership, with public–private–civil society–producer–research engagement. Such a societal partnership needs to recognise conflicts of interests and trade-offs, to address drivers and conditions for change (strengthening demand; sector alignment and accountability; organisation of service providers and the production base; and public and private sector governance) [55], guided by recognition that transformation can occur only if market and regulatory incentives encourage continuous improvement, and if there is sufficient value at farmer level to (re)invest in the sector with limited external assistance.
5. Conclusions
This study shows that the impact of sustainability-focused interventions in the form of voluntary certification and related packages of services on farmers in West Africa has been mixed and modest. On average, the outcomes in terms of farmers’ incomes, optimising cocoa productivity, farmer’s and farm workers’ living and working conditions, agricultural practices and environmental effects have been modest, when assessed over time and in terms of the outcomes experienced by certified farmers compared to non-certified farmers, in similar agro-ecological regions. However, for a smaller group of certified farmers receiving an intensive package of services and farm inputs, certification has had positive, significant impacts on incomes, crops, lives, and the environment. A notable spillover effect is that certification has paved the way for programs that offer more comprehensive service packages, which have resulted in a change in the sector.
These findings suggest that public–private partnerships have created new possibilities by developing voluntary governance arrangements that focus on improving sustainability in value chains. The use of voluntary sustainability standards and supporting corporate initiatives have been extensively scaled up by traders in Ivory Coast and Ghana, with support from chocolate manufacturers, retailers, and tacitly supported by consumer country government organisations in the Netherlands, Germany and Switzerland. These voluntary sustainability standards were then later combined with different initiatives financed and implemented by government agencies, trader’s corporate initiatives, CSOs and NGOs, and network, platforms, and associations.
The extent that these voluntary sustainability certification initiatives and associated corporate initiatives have had modest outcomes for the majority, indicates their limits. These findings also point to a need for broad sectoral transformation (in cocoa and agriculture), continued partnerships, plus a range of other policy instruments to address the persistent, wicked problems in cocoa production.
Although pathways to impact foreseen in the theories of change in both countries are largely confirmed, there remains a gap between what certification alone has been expected to deliver and actually has been delivered. Impacts have not been felt by all certified farmers, and the level of impacts have generally been marginal for certified farmers, in general, in terms of crop productivity, incomes, and the environment. Lessons learnt from this study are that, firstly, certification alone has not led to impacts such as improving farmers’ livelihoods beyond poverty levels and assuring social risk-free cocoa. A reason is that productivity and income increases are levelling off, which suggests that productivity increases for UTZ certified farmers have plateaued, while non-certified farmers are catching up with UTZ certified farmers. This is also as result of positive spillover effects, which itself can also been seen as an indirect positive impact, not foreseen in the impact logics.
Secondly, pathways to impacts at different scales (farmer level and farmer group) were largely as foreseen: well-functioning cooperatives and trader-led groups formed a vehicle to certification, providing packages of services to members. Training and adherence to the UTZ Code of Conduct was generally associated with better crops, incomes, and environmental outcomes and knowledge applied, in practice.
Thirdly, there were also unanticipated outcomes at producer and company level: a professionalisation of farmers and cooperatives; increased intensity and broader range of services provided mainly by private sector (sometimes hiring in public sector agencies such as ANADER in Ivory Coast) alongside certification and increased farmer satisfaction with cooperatives. There appear to be positive spillover effects as certification activities have been scaled up and certification-related practices (particularly attention on the good agricultural and social practices embodied in the UTZ Codes of Conduct for cocoa) have also been replicated by government, resulting in non-UTZ farmers coming into contact with certified farmers and certification-inspired practices, learning and adopting similar techniques to generate higher productivity and cocoa-related income. Certification can, therefore, be seen as a vehicle to which more services have been attached, enabling an increased intensity and broader package of services to be provided.
These conclusions lead to the following recommendations for societal partnerships implementing sustainability initiatives in the cocoa sector:
- (1).
- Focus on topics that matter most: target interventions more closely to match farmers’ varying demographic, economic, and farm characteristics, with tailored mixes of service packages that focus on farmers’ specific needs and the most problematic practices relating to child labour, input use, shade trees, and waste management.
- (2).
- Address the specific barriers (such as farmer uncertainty about investing in cocoa related to tenure and fluctuating prices, farm renewal costs) and enablers (such as targeted access to farm inputs and training, taking a farm household approach rather than focusing only on cocoa) to improve sustainable cocoa production and livelihoods of cocoa farmers.
- (3).
- Current incentives of certification and associated services are insufficient to motivate all value chain actors: higher cocoa productivity often entails higher costs for farmers, while not all certified farmers receive a premium, since not all certified produce is sold as certified, due to low market uptake. A stronger uptake of certified cocoa by the industry is needed to reward and compensate certified groups and farmers for their sustainability investments. These factors suggest that investments are needed to close sustainability gaps and reinvent tools to sufficiently and adequately implement and diagnose and address sustainability gaps and underlying causes. This includes tensions of (over)supply and low prices, which harm farmer incomes, risk mitigation and accessing more profitable value chains, and enabling access to credit.
- (4).
- Combine high intensity packages of good agricultural practice training with farm inputs to have higher economic impact. The most successful service delivery models have provided training via cooperatives free of charge for farmers, with fertilisers and agrochemicals generally provided on credit, paid for with cocoa beans. The main risks of this model for farmers and cooperatives are being locked into a supply chain or purchasing contracts that, depending on prices and premiums, may not be attractive. For traders and service providers, there are also risks of providing services and farm inputs to farmers and cooperatives who eventually may default.
- (5).
- Certification organisations, and grinders/processors, traders, and manufacturers providing services, could engage with the government and CSOs to ensure a holistic, complementary, and aligned sector, value chain, and landscape scale interventions. An example is the Cocoa & Forests Initiative, which started in 2017 in Ghana and Ivory Coast, where the majority of public and private stakeholders are involved, and local, national, and international scales of action are connected to address cocoa related deforestation and degradation holistically.
- (6).
- Focus on combining bottom-up farmer and top-down industry and government visions for a sustainable cocoa sector. The current imbalances in power in the value chain between stakeholders in the value chain mean that hearing farmers’ and their organisations’ voices and visions in partnerships is imperative. Initiatives that strengthen farmers’ engagement in societal partnerships, such as emergence of stronger national and international cocoa farmer’s organisations, such as the merger between World Cocoa Farmers Organization (WCFO) and the International CoCoa Farmers Organization (ICCFO) are, therefore, critical.
- (7).
- Take a transformational approach to provoke systemic change in the West African cocoa sector. A systemic transformation should address at least the issues of environmental degradation, farmer households, and living incomes, worst forms of labour, and the interlinks between national, regional, and international cocoa market economics and politics, that are currently largely unaffected by certification and corporate sustainability programs.
Author Contributions
Conceptualisation: V.I., Y.W., F.v.R.; Methodology, F.v.R., V.I., Y.W.; Formal Analysis: F.v.R., V.I.; Writing—Original Draft Preparation: V.I., F.v.R., Y.W.; Writing—Review & Editing: V.I., F.v.R., Review: H.G.; Project Administration: V.I., Y.W.; Funding Acquisition: V.I., Y.W.
Acknowledgments
Funding for fieldwork, analysis and separate reports on the panel data for Ivory Coast and Ghana was provided by UTZ, Solidaridad and the Initiative for Sustainable Trade (IDH).
Conflicts of Interest
UTZ, Solidaridad and IDH were funders of separate baseline and endline studies [52,53,60,61] on the impact of UTZ certification and IDH cocoa programs in Ghana and Ivory Coast, the datasets of which have been combined and analysed for this paper. The funders did not have a role in the design of the analyses or data interpretation in this paper and did not cover publication costs of this article.
References
- Wessel, M.; Quist-Wessel, P.M.F. Review: Cocoa production in West Africa, a review and analysis of recent developments. NJAS Wagen. J. Life Sci. 2015. [Google Scholar] [CrossRef]
- Ruf, F. The Cocoa Sector. Expansion, or Green and Double Green Revolutions; ODI: London, UK, 2007; p. 3. [Google Scholar]
- KPMG. Cocoa Certification A Study on the Costs, Advantages and Disadvantages of Cocoa Certification; The International Cocoa Organization (ICCO): Den Haag, The Netherlands, 2012; p. 99. [Google Scholar]
- Mejia, R. Increasing Productivity of Cocoa in Côte d’Ivoire, Ghana, Indonesia and Colombia. Master’s Thesis, Purdue University, West Lafayette, IN, USA, 2011. [Google Scholar]
- Quarmine, W.; Haagsma, R.; Huis, A.V.; Sakyi-Dawson, O.; Obeng-Ofori, D.; Asante, F. Did the price-related reforms in Ghana’s cocoa sector favour farmers? Int. J. Agric. Sustain. 2014, 12, 248–262. [Google Scholar] [CrossRef]
- Kessler, J.J.; Brons, J.; Braam, L.; Kuijk, M.V.; Pelders, P. Social & Economic Effects of Value Chains of Tropical Agro-Commodities & Sustainability Initiatives. Final Report; Aidenvironment-Planbureau voor de Leefomgeving (PBL): Amsterdam, The Netherlands, 2012; p. 192. [Google Scholar]
- FAO. Governance, Coordination and Distribution along Commodity Value Chains. In Proceedings of the FAO Commodties and Trade, Rome, Italy, 4–5 April 2006; Trade and Markets Division, Food and Agriculture Organization of the United Nations: Rome, Italy, 2007; p. 297. [Google Scholar]
- Squicciarini, M.P.; Swinnen, J. The Economics of Chocolate; Oxford University Press: Oxford, UK, 2016. [Google Scholar]
- Owusu-Amankwah, R. Certifications, Child Labour and Livelihood Strategies: An Analysis of Cocoa Production in Ghana; Wageningen University: Wageningen, The Netherlands, 2015. [Google Scholar]
- Wilson, S.; Vigneri, M.; Serra, R.; Cardenas, A.L. Researching the Impact of Increased Cocoa Yields on the Labour Market and Child Labour Risk in Ghana and Côte d’Ivoire; International Cocoa Initiative: Châtelaine, Switzerland, 2016. [Google Scholar]
- Ruf, F.; Schroth, G. Chocolate Forests and Monocultures: A Historical Review of Cocoa Growing and Its Conflicting Role in Tropical Deforestation and Forest Conservation; Schroth, G., Gustavo, A., Fonseca, B., Harvey, C.A., Gascon, C., Vasconcelos, H.L., Izac, A.-N., Eds.; Island Press: Washington, DC, USA, 2004; pp. 107–134. [Google Scholar]
- Matissek, R.; Reinecke, J.; Von Hagen, O.; Manning, S. Sustainability in the Cocoa Sector-Review, Challenges and Approaches. Available online: https://www.researchgate.net/profile/Stephan_Manning/publication/255726498_Sustainability_in_the_Cocoa_Sector_-_Review_Challenges_and_Approaches/links/004635355e173d3e55000000/Sustainability-in-the-Cocoa-Sector-Review-Challenges-and-Approaches.pdf (accessed on 4 November 2018).
- Nkamleu, G.B.; Nyemeck, J.; Gockowski, J. Technology Gap and Efficiency in Cocoa Production in West and Central Africa: Implications for Cocoa Sector Development; African Development Bank: Abidjan, Côte d’Ivoire, 2010. [Google Scholar]
- Fountain, A.C.; HUTZ-Adams, F. Cococa Barometer. VOICE Network, FNV Mondiaal, Südwind, HIVOS, Solidaridad, The Netherlands. 2015, p. 48. Available online: http://www.cocoabarometer.org/Cocoa_Barometer/Download_files/Cocoa%20Barometer%202015%20.pdf (accessed on 4 November 2018).
- Ruf, F.; Siswoputranto, P. Cocoa Cycles: The Economics of Cocoa Supply; Woodhead Publishing: Cambridge, UK, 1995. [Google Scholar]
- Umaharan, P. Achieving Sustainable Cultivation of Cocoa; Burleigh Dodds Science Publishing: Cambridge, UK, 2018. [Google Scholar]
- ICCO. World cocoa bean production, grindings and stocks. ICCO Q. Bull. Cocoa Stat. 2016, XLII. Available online: https://www.icco.org/about-us/icco-news/317-may-2016-quarterly-bulletin-of-cocoa-statistics.html (accessed on 4 November 2018).
- Bymolt, R.; Laven, A.; Tyzler, M. Demystifying the Cocoa Sector in Ghana and Côte d’Ivoire; The Royal Tropical Institute (KIT): Amsterdam, The Netherlands, 2018. [Google Scholar]
- Abbott, P.; Wilcox, M.; Muir, W.A. Corporate Social Responsibility in International Cocoa Trade; Purdue University: West Lafayette, IN, USA, 2005. [Google Scholar]
- Wilcox, M.D.; Abbott, P.C. Market Power and Structural Adjustment: The Case of West African Cocoa Market Liberalization. In Proceedings of the American Agricultural Economics Association Annual Meeting, Denver, CO, USA, 1–4 August 2004. [Google Scholar]
- Eberhard Krain, E.M.; Konan, E.; Servat, E. Trade and Pro-Poor Growth: Introducing Rainforest Alliance Certification to Cocoa Production in Côte d’Ivoire; Deutsche Gesellschaft für Internationale Zusammenarbeit (GIZ) GmbH: Eschborn, Germany, 2011. [Google Scholar]
- Vellema, S.; Laven, A. Chain governance, sector policies and economic sustainability in cocoa: How to bring the state back in? In Proceedings of the First Conference on Economics and Politics of Chocolate, Leuven, Belgium, 16–19 September 2012. [Google Scholar]
- Vellema, S.; Admiraal, L.; Valk, O.V.D. Quality Control in Cross-Border Agro-Based Supply Chains; Modes of Regulation in Coffee, Cocoa, Bananas, Palm Oil, Timber and Aquaculture; Agricultural Economics Research Institute (LEI): The Hague, The Netherlands, 2006; p. 37. [Google Scholar]
- Jean-François, B.; Bonjean, C.A. Chocolate Price Fluctuations May Cause Depression: An Analysis of Price Pass-through in the Cocoa Chain. Available online: https://halshs.archives-ouvertes.fr/halshs-01074157 (accessed on 4 November 2018).
- Oomes, N.; Tieben, B.; Laven, A.; Ammerlaan, T.; Appelman, R.; Biesenbeek, C.; Buunk, E. Market Concentration and Price Formation in the Global Cocoa Value Chain; SEO Amsterdam Economics: Amsterdam, The Netherlands, 2016. [Google Scholar]
- Fountain, A.; Huetz-Adams, F. Cocoa Barometer 2018; Voice Network, HIVOS: Amsterdam, The Netherlands, 2018. [Google Scholar]
- ICCO. The World Cocoa Economy: Past and Present; ICCO: London, UK, 2012; p. 43. [Google Scholar]
- Naprta, M. Discussing chocolate market trends. Agro Food Ind. Hi-Tech 2015, 26, 24–27. [Google Scholar]
- Ingram, V.; Waarts, Y.; van Rijn, F. Cocoa sustainability initiatives: The impacts of cocoa sustainability initiatives in West Africa. In Achieving Sustainable Cultivation of Cocoa; Umaharan, P., Ed.; Burleigh Dodds: Cambridge, UK, 2018; Volume 5. [Google Scholar]
- Salmon, G. Round Table on Sustainable Development. Voluntary Sustainability Standards and Labels (VSSLs): The Case for Fostering Them; Organisation for Economic Co-operation and Development: Paris, France, 2002; p. 14. [Google Scholar]
- McWilliams, A.; Siegel, D. Corporate social responsibility: A theory of the firm perspective. Acad. Manag. Rev. 2001, 26, 117–127. [Google Scholar] [CrossRef]
- International Trade Centre (ITC). The State of Sustainable Markets: Statistics and Emerging Trends 2015; ITC: Geneva, Switzerland, 2015; p. xviii. 148p.
- UTZ. 10 Years in Coffee, Cocoa and Tea. From Good to Better. Utz Certified Annual Report 2012; UTZ: Amsterdam, The Netherlands, 2013. [Google Scholar]
- ICCO. Production of cocoa beans. ICCO Q. Bull. Cocoa Stat. 2017, XLIII. Available online: https://www.icco.org/about-us/icco-news/380-quarterly-bulletin-of-cocoa-statistics-november-2017.html (accessed on 4 November 2018).
- UTZ. UTZ Cocoa Statistics Report Cocoa 2017. Available online: https://UTZ.org/?attachment_id=13234 (accessed on 30 April 2018).
- Blackman, A.; Rivera, J. The Evidence Base for Environmental and Socioeconomic Impacts of ‘Sustainable’Certification. SSRN 1579083. Available online: https://www.researchgate.net/publication/46456069_The_Evidence_Base_for_Environmental_and_Socioeconomic_Impacts_of_Sustainable_Certification (accessed on 4 November 2018).
- Potts, J.; Lynch, M.; Wilkings, A.; Huppe, G.; Cunningham, M.; Voora, V. The State of Sustainability Initiatives Review 2014: Standards and the Green Economy. Available online: https://www.iisd.org/pdf/2014/ssi_2014.pdf (accessed on 4 November 2018).
- Oya, C.; Schaefer, F.; Skalidou, D.; McCosker, C.; Langer, L. Effects of Certification Schemes for Agricultural Production on Socio-Economic Outcomes in Low- and Middle-Income Countries A Systematic Review. Available online: http://www.3ieimpact.org/media/filer_public/2017/03/15/sr34-certification-schemes-agricultural-production_yNjL1OW.pdf (accessed on 4 November 2018).
- Läderach, P.; Martinez-Valle, A.; Schroth, G.; Castro, N. Predicting the future climatic suitability for cocoa farming of the world’s leading producer countries, Ghana and Côte d’Ivoire. Clim. Chang. 2013, 119, 841–854. [Google Scholar] [CrossRef] [Green Version]
- Ton, G. The mixing of methods: A three-step process for improving rigour in impact evaluations. Evaluation 2012, 18, 5–25. [Google Scholar] [CrossRef] [Green Version]
- UTZ Certified. UTZ CERTIFIED Good Inside Code of Conduct for Cocoa Version 1.0—April 2009; UTZ Certified Foundation: Amsterdam, The Netherlands, 2009; p. 33. [Google Scholar]
- UTZ Certified. UTZ Certified Good Inside Code of Conduct for Cocoa. Annex: Guidance Document. Version 1.0—July 2009; UTZ Certified Foundation: Amsterdam, The Netherlands, 2009; p. 18. [Google Scholar]
- UTZ. UTZ Code of Conduct Cocoa Module 1.1-2015; UTZ: Amsterdam, The Netherlands, 2017. [Google Scholar]
- EMC. Ce Qu’il Faudrait Anticiper; EMC: Abidjan, Cote d’Ivoire, 2016. [Google Scholar]
- GEFAK. Study on the State of Farmer Cooperatives in the Cocoa Sector of Côte d‘Ivoire; GEFAK: Marburg, Germany, 2015; p. 90. [Google Scholar]
- Sonwa, D.J.; Weise, S.F.; Schroth, G.; Janssens, M.J.; Shapiro, H.-Y. Plant diversity management in cocoa agroforestry systems in West and Central Africa—Effects of markets and household needs. Agrofor. Syst. 2014, 88, 1021–1034. [Google Scholar] [CrossRef]
- Gockowski, J.; Sonwa, D. Cocoa Intensification Scenarios and Their Predicted Impact on CO2 Emissions, Biodiversity Conservation, and Rural Livelihoods in the Guinea Rain Forest of West Africa. Environ. Manag. 2011, 48, 307–321. [Google Scholar] [CrossRef] [PubMed]
- Läderach, P. Predicting the Impact of Climate Change on the Cocoa-Growing Regions in Ghana and Cote d’Ivoire Final Report; Climate Change Agriculture and Food Security, International Centre for Tropical Agriculture CIAT: Managua, Nicaragua, 2011; p. 35. [Google Scholar]
- Medina, V.; Laliberte, B. A Review of Research on the Effects of Drought and Temperature Stress and Increased CO2 on Theobroma cacao L., and the Role of Genetic Diversity to Address Climate Change; Bioversity International: Rome, Italy, 2017. [Google Scholar]
- Medina, V.; Meter, A.; Demers, N.; Laliberte, B. Review of the CFC/ICCO/Bioversity Project on Cacao Germplasm Evaluation (1998–2010); Bioversity International: Rome, Italy, 2017. [Google Scholar]
- Ingram, V.; van Rijn, F.; Waarts, Y.; Selten, M. Cocoa farmer models and practices in Ghana and Ivory Coast. In Proceedings of the World Cocoa Conference 2016, Bavaro, Dominican Republic, 22–25 May 2016. [Google Scholar]
- Ingram, V.; Waarts, Y.; Ge, L.; van Vugt, S.; Wegner, L.; Puister-Jansen, L.; Ruf, F.; Tanoh, R. Impact of UTZ Certification of Cocoa in Ivory Coast Assessment Framework and Baseline; LEI Wageningen UR: Den Haag, The Netherlands, 2014; p. 174. [Google Scholar]
- Ingram, V.; Waarts, Y.; Ge, L.; van Vugt, S.; Wegner, L.; Puister-Jansen, L.; Ruf, F.; Tanoh, R. Towards Sustainable Cocoa. Assessment of Cargill and Solidaridad Farmer Support Activities in Ivory Coast 2008–2012; LEI Wageningen UR: Den Haag, The Netherlands, 2014; p. 24. [Google Scholar]
- Hatløy, A.; Kebede, T.A.; Adeba, P.J.; Elvis, C. Towards Côte d’Ivoire Sustainable Cocoa Initiative (CISCI) Baseline Study Report; FAFO: Oslo, Norway, 2012. [Google Scholar]
- Molenaar, J.W.; Gorter, J.; Heilbron, L.; Simons, L.; Vorley, B.; Blackmore, E.; Dallinger, J. Sustainable Sector Transformation How to Drive Sustainability Performance in Smallholder-Dominated Agricultural Sectors? Aidenvironment, New Foresight, IIED, Commissioned by IFC: Amsterdam, The Netherlands, 2015. [Google Scholar]
- Nelson, V.; Phillips, D. Sector, landscape or rural transformations? Exploring the limits and potential of agricultural sustainability initiatives through a cocoa case study. Bus. Strategy Environ. 2018, 27, 252–262. [Google Scholar] [CrossRef]
- Ionova, A. Mars aims to tackle “broken” cocoa model with new sustainability scheme. Reuters, 19 September 2018. [Google Scholar]
- WCFO. The First Global Cocoa Farmers Conference Accra Declaration. In Proceedings of the First edition Global Cocoa Farmers Conference (GCFC1), Accra, Ghana, 27–28 September 2018. [Google Scholar]
- World Cocoa Foundation World Cocoa Foundation. Vision & Mission. Available online: https://www.worldcocoafoundation.org/about-wcf/vision-mission/ (accessed on 1 September 2018).
- Waarts, Y.; Ingram, V.; Linderhof, V.; Puister-Jansen, L.; Rijn, F.V.; Aryeetey, R. Impact of UTZ Certification on Cocoa Producers in Ghana, 2011 to 2014; LEI Wageningen UR: Den Haag, The Netherlands, 2015; p. 50. [Google Scholar]
- Waarts, Y.; Ge, L.; Ton, G.; Mheen, J.V.D. A Touch of Cocoa, Baseline Study of Six UTZ-Solidaridad Cocoa Projects in Ghana; LEI Wageningen UR: Wageningen, The Netherlands, 2013. [Google Scholar]
Figure 1.
Timeline of cocoa sustainability initiatives in West Africa.

Figure 2.
Growth of voluntary sustainability standards (VSS) certified cocoa production and sales globally, from 2008 to 2016. Source: [14,35].


Table 1.
Number of farmers interviewed.
| Sample 2012/2013 | Sample 2015/2017 | |||||
|---|---|---|---|---|---|---|
| Number of Cooperatives | Number of Farmers | Status in 2017 | Number of Cooperatives | Number of Farmers | ||
| Ivory Coast | UTZ in 2013 & 2017 | 91 | 788 | 606 | 37 | 339 |
| Non-UTZ 2013 & 2017 | 6 | 156 | 156 | 8 | 79 | |
| UTZ 2013, Non-UTZ 2017 | 166 | 5 | ||||
| Unobtainable | 16 | 237 | ||||
| Total | 97 | 944 | 944 | 45 | 426 | |
| Ghana | UTZ in 2012 & 2015 | 6 | 258 | 235 | 6 | 235 |
| Non-UTZ 2012 & 2015 | 3 | 127 | 117 | 3 | 117 | |
| UTZ 2012, Non-UTZ 2015 | 0 | |||||
| Unobtainable | 33 | |||||
| Total | 9 | 385 | 352 | 9 | 352 | |
| Total | 106 | 1329 | 1296 | 54 | 778 | |
Table 2.
Certified and non-certified farmers in the baseline.
| Ivory Coast | Ghana | ||||
|---|---|---|---|---|---|
| Variable | Non-Certified | UTZ Certified | Variable | Non-Certified | UTZ Certified |
| Female respondent | 4% | 3% | Female respondent * | 13% | 20% |
| Household size *** | 7 | 8 | Household size | 6 | 6 |
| Farm size ** (ha) | 4 | 5 | Farm size (ha) | 3.78 | 4.58 |
| Ownership * | 85% | 77% | Share of land owned | 59% | 51% |
| Oldest plot (years) | 23 | 22 | Year establishment farm | 1996 | 1994 |
| Farmer age | 52 | 50 | Farmer age | 50 | 49 |
| Agro-ecological Excellent (Zone 1) | 51% | 50% | Time to farm in minutes | 36 | 35 |
| Agro-ecological Good (Zone 2) ** | 49% | 36% | Number of farms ** | 59% | 71% |
| Agro-ecological Marginal (Zone 3) *** | 0% | 15% | Respondent household head | 94% | 93% |
| Share of cocoa income *** | 82% | 93% | Hiring labour | 80% | 81% |
| Share cocoa as total land area *** | 48% | 66% | Household member is purchasing clerk | 8% | 10% |
| Share of female adults | 30% | 30% | |||
| Education in years household head | 7.3 | 6.7 | |||
| Share hired labour *** | 9% | 4% | |||
Statistical significance: *** (α = 0.01), ** (α = 0.05), and * (α = 0.10).
Table 3.
Outcome areas and indicators.
| UTZ Outcome Area | Indicators at Farm Scale |
|---|---|
| Better incomes, better crops (Economic Indicators) | Production practices score 1 |
| Productivity per hectare | |
| Production costs per hectare | |
| Profit per hectare | |
| Total cocoa income | |
| Better lives (Social Indicators) | Social practices score 2 |
| Children working on hazardous farm activities | |
| Use of Personal Protective Equipment | |
| Better environment (Environmental Indicators) | Environmental practices score 3 |
| Use of compost | |
| Use of shade trees | |
| Use agrochemical and waste chemical management |
1 Good agricultural practices defined in UTZ Code of Conduct for Cocoa [41,42,43] and associated training in relation to plant nurseries, weeding, cocoa tree spacing, input use, frequency of input use, record keeping on input use, management of diseased pods, harvesting practices, use of shade trees, and distance between shade trees. 2 Practices defined in UTZ Code of Conduct for Cocoa [41,42,43] and associated training in relation to use of protective clothing, with two indicators on chemical waste management (related to safety and health) and on the use of child labour (nominal value 0 to 1). 3 Good agricultural practices defined in UTZ Code of Conduct for Cocoa [41,42,43] and associated training in relation to shade trees, distance between shade trees, with three indicators concerning treatment of chemical waste and soil quality.
Table 4.
Results Economic Indicators.
| Economic Indicators Equation (1) | UTZ | Non-Certified | Effect Equation (1) | Robust | Modalities | |||
|---|---|---|---|---|---|---|---|---|
| Baseline t = 0 | Endline t = 1 | Baseline t = 0 | Endline t = 1 | |||||
| Ghana | Production practices score | 0.45 | 0.56 | 0.39 | 0.49 | 0.009 | No effects found | |
| Productivity per/hectare | 282.5 | 311.2 | 262.5 | 321.2 | −47 | Yes | No effects found | |
| Production costs per/hectare | 127.3 | 385.7 | 163.8 | 542.8 | −104 | Yes | ↑ With trainings | |
| Profit per/hectare | 956.5 | 1274 | 822.3 | 1441 | −355 ** | Yes | No effects found | |
| Total cocoa net income | 3826 | 5094 | 3289 | 5765 | −1419 ** | No | No effects found | |
| Ivory Coast | Production practices score | 0.446 | 0.497 | 0.346 | 0.403 | −0.01 | Yes | Higher for group 4 |
| Productivity per/hectare | 520 | 500 | 256 | 411 | −179 *** | Yes | Higher for group 4 | |
| Production costs per/hectare | 22,720 | 31,125 | 29,467 | 33,966 | 3056.85 | Yes | No effects found | |
| Profit per/hectare | 377,238 | 527,857 | 160,907 | 425,113 | −116,515** | Yes | No effects found | |
| Total cocoa gross income | 1,692,480 | 2,575,645 | 747,808 | 1,767,034 | −128,710 | Yes | No effects found | |
Statistical significance: *** (α = 0.01) and ** (α = 0.05). The model includes the set of covariates as defined in Table 2. Results are robust when all 4 models, defined in Section 2.3 and Section 2.4, show similar results in terms of sign and significance.
Table 5.
Results Social Indicators.
| Social Indicators Equation (1) | UTZ | Non-Certified | Effect | Robust | Modalities | |||
|---|---|---|---|---|---|---|---|---|
| Baseline t = 0 | Endline t = 1 | Baseline t = 0 | Endline t = 1 | |||||
| Ghana | Social practices score | 0.33 | 0.44 | 0.25 | 0.39 | −0.023 | Yes | Higher for certified farmers |
| Days children <18 on hazardous activities | 0 | 0.12 | 0.66 | 1.36 | −0.25 | Yes | No effect | |
| Days children <14 on hazardous activities | n.a. | 0.17 | n.a. | 0.66 | n.a. | Yes | No effect | |
| Use of protective equipment | 0.34 | 0.57 | 0.44 | 0.63 | −0.05 | Yes | Higher for certified farmers | |
| Ivory Coast | Social practices score | 0.49 | 0.6 | 0.41 | 0.51 | −0.01 | Yes | No effect |
| Days children <18 on hazardous activities | 0.25 | 0.16 | 0.18 | 0.14 | −0.04 | Yes | No effect | |
| Use of protective equipment | 0.21 | 0.46 | 0.17 | 0.35 | 0.06 | Yes | No effect | |
No statistical significance was found at (α = 0.01), (α = 0.05) or (α = 0.10). The model includes the set of covariates as defined in Table 2. Results are robust when all 4 models, defined in Section 2.3 and Section 2.4, show similar results in terms of sign and significance.
Table 6.
Results Environmental Indicators.
| Environmental Indicators Equation (1) | UTZ | Non-Certified | Effect | Robust | Modalities | |||
|---|---|---|---|---|---|---|---|---|
| Baseline t = 0 | Endline t = 1 | Baseline t = 0 | Endline t = 1 | |||||
| Ghana | Environmental practices score | 0.17 | 0.24 | 0.13 | 0.22 | −0.039 | Yes | No effects found |
| Shade trees | 0.18 | 0.33 | 0.15 | 0.30 | −0.01 | Yes | No effects found | |
| Waste management | 0.21 | 0.33 | 0.15 | 0.30 | −0.06 | Yes | Lower increase for farmers receiving more training | |
| Ivory Coast | Environmental practices score | 0.49 | 0.53 | 0.46 | 0.48 | 0.02 | Yes | No effect |
| Compost | 0.14 | 0.21 | 0.04 | 0.18 | −0.08 | Yes | No effect | |
| Shade trees | 0.28 | 0.27 | 0.19 | 0.14 | 0.05 | Yes | No effect | |
| Waste management | 0.70 | 0.75 | 0.55 | 0.70 | −0.11 *** | Yes | No effect | |
Statistical significance: *** (α = 0.01). The model includes the set of covariates as defined in Table 2. Results are robust when all 4 models, defined in Section 2.3 and Section 2.4, show similar results in terms of sign and significance.
© 2018 by the authors. Licensee MDPI, Basel, Switzerland. This article is an open access article distributed under the terms and conditions of the Creative Commons Attribution (CC BY) license (http://creativecommons.org/licenses/by/4.0/).
Share and Cite
MDPI and ACS Style
Ingram, V.; Van Rijn, F.; Waarts, Y.; Gilhuis, H. The Impacts of Cocoa Sustainability Initiatives in West Africa. Sustainability 2018, 10, 4249. https://doi.org/10.3390/su10114249
AMA Style
Ingram V, Van Rijn F, Waarts Y, Gilhuis H. The Impacts of Cocoa Sustainability Initiatives in West Africa. Sustainability. 2018; 10(11):4249. https://doi.org/10.3390/su10114249
Chicago/Turabian StyleIngram, Verina, Fedes Van Rijn, Yuca Waarts, and Henk Gilhuis. 2018. "The Impacts of Cocoa Sustainability Initiatives in West Africa" Sustainability 10, no. 11: 4249. https://doi.org/10.3390/su10114249
Note that from the first issue of 2016, this journal uses article numbers instead of page numbers. See further details here.