Climate Change Sensitivity of Multi-Species Afforestation in Semi-Arid Benin
by
 , and
, and
Florent Noulèkoun
1, 
Asia Khamzina
2,*,
Jesse B. Naab
3,
Ni’matul Khasanah
4, 
Meine Van Noordwijk
4,5 and
and
John P. A. Lamers
6 1
Center for Development Research (ZEF), Genscherallee 3, 53113 Bonn, Germany
2
Division of Environmental Science and Ecological Engineering, Korea University, 145 Anam-Ro, Seongbuk-Gu, Seoul 02841, Korea
3
WASCAL Competence Center, 06 P.O. Box 9507 Ouagadougou, Burkina Faso
4
World Agroforestry Centre (ICRAF), Southeast Asia Regional Programme, PO Box 161, Bogor 16001, Indonesia
5
Plant Production Systems Group, Wageningen University, P.O. Box 430, 6700 AK Wageningen, The Netherlands
6
Center for Development Research (ZEF), Genscherallee 3, 53113 Bonn, Germany
*
Author to whom correspondence should be addressed.
Sustainability 2018, 10(6), 1931; https://doi.org/10.3390/su10061931
Submission received: 6 May 2018
/
Revised: 31 May 2018
/
Accepted: 7 June 2018
/
Published: 8 June 2018
(This article belongs to the Special Issue Forests as a Key Climate Solution)
Abstract
:The early growth stage is critical in the response of trees to climate change and variability. It is not clear, however, what climate metrics are best to define the early-growth sensitivity in assessing adaptation strategies of young forests to climate change. Using a combination of field experiments and modelling, we assessed the climate sensitivity of two promising afforestation species, Jatropha curcas L. and Moringa oleifera Lam., by analyzing their predicted climate–growth relationships in the initial two years after planting on degraded cropland in the semi-arid zone of Benin. The process-based WaNuLCAS model (version 4.3, World Agroforestry Centre, Bogor, Indonesia) was used to simulate aboveground biomass growth for each year in the climate record (1981–2016), either as the first or as the second year of tree growth. Linear mixed models related the annual biomass growth to climate indicators, and climate sensitivity indices quantified climate–growth relationships. In the first year, the length of dry spells had the strongest effect on tree growth. In the following year, the annual water deficit and length of dry season became the strongest predictors. Simulated rooting depths greater than those observed in the experiments enhanced biomass growth under extreme dry conditions and reduced sapling sensitivity to drought. Projected increases in aridity implied significant growth reduction, but a multi-species approach to afforestation using species that are able to develop deep-penetrating roots should increase the resilience of young forests to climate change. The results illustrate that process-based modelling, combined with field experiments, can be effective in assessing the climate–growth relationships of tree species.
1. Introduction
There is an increasing recognition of the roles of forests and trees in mitigation and adaptation strategies to global climate change [1,2]. Tree planting can modify local climate through impacts on temperature, wind speed, and humidity; it can also influence the landscape–scale water balance, cloud cover and albedo, and contribute to global carbon sequestration [3,4,5]. In (sub-) tropical developing countries, re– and afforestation have been included in the portfolio of mitigation efforts as a cost-efficient strategy to reverse the degradation of forests and to increase their atmospheric carbon uptake [1,2,6,7]. Although trees are central to many climate change adaptation and mitigation strategies, they are vulnerable (particularly in their early growth), to variation in solar radiation, rainfall, and temperature as determinants of potential evapotranspiration (ET0). Changes in these climatic variables, particularly temperature increases and precipitation shortages leading to higher frequencies of extreme weather events (i.e., severe drought and intense rainfall), are expected to affect tree growth and challenge the sustainable management of forests and tree plantations [8,9,10].
Tree growth sensitivity to drought may be substantial in West African semi-arid zones, where water availability is one of the most limiting factors of plant growth, e.g., [11], and where extreme drought events are projected to become more frequent [12,13,14]. In this region, extreme drought events are associated with extended dry spells, low air humidity, high atmospheric evaporative demand, and high air temperatures [15], potentially increasing water stress in trees [13]. Droughts and dry spells are a major threat to the establishment and early growth of both tropical and temperate tree species [16,17,18], suggesting the need to assess the effects of climate variability on their growth. However, studies quantifying the relationships between these climatic factors and tree growth are lacking for tree plantations in the semi-arid tropics. This information is urgently needed to explore species’ responses to past and current climate and evaluate the effects of climate change on tree growth [19].
If drought occurrences are exacerbated by global warming, it stands to reason that the sustainability of forests and plantations will largely depend on the physiological adaptations and changes in silvicultural management [18,20]. For example, Abdulai et al. [14] revealed drought vulnerability in a cocoa-based system in the forest–savanna transition zones of West Africa, despite the availability of subsoil water below a depth of 75 cm. This observation suggests that drought vulnerability may be related to trees’ ability to develop sufficiently deep root systems [21]. Hartl-Meier et al. [22] found that among three tree species growing under similar temperate climate conditions, those with deep root systems benefited from the access to deep soil water, as reflected in their higher photosynthetic activity and continued biomass production during severe drought conditions. Therefore, the consideration of root systems in the analysis of climate–growth relationships may give new insights on species’ responses to extreme climate events. Another plant strategy to avoid mortality under drought conditions is to shed leaves and reduce transpiration losses; such drought avoidance is likely to reduce the rate of photosynthesis and thus mean growth rates, but also reduce vulnerability [23].
Assessing the sensitivity and/or response of (early) tree growth to climate change requires the identification of the climate variables that most strongly influence tree growth or have the best predictive power in evaluating the early growth risks, e.g., Teets et al. [24]. However, experiments carried out in any given year to quantify climate–growth relationships of young trees may exhibit a sample of bad luck, lucky exceptions or be representative of ‘normal’ conditions at the test location, because experiments capture one (or a few) of the many possible weather (e.g., rainfall and temperature) sequences for this location. Early growth sensitivity of trees to predicted climate change cannot thus be directly derived from existing weather statistics because it is uncertain how tree transpiration, soil evaporation and temporal rainfall patterns interact, e.g., Raz-Yaseef et al. [25]. In this regard, we argue that well-calibrated tree–soil interaction models, simulating sapling growth responses for at least 30 years of weather data can help in (a) identifying the best predictors among a wide set of metrics that can be objectively derived from existing weather records; (b) evaluating where the years with experimental data are positioned within current climate variability according to the metrics with the highest predictive power identified in (a); and (c) using the results of (a) and (b) to assess the probability of success for given species at a given location under various location-specific climate change scenarios. Our study may be the first to test explicitly this generic approach to assess climate change risks for newly established dryland afforestation sites. The datasets stem from a site in a semi-arid zone of West Africa, where tree-based land restoration is high on the agenda and existing information is not sufficient to assess the robustness of afforestation option for a range of tree species [18,20,26].
Dendrochronology has been successfully used to analyze temporal and spatial climate–growth relationships for tree and shrub species in tropical and temperate forests [9,23,27,28]. However, dendrochronological applications may be inappropriate for young trees and compromised by problematic anatomical features such as missing, vague, discontinuous and false rings common in tropical species [29,30], thereby also restricting the use of biomass increments derived from tree-ring series [31,32]. An alternative approach to assessing the climate–growth relationships of saplings may be the use of process-based models in combination with field experiments. When supported by reliable soil–plant–climate databases and empirically derived relationships between environmental and plant eco-physiological parameters [33,34], process-based models can be used to investigate forest responses to climatic change and silvicultural management [35,36], as well as predict tree growth and productivity at both the plant and stand level. There have been few models capable of accurately simulating processes in tree-based agroecosystems.
The process-based Water, Nutrient and Light Capture in Agroforestry Systems (WaNuLCAS) model [35] has had various applications to improve the understanding of complex ecological processes in tree-based farming systems [35,37,38]. It has also been tested for its performance to simulate crop (e.g., Pennisetum glaucum L. and Sorghum bicolor L.) and tree (e.g., Parkia biglobosa Jacq. and Vitellaria paradoxa C.F. Gaertn) growth in agroforestry parklands in West Africa [39,40,41]. The aim of our research was to assess the climate sensitivity of two afforestation species—Jatropha curcas L. and Moringa oleifera Lam.—in the early stages of their development (i.e., the first two years of growth), decisive for the future growth [42] and also when plants are most sensitive to changes in water availability [43,44,45]. The two species have been subjects of silvicultural trials on degraded cropland in northern Benin [18,20,26]. The specific objectives were to (i) compare different indicators calculated from climate records to identify those with the greatest predictive power for the first two years of tree growth; (ii) quantify the climate–growth relationships of tree growth over the first two years, and (iii) test possible adaptation strategies to reduce the sensitivity of saplings to extreme climate events. Furthermore, we assessed the relevance of the empirical climate data vis-à-vis the long-term climatic variability in the study area based on the most influential climate indicators. We hypothesized that (i) there will be significant differences between the species’ growth responses to climate indicators, particularly to drought-related indicators; (ii) drought sensitivity of sapling growth decreases over time, depending on the establishment of roots; and (iii) deepening of the rooting system may aid the adaptation of saplings to extreme drought conditions.
2. Materials and Methods
2.1. Study Area
Data for parametrization, validation, and simulations stemmed from a field experiment conducted during 2014‒2015 at Pouri village (10°54′8.4″ N, 1°4′47.4″ E), Atacora region, northern Benin [18,20]. The region has been significantly affected by land degradation driven by deforestation and soil nutrient mining, which threatens the sustainability of forest and farming systems [18,46,47]. To combat land degradation, national and local projects to intensify forest cover, reclaim degraded lands and mitigate the effects of climate change (e.g., the project “10 Million Trees, 10 Million Souls”; http://news.acotonou.com/h/61311.html) through the planation of commercially important food (e.g., M. oleifera) and biofuel (e.g., J. curcas) tree crops have been carried out in the region [26,48].
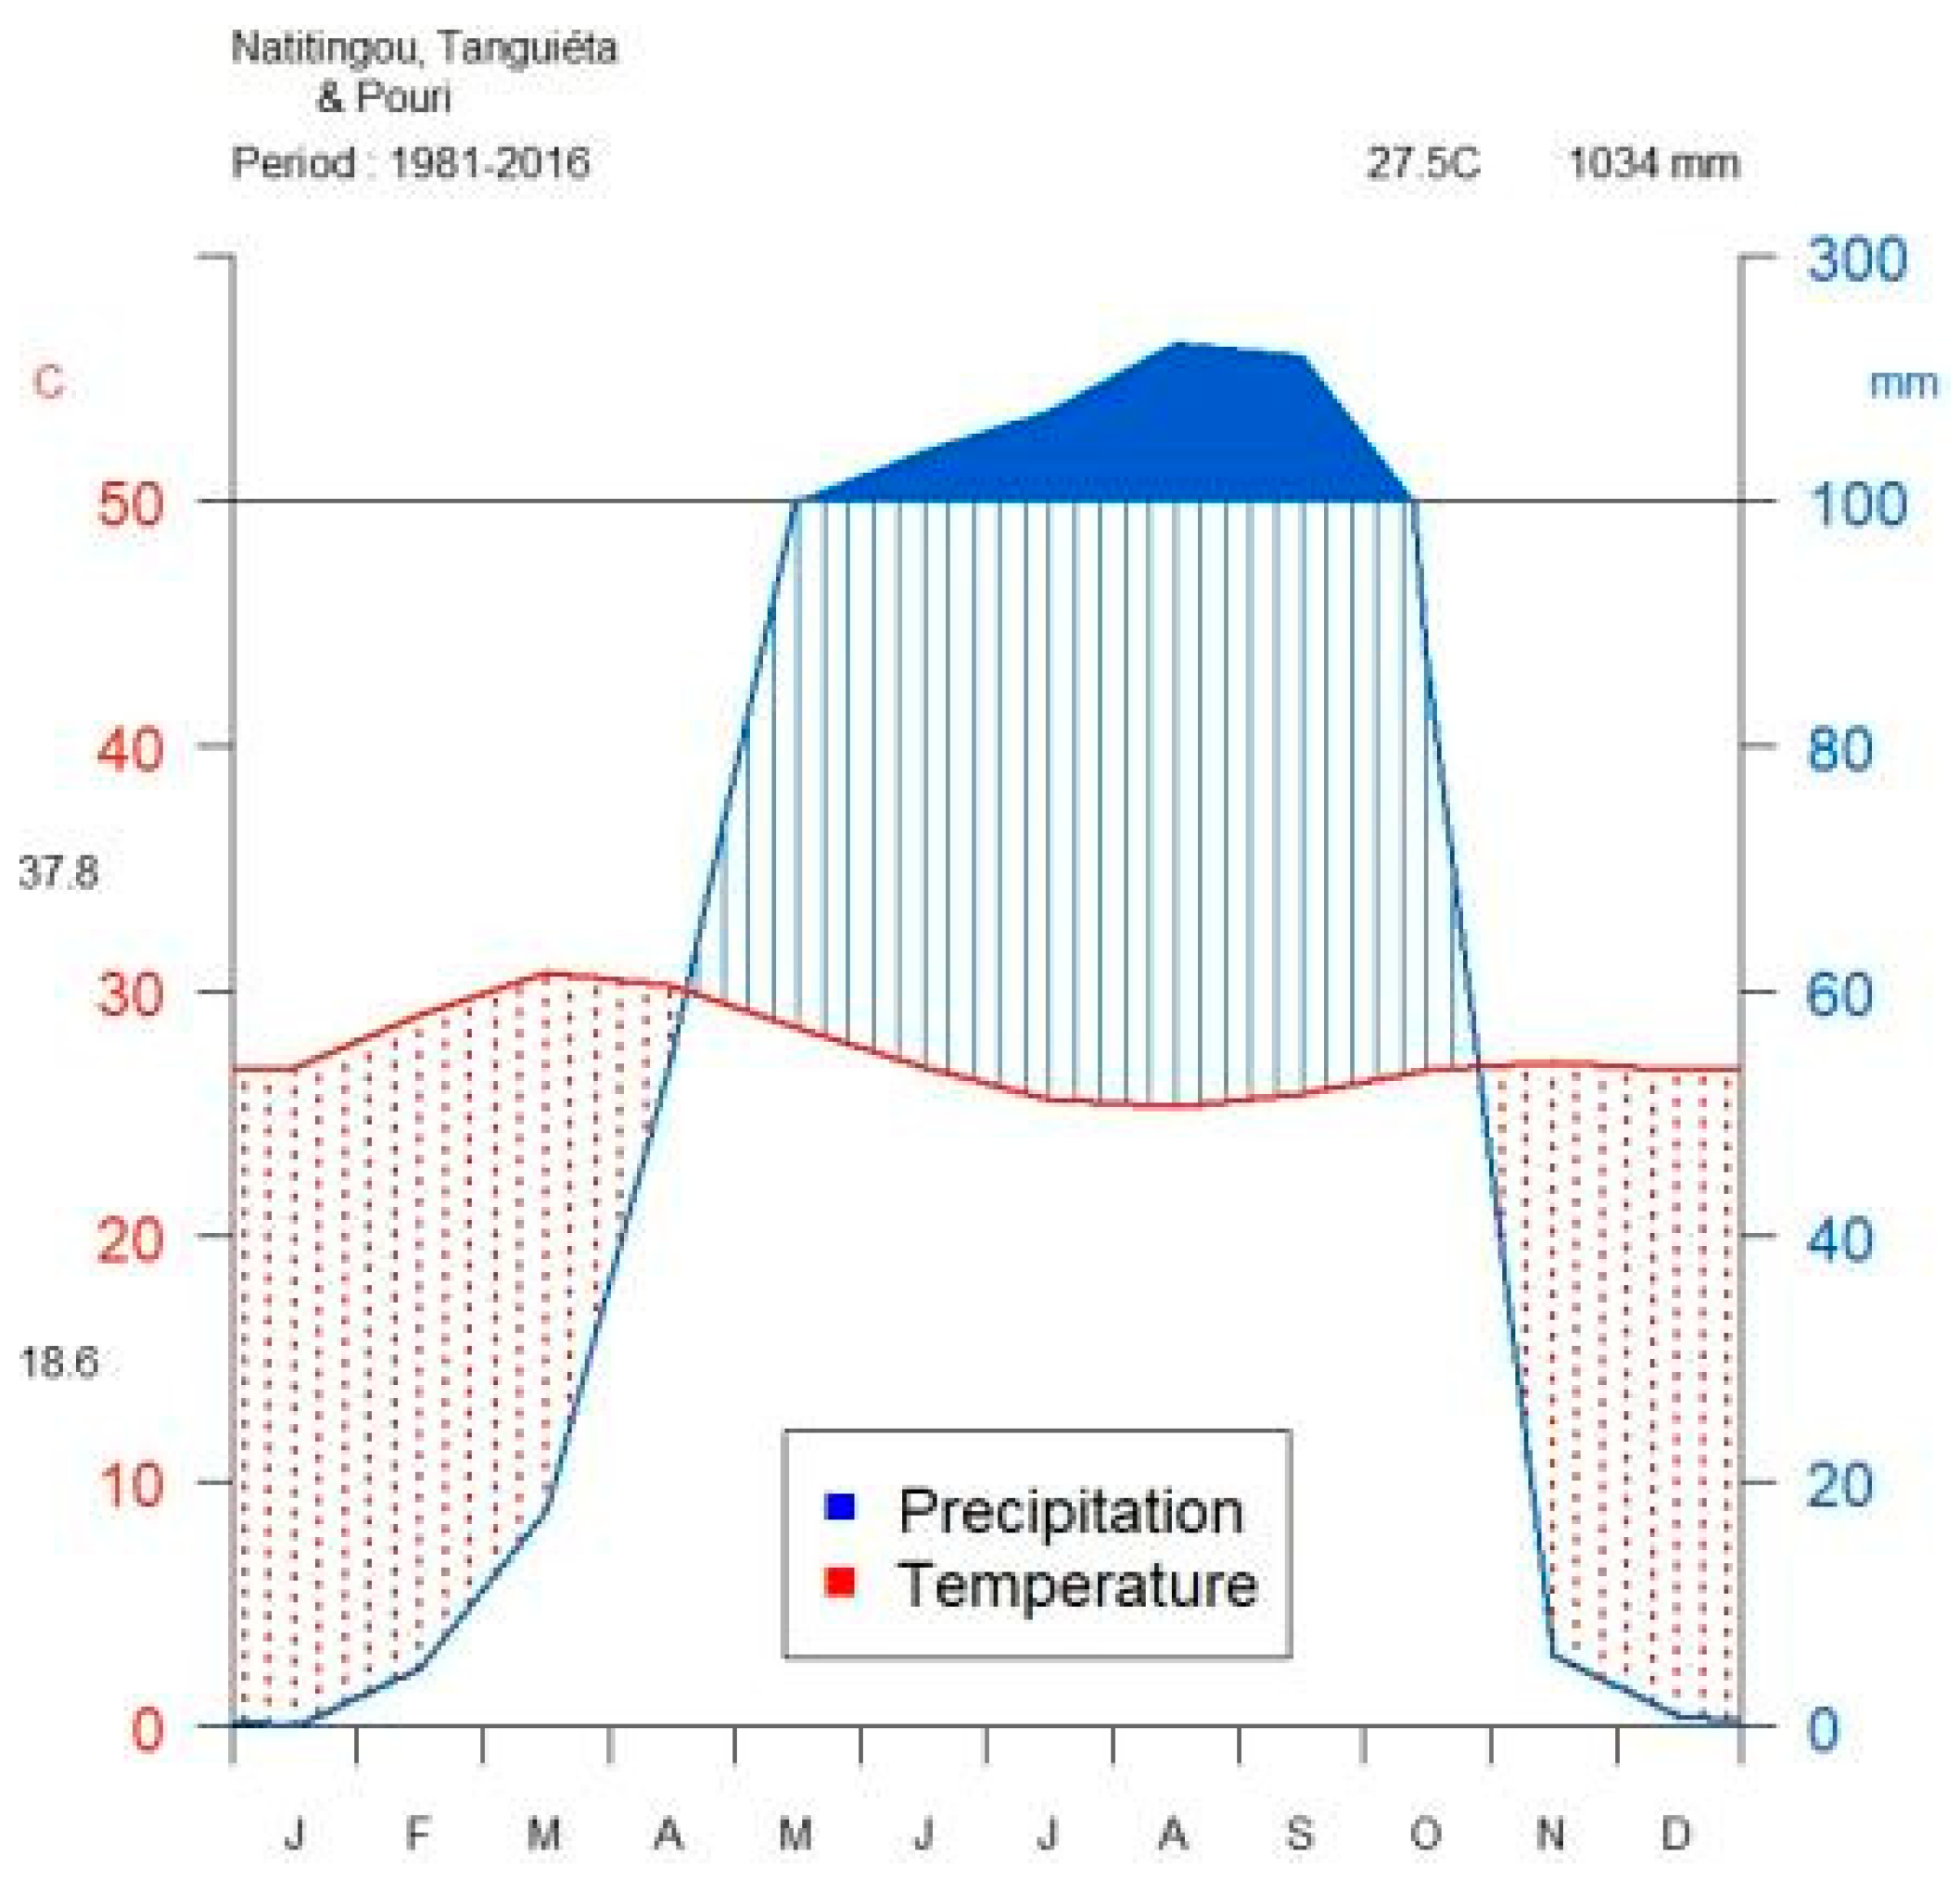
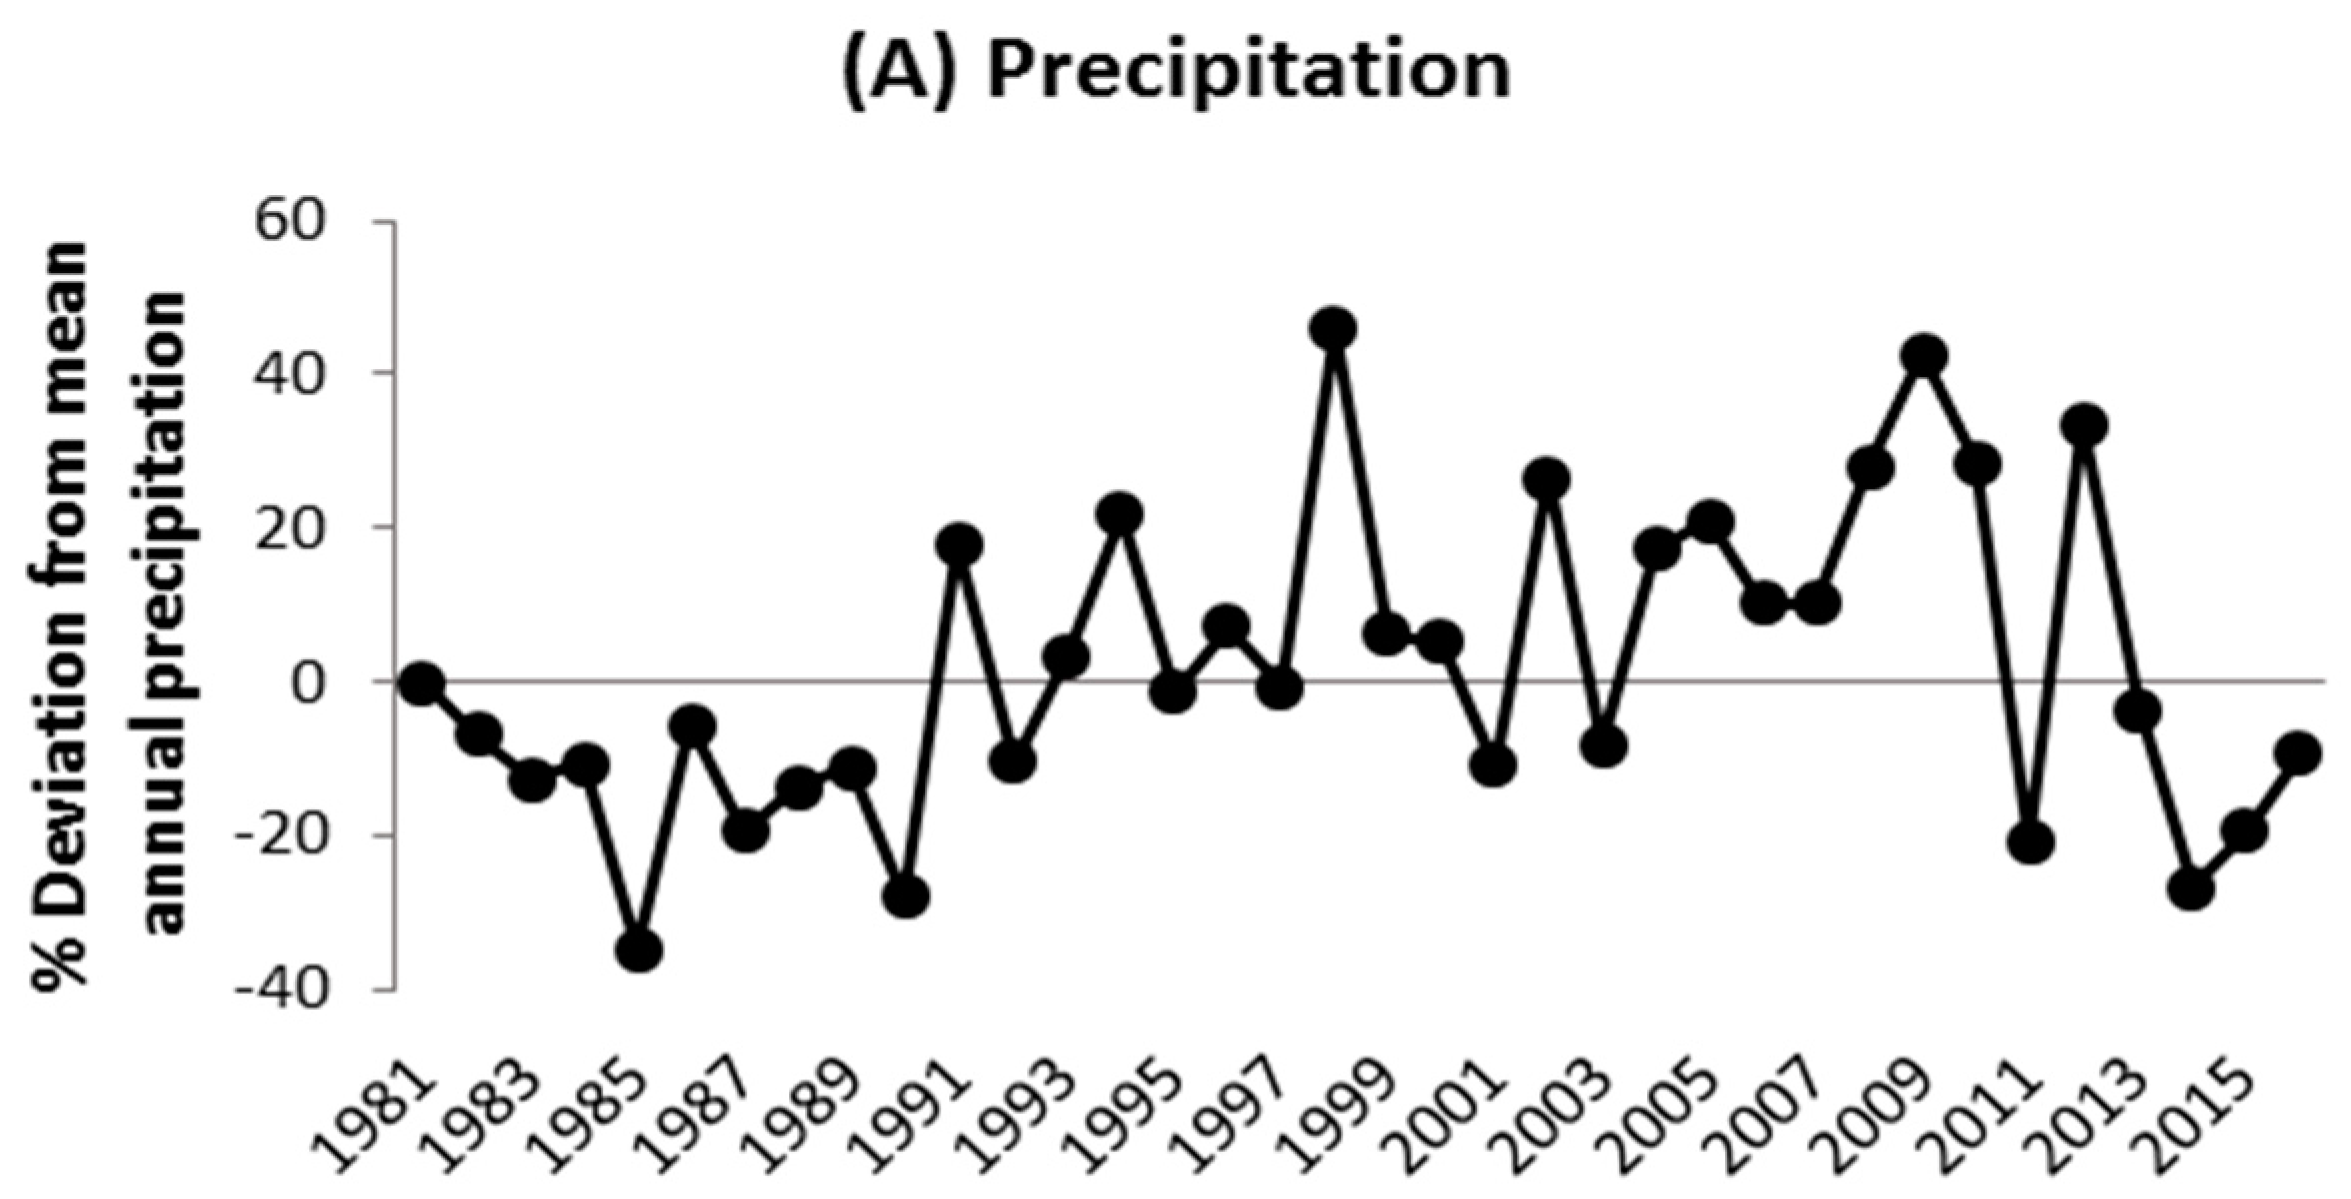
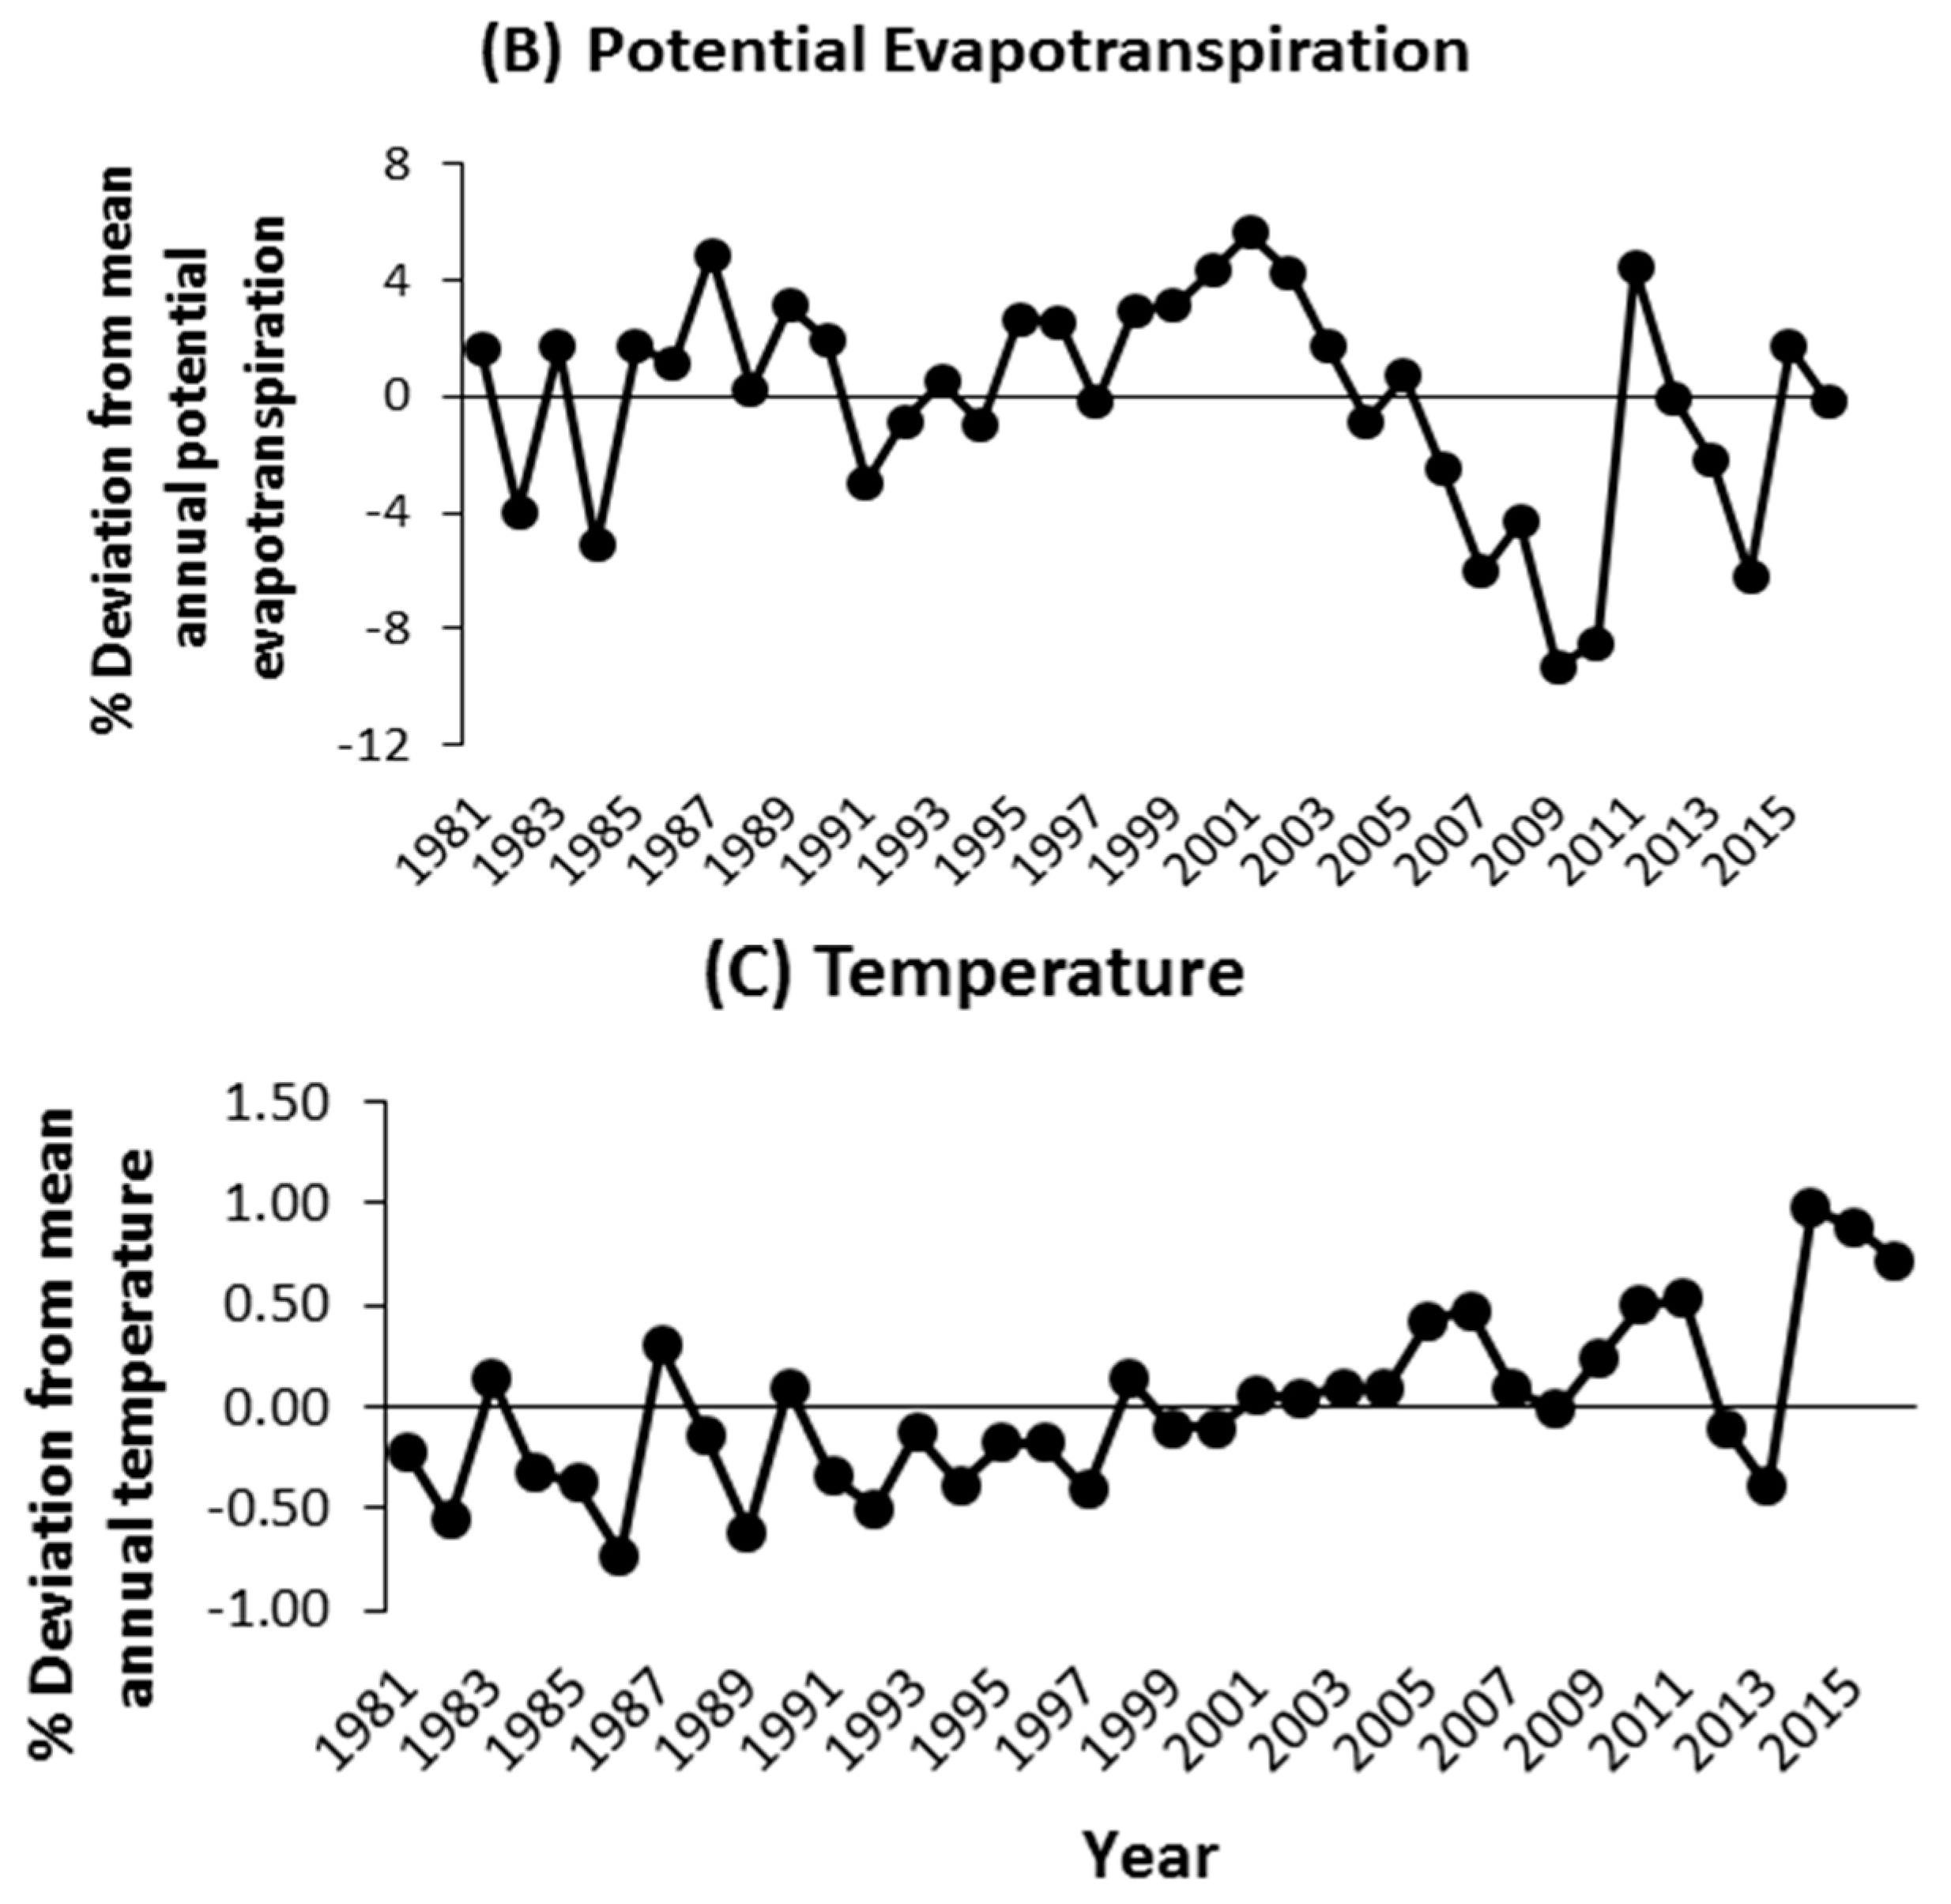
The climate is semi-arid, characterized by two contrasting seasons, with one rainy season from April to October and a dry season for the rest of the year (Figure 1). The annual rainfall totaled 757 mm in 2014 and 833 mm in 2015, albeit both below the long-term (1981–2016) average of 1034 mm. The mean annual air temperature was 29 °C in 2014 and 28 °C in 2015. The area received an average solar radiation of 0.2 kW m−1 (≈914 μmol m−2 s−1 of photosynthetically active radiation) in 2014 and 2015. Historical patterns of change in precipitation, evapotranspiration, and air temperature showed a high inter-annual rainfall variability (676 < annual rainfall < 1509 mm; CV = 20%), along with extreme dry (1985) and wet (1998) years, while inter-annual variations in evapotranspiration (CV = 4%) and temperature (2%) were smaller compared to that of annual precipitation (Appendix A, Figure A1).
2.2. Experimental Design and Woody Species
The experiment compared the growth performance of saplings subjected to four management options, along an increasing gradient of resource availability: control (C; with neither irrigation nor fertilization), supplemental irrigation (I), fertilization (manure, F), and irrigation plus fertilization (IF). Irrigation was applied during the dry season only (November 2014–May 2015) at a rate of 0.5 L of water per sapling per day to satisfy 30% of the evaporative demand [18]. The saplings each received 72.5 mm of irrigation water and an additional 33 mm of rainfall during the dry season. Manure was applied in both rainy seasons, i.e., at 2.5 and 11 months after planting (MaP), at the amount of 1 kg per sapling (ca. 7.7 kg m−2). The manure consisted of composted cow and pig dung, and contained an average of 18.7% carbon (C), 1.2% nitrogen (N), and 0.8% phosphorus (P). No pesticide or fungicide was applied. Weed growth was controlled by frequent manual weeding.
Seeds of two multipurpose tree species, Jatropha curcas L. (physic nut, Euphorbiaceae) and Moringa oleifera Lam. (drumstick tree, Moringaceae), were germinated in a local nursery. Seedlings were planted in monospecific plots at the experimental site in July 2014 after 2.5–4 months, and were monitored over 15 months [18,20,26]. These local species were selected based on the fast growth rate of their shoots and roots in response to water and nutrient supply, as well as their socio-economic importance and increasing recent efforts to expand their plantation acreage in West Africa [18,26]. Each plot contained 48 seedlings with a 2 m × 1 m spacing, resulting in an initial stand density of 5000 trees ha−1, which was used in the simulations.
2.3. Data Collection
Tree morphological properties and biomass were measured at the beginning and end of the 2014 and 2015 rainy seasons (i.e., 5, 11, and 15 MaP) on two to six saplings randomly selected per experimental plot [20,26]. After measuring the height (H, m) and stem diameter (D, cm), the selected trees were felled for total biomass determination, and that of the different tree fractions. The aboveground part was separated into leaves, branch, stem, and reproductive fractions. Roots were manually excavated, sectioned into coarse (ø > 2 mm) and fine (ø < 2 mm) fractions, and gently washed in a sieve to remove the soil. Subsamples of the harvested fractions were oven-dried at 75 °C until they reached a constant weight, and their dry mass was determined [20,26].
2.4. Modelling Analysis
2.4.1. Description of WaNuLCAS
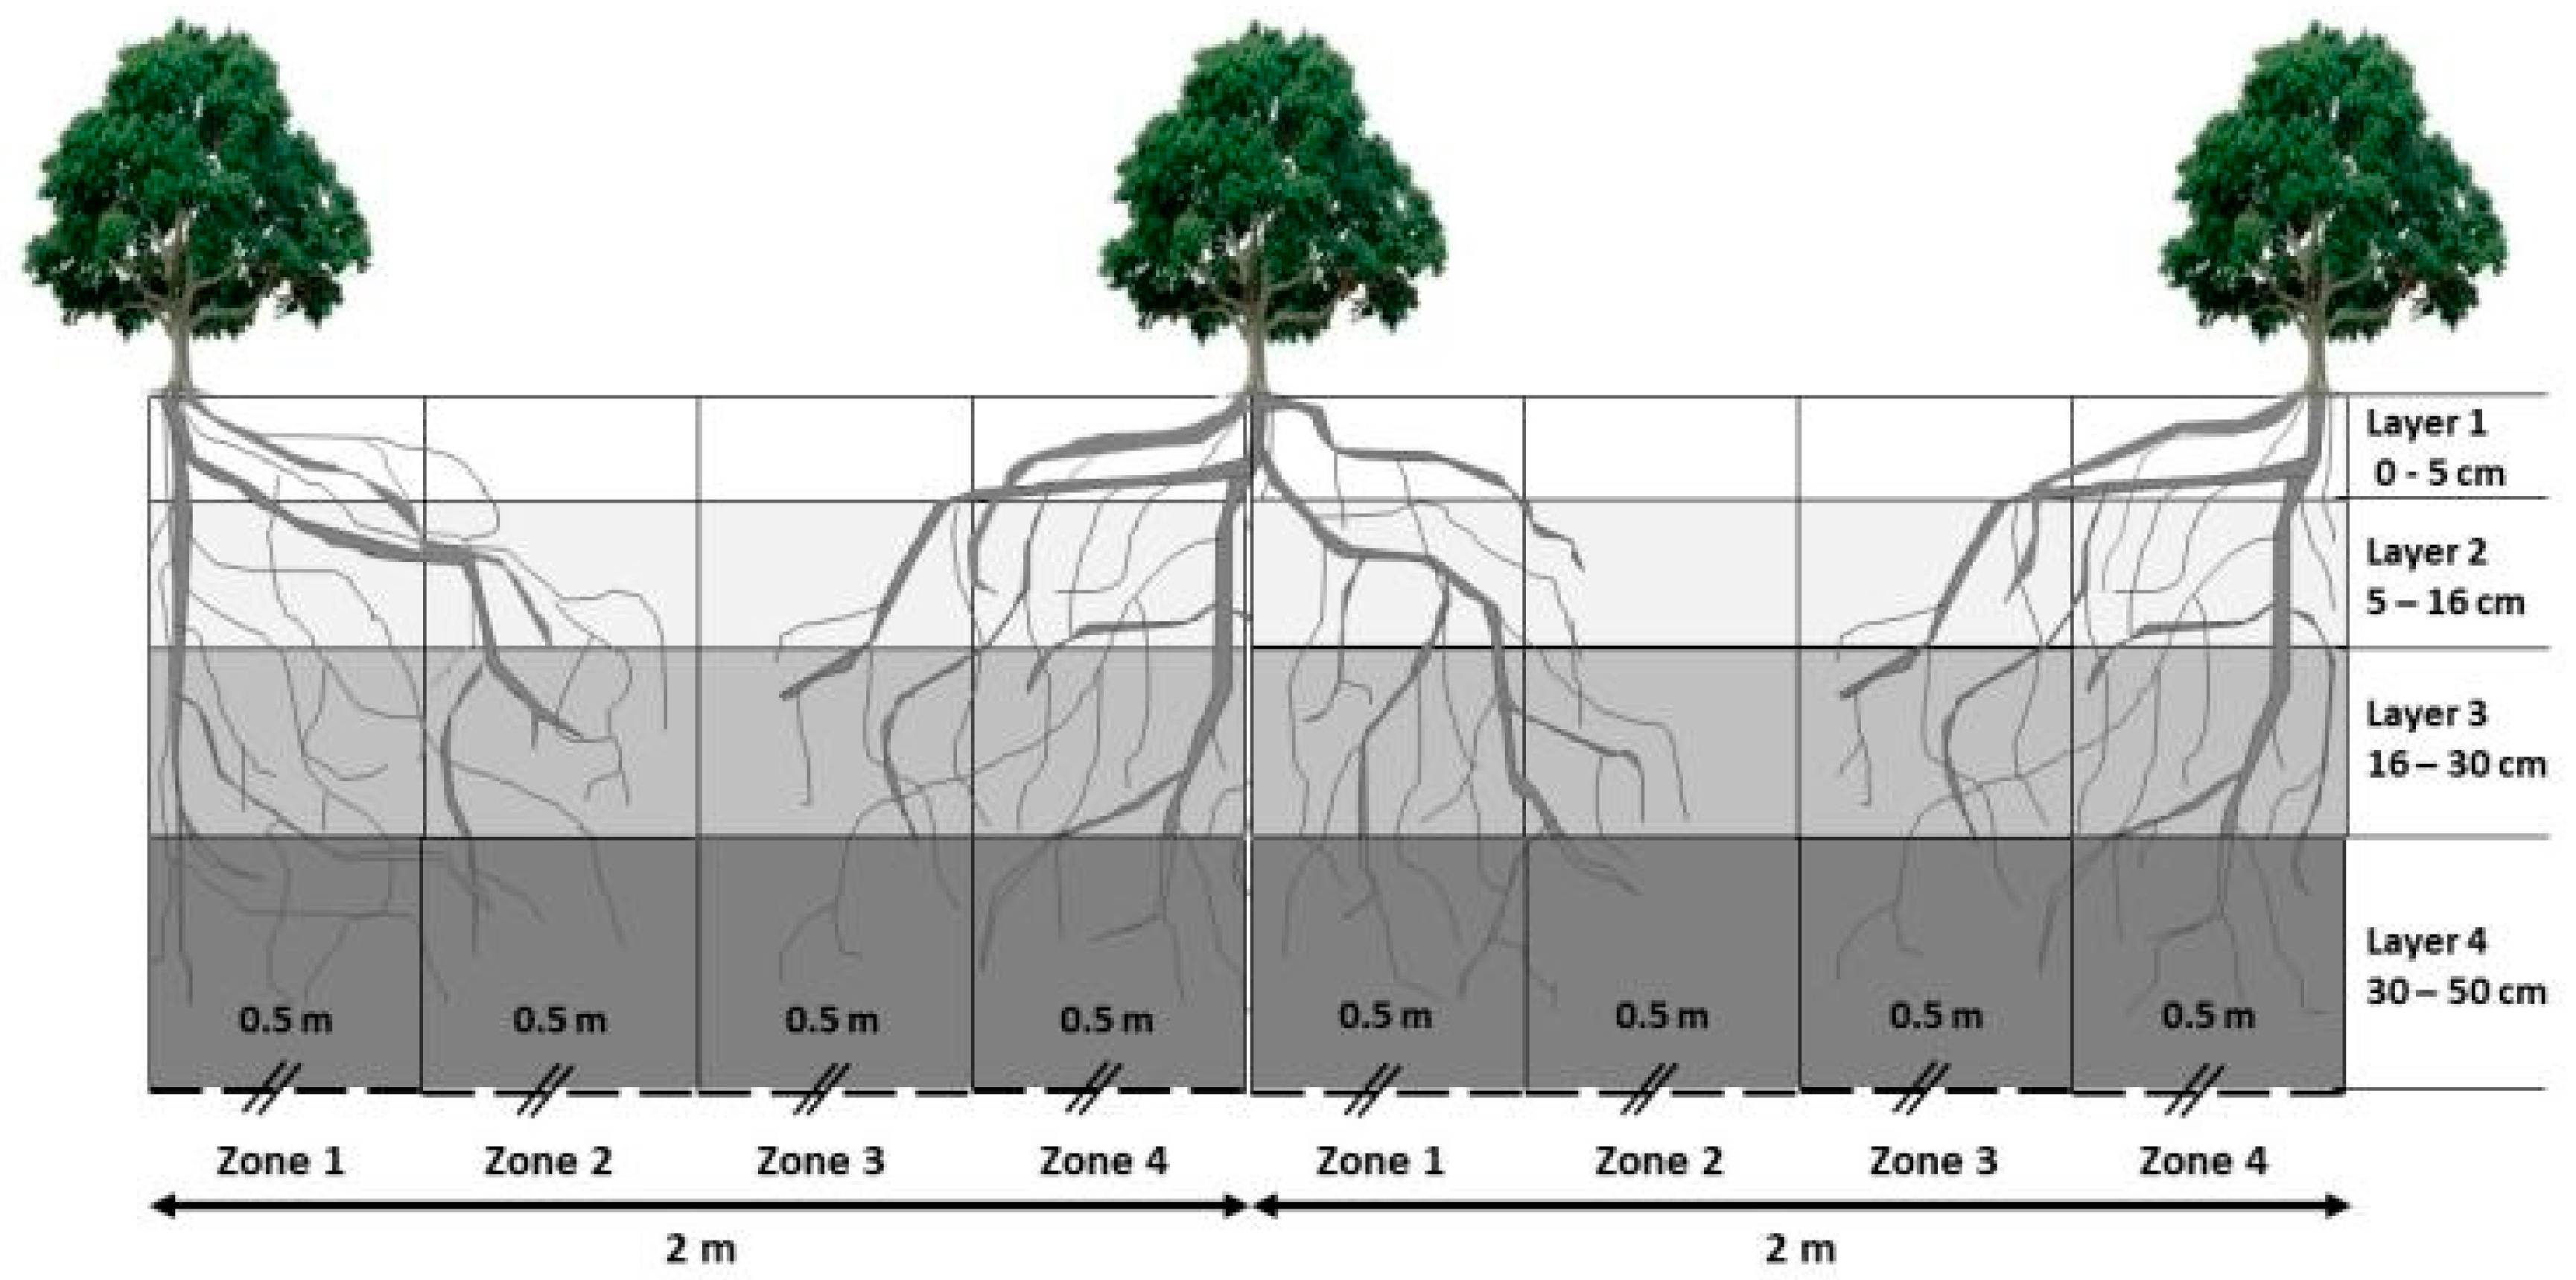
The process-based WaNuLCAS model was developed by van Noordwijk and Lusiana [35] to improve the understanding of tree–soil–crop interactions in agroforestry systems, and runs on the STELLA (version 7.0) modelling environment software (isee systems Inc., Lebanon, PA, USA) linked to Microsoft Excel spreadsheets for data input and output, which allows modification by users [35]. WaNuLCAS simulates the daily tree growth as a function of resource (i.e., water, nutrient and light) availability at plot-scale. The plot is represented by a four-layer soil profile and four spatial zones, where trees (and/or crops) can be positioned (Figure 2).
The model assumes homogenous site conditions within each of the four spatial zones. The emphasis of WaNuLCAS is on above- and belowground resource capture, based on leaf area and fine root length density interacting with resource supply as the basis for predicting interspecific complementarity and competition [51]. Belowground competition is described by calculating the demand and potential uptake of water and N and P nutrients using a zero-sink uptake model on the basis of the root length density. This assumes that the root uptake of water and nutrients is driven by plant demand, as long as the concentration of these resources at the root surface is above the limiting concentration, assumed to be zero under most conditions found in agricultural settings [52]. The demand for N uptake is defined by a “luxury uptake”, which assumes that growth will not be reduced until N content falls below 80% of the demand [51]. At the aboveground level, shading by trees is calculated as a function of the branch area index (BAI), leaf area index (LAI), and plant height in each zone. LAI-dependent light capture triggers photosynthesis, with carbon capture calculated on the dry weight basis. The distinction of the light captured by branch (BAI) and by leaves allows the model to account for tree shading when trees are leafless [51]. The model includes drought–induced litterfall and the re-emergence of leaves, controlled by phenological parameters.
The water balance of the system in WaNuLCAS includes rainfall, canopy interception, water evaporation from surface soil layers, water uptake by crops and trees, and leaching. Water is exchanged between the four zones by run-on and run-off. The vertical and horizontal transportation of water is also included [51]. Calculations of water infiltration into the soil profile follow a “tipping bucket” model [53]. Canopy interception is a function of ground cover (based on the LAI of trees and crops). Soil evaporation depends on both the ground cover and soil water content of the topsoil. Water uptake rate is driven by plant (i.e., trees and crops) transpirational demand, and is calculated based on soil and plant water potentials and the corresponding matrix flux potentials, determined following the methods of De Willigen et al. [52,54].
2.4.2. Input Data for WaNuLCAS
The WaNuLCAS model input data consist of weather data (daily rainfall, soil temperature, and potential evapotranspiration), soil parameters (texture; bulk density; saturated hydraulic conductivity; pH; and organic carbon, nitrogen, and phosphorus contents), tree management options (planting dates, amounts and timing of fertilization/organic material applications, intensity and timing of pruning), and tree library (i.e., growth parameters such as the length of the reproductive cycle, specific leaf area (SLA), growth rate; Supplementary materials, Tables S1 and S2).
Weather data: The 2014 and 2015 daily rainfall and air temperature data were made accessible by the Pouri weather station (Figure 1) located about 4 km away from the experiment site. Time-domain reflectometry (TDR) sensors (CS655, Soil Water Content Reflectometers, Campbell Scientific Ltd., Shepshed, Loughborough, LE12 9GX, UK) were installed at the experimental site at the beginning of the second rainy season to collect in-situ soil moisture and temperature data. Daily ET0 data was generated using the FAO ET0 calculator [55].
Soil parameters: Soil physical and chemical properties used to parameterize the WaNuLCAS model (Table 1) were set according to the four vertical layers of the model that correspond to the four layers obtained from the soil profile description (Figure 2). The Hodnett and Tomasella [56] pedotransfer function (PTF) in the WaNuLCAS model was used to generate soil hydraulic properties, representative of tropical soil conditions [57]. Default values of initial soil N (ammonium and nitrate) concentrations that were representative of a wide range of tropical cropping systems were used because no site–specific data was collected.
Crop and tree management: Field-collected data as described above was used for parameterization of this module. As the simulated system consists of trees only, the four horizontal zones of the model were set at equal widths of 0.5 m (Figure 2).
Tree growth parameters: Field-collected data was integrated into the “tree parametrization” Excel file (www.worldagroforestry.org/sea/Products/AFModels/wanulcas/down-loadc.htm) to generate key growth parameters, including LAI, plant water potential, light extinction coefficient, and others, for use in WaNuLCAS [35,51]. The parameters permitted the simulation of aboveground growth and development, in particular the H, D, and aboveground biomass (AGB; kg m−2) production, subjected to the abovementioned climate, soil, and management factors. The biomass accumulation was simulated using the empirical allometric relationship between the biomass fractions (total AGB, leaf plus twig biomass, wood biomass, and litterfall) and stem diameter:
where Y is the biomass of a given fraction (kg tree−1), D is the basal diameter (cm), and a and b are allometric coefficients.
The allometric coefficients (Table 2) were generated previously by Noulèkoun et al. [26] using the experimental data. The root growth in all zones and layers was assumed to be constant, which is representative of a tree system with an equilibrium of root growth and root decay [51]. A maximum root length density was thus given as an input, following van Noordwijk et al. [51].
2.4.3. Model Calibration, Validation, and Evaluation
The WaNuLCAS model was parametrized and calibrated with the two years of data gained from the fertilization (F) treatment. The data from the other treatments (C, I, and IF) were used for model validation. The three data collection periods (5, 11, and 15 MaP) served as comparison points between the measured and simulated values. During the calibration process, a sensitivity analysis was used to improve simulation results, following the method of Khasanah et al. [58]. Consequently, various parameters, such as the maximum LAI, maximum growth rate, and litterfall caused by drought, were modified for a more accurate reproduction of the observed values (Supplementary materials, Tables S1 and S2).
The model performance was evaluated by comparing the observed and simulated values of H, D, and AGB based on goodness of fit (GOF) (Appendix A, Table A1) statistical indicators proposed by Loague and Green [59], along with the coefficient of determination (R²) of the linear relationship between the observed and simulated values (Figure 3). Based on these criteria, the accuracy of the model simulations was evaluated for its suitability to analyze the climate sensitivity of growth scenarios.
2.4.4. Climate–Growth Relationship Analysis
The model validated with data from the C treatment was used for the simulations, as this represents the common, low-input silvicultural practice in the study area. After calibrating the WaNuLCAS model to adequately capture the growth dynamics of saplings, 35 runs were performed, each covering two consecutive years over the historical climate period of 35 years (1981–2016), to quantify the strength of relationships between annual AGB growth and climate indicators [28]. These included indicators related to the rainfall amount (e.g., annual water deficit (AWD)), intensity (e.g., very wet days (R95p)), and temporal distribution (e.g., length of the longest dry spell (LDSP)) (Table 3).
Only climate indicators that showed low correlation (r < 0.5) were considered and assumed to influence the annual growth of plants. Air temperature was not directly included as an explanatory variable because the WaNuLCAS model does not include a representation of the direct effect of temperature on plant growth. Nevertheless, the effect of temperature was indirectly incorporated into the length of extreme dry periods (LEDP) and AWD through the ET0 (Table 3).
The growth sensitivity of saplings to the prevailing climatic conditions was quantified by means of a linear mixed-effects model [28,60]. This approach was employed to account for the variance in growth between years. Climate indicators (Table 3) were used as fixed terms, i.e., as explanatory variables of the response variables (AGB) in the models, and the random term was the year. The model selection method [61] allowed the selection of the “best-fitting” model from a set of potential models fitted to each climate indicator separately, based on the difference in the corrected Akaike information criterion (ΔAICc) between a null model (including intercept and random effect only) and the one-indicator models. The ΔAICc describes the effects of a given climate indicator on a model’s fit. A model was considered climate-sensitive when the ΔAIC was greater than two [28]. The preferred model was that with the lowest AICc and the highest ΔAICc [62]. The mixed models were fitted using the maximum likelihood estimation, restricted maximum likelihood estimation for slope estimates, and an autocorrelation structure (first-order autoregression (AR1)). The analysis was conducted in R version 3.4.3 [63] using the ‘nlme’ package [64].
Assuming that the annual growth and weather parameters across sequential years are not correlated [65], we compared climate effects in the first and second years of growth. Three indices of climate sensitivity were considered during the comparison [28]: (i) the highest ΔAICc; (ii) the absolute value of the slope of the best model, which describes the strength and the direction of the relationship between the response and explanatory variables, as slopes were not bound to zero and can be either positive or negative; and (iii) the pseudo R² of the best model, which is a measure of the variance explained by a mixed model. The higher the value of any of these sensitivity indices, the higher the climate effects. Both the response and explanatory variables were standardized so that the slopes had a common unit and were comparable. The R² GLMM function of the ‘MuMIn’ library in R 3.4.3 was used to compute the R² value of each one-indicator mixed model [66].
2.4.5. Scenario Description
Scenario analyses were performed to evaluate the impact of rooting depth on the biomass production of saplings under two contrasting water stress conditions, considering the spatial variation in soil depth and depending on the landscape position and the depth of the lateritic hardpan, and possible root penetration of the hardpan to capture leached rainfall [18] (personal field observation). Two soil and rooting depth scenarios were thus built by keeping the total root length constant and by changing the initial rooting depth (50 cm; Figure 2) by +50%. This resulted in (i) a shallower rooting depth (33.3 cm) with obliquely oriented roots and (ii) a deeper rooting depth (75 cm) with vertically penetrating roots. Water stress was imposed during the simulations by using the climate data of the two consecutive years with the highest (i.e., severe water stress or extreme dry condition) and lowest (i.e., mild water stress or extreme wet condition) cumulative water deficits.
3. Results
3.1. Simulation of Tree Height, Diameter, and Aboveground Biomass
The outputs of the model calibration revealed strong linear relationships (R² > 0.8) between the simulated and observed values of H, D, and AGB (Figure 3) for both species. The tree growth increments were also reasonably well reproduced by the model (Appendix A, Figure A2). The overall evaluation of the model indicated a good fit between the model estimates and empirical values for the key parameters, as evidenced by the satisfactory values of model efficiency (EF), coefficient of determination (CD), coefficient of residual mass (CRM), and maximum error (ME) (Figure 3).
The reproducibility was reduced due to the diameter shrinking (RMSE ca. 7–12%) and the biomass loss as litterfall (root mean square error [RMSE] ca. 23–26%) during the dry season, which resulted in the overestimation of D and AGB by the model at this point in time (Figure 3; Appendix A, Figure A2).
The model validation (with the independent datasets from the C, I, and IF treatments) showed similar results to that of the model calibration, albeit with a reduced GOF compared to that of the calibration (Table 4). Furthermore, the comparison of the relative increment in growth parameters induced by the treatments between the model predictions and the field observations revealed that the predicted values aligned well with the field measurements for both species (Supplementary Materials, Table S3). Hence, the results of the calibration and validation revealed the model’s suitability for the envisaged scenario analyses.
3.2. Climate–Growth Relationships of the Afforestation Species
The annual AGB growth varied substantially over the simulation period as a result of the inter-annual rainfall and evapotranspiration variability inherent to the reference data (Figure 4 and Appendix A, Figure A1), confirming the common climate–growth relationship.
The observed variance reflected differences in the climate effects of a given year, when used either as year one or year two during the two-year simulation period. Differences in climate–growth patterns between the species are evident in Figure 4. For instance, the annual AGB growth of M. oleifera was higher in year two than in year one in 86% (30/35) of the runs, indicating that the annual growth is likely to be more influenced by climatic conditions in year two. In contrast, the biomass growth of J. curcas was dependent on the climatic conditions in both years (one and two; Figure 4).
The computed climate indicators can be further categorized into two groups: (i) drought-related indicators (AWD, LDSP, LEDP and LDS) and (ii) wetness-related indicators (LWS, ATWP, R95p and R95pot). The values of the drought-related indicators for the two years in which tree growth data were collected (2014 and 2015) were in the upper range of the 1981–2016 data (representing its maximum as shown by the year 2014 ranking for LDS), whereas the wetness-related indicators were in the lower quartile (Table 3). Furthermore, the results of the linear modeling analyses revealed that the AGB growth of both species was influenced by the AWD, LDS, LDSP, and ATWP (Table 5).
Across the years, drought-related indicators (AWD, LDS, and LDSP) best explained the variations in the annual AGB growth, as reflected in their overall high ΔAICc and R² values. The most important and extensive climate factor influencing the annual biomass growth for both species was the AWD, as evidenced by the highest values of the sensitivity indices (Table 5). The AWD was the easiest to calculate, as it only required ET0 and annual rainfall, rather than details of the temporal rainfall distribution. The biomass growth was inversely (slopes < 0) linked to the drought-related indicators, but the ATWP had a positive effect on the AGB growth of both species. The AWD had the strongest negative effect (highest slope values) on the sapling growth (Table 5).
The strength of climate–growth relationships and the identity of climate indicators in the best-fit models varied between years one and two (Table 5). The climate sensitivity was greatest in the second year of tree growth for all of the important climate indicators, except for the LDSP, which had the strongest effects on annual growth during the first year. Overall, M. oleifera tended to be less sensitive to climate than J. curcas, but the observed differences in sensitivity were too subtle to draw general statements considering the threshold (ΔAICc > 2) used to indicate a significant climate effect.
3.3. Simulated Effect of Rooting Depth on Sapling Biomass under Contrasting Water Stress Conditions
The simulation results revealed that the rooting depth influenced the biomass production of saplings (Figure 5), and the magnitude of this effect varied between the water stress scenarios. After the first two years of growth and irrespective of the species, AGB was 13–72% higher for deep–rooted plants compared to the shallow-rooted ones. The relative change in AGB induced by the deep rooting depth was greater under extreme dry conditions (i.e., 1984–1985) compared to that under extreme wet conditions (i.e., 2004–2005) (Figure 5). For instance, the relative change for J. curcas was 72% and 27% for the 1984–1985 and 2004–2005 runs, respectively. The enhanced biomass growth of saplings with deeper roots was related to an increased water uptake and canopy interception, reduced runoff and drainage, and thus increased the soil available water and its use by saplings (Figure 6).
4. Discussion
Climate change is likely to affect trees in the early growth stage, altering the long-term productivity of forests and plantations [42,44,67]. Although climate–growth relationships have been quantified for mature trees of several tropical and temperate species [9,29,68], much remains unknown regarding the sensitivity of tree growth during the early stages of development in semi-arid areas. In this study, we used a generic approach of climate sensitivity assessment that combines field experiments and modelling as an alternative to the traditional dendrochronology technique. First, we calibrated and validated the process-based model WaNuLCAS based on the empirical tree growth data. Second, we quantified the effects of climate variability on the predicted annual biomass increment, based on the most influential climate indicators. We also assessed the relevance of the empirical climate data to historical simulations based on the frequency distribution of the long-term climate indicator data (Table 3). Our results revealed drought-related indicators as the best predictors, which enabled to quantify their effects on sapling growth. Our approach has an advantage over the dendrochronological analysis because it uses actual biomass increment rather than biomass increment derived from tree-rings as recently suggested [31,32], thereby avoiding challenges associated with problematic anatomical features of tree rings common in tropical trees [29,30].
4.1. Model Performance
In accordance with previous studies [41,57,69,70], the range of the GOF statistics and the high correlation between the simulated and observed growth parameters for both the calibration (Figure 3) and the validation (Table 4) are indicative of the ability of the WaNuLCAS model to reproduce the early growth dynamics of the tested afforestation species with an acceptable accuracy and precision. A R² value of 0.5, CD value of 0.5–2, and EF value above 0.5 represent a good predicted–to–observed relationship [69]. However, the high values of the RMSE for AGB during the model calibration and the reduced GOF during the model validation indicated that not all growth limitations occurring under field conditions were adequately captured through simulations [39]. Most of the discrepancies between the simulations and empirical evidence arose from the limited capacity of the model to reproduce the monitored drought-induced trunk shrinkage and litterfall during the dry season. Shrinking tree diameters are not represented in the current version of the model, although they are known at both the diurnal and seasonal time scales [71]. Drought-induced litterfall is included in the model by a water potential threshold and a waiting period before new leaves emerge [72], but an accurate parametrization requires data beyond what is available for the site. While dry-season leaf shed is characteristic for drought-deciduous tree species, its accounting in our simulations resulted in large reductions of the total height rather than D and AGB (results not shown), implying that tree canopy and height are more influenced by this process than D and AGB in the WaNuLCAS model. The lack of calibrated litterfall data may have caused the poor fit of the predicted D and AGB, albeit only during the dry season [57]. Despite these deviations between the observed and simulated values during the dry season, the well-reproduced growth patterns and accurate prediction of D, H, and AGB at the end of the growing seasons (Appendix A, Figure A2) are a sufficient basis for further analyses of plant growth.
4.2. Climate Sensitivity of Afforestation Species
The predicted AGB growth series showed strong variations over the years (Figure 3), indicative of the influence of climate on the early growth of tree plantations [68]. Although both species have a semi-deciduous phenology and are fast growing and drought tolerant [18], their predicted annual growth responses to climate variability differed (Figure 3), confirming our hypothesis that the responses are species specific. This is likely due to the differences in stress tolerances [73] and/or allometry. Species differences in climate–growth responses have been reported for older trees of winter-deciduous broad-leaved species (Fagus sylvatica L. and Quercus petraea Matt.) under a temperate climate [68]. Together, these findings suggest that caution must be taken when parametrizing growth models according to plant functional types [5].
Water availability emerged as the primary driver of the climate sensitivity of trees in the early stages of growth in semi-arid areas. Similar climate–growth relationships were previously found for temperate tree species [68,74] and for shrub species across the tundra biome [28]. Annual biomass accumulation declined with annual water deficit, the length of the dry season, and the length of the longest dry spell, but increased with the annual total wet-day precipitation (Table 5). This supports our hypothesis that drought-related indicators negatively affect biomass growth in particular. The negative climate–growth relationships with drought-related indicators suggested that drought-reduced sapling growth occurred not only due to reductions in the total amount of precipitation and subsequent longer dry seasons (e.g., AWD), but also due to variability in the distribution of rainfall (e.g., the LDSP). This outcome is reminiscent of the findings by Elliott et al. [9], which showed that the distribution of precipitation is more influential on the radial growth of deciduous tree species than the amount.
Increased aridity (AWD) had the strongest negative influence on the growth of saplings, suggesting that the projected increase in aridity in northern Benin [75] may result in a substantial decrease in growth. For instance, the predicted AGB of J. curcas after two years of growth was 0.34 and 0.49 kg m−2 under extreme (highest AWD) and mild (lowest AWD) drought conditions, respectively, which represents a potential 31% loss in AGB growth. Applying the same calculations for M. oleifera resulted in a 14% loss in growth if the aridity is increased. These estimates are obviously to some extent simplified, as AWD is not the only climate factor that is likely to change in the future; however, they do highlight the relative importance of water limitation for the early growth of tree plantations and hence for the planted afforestation efforts in the region.
The influence of drought on tree growth and the identity of climate drivers were not uniform between years. In year one, the duration of the LDSP in the rainy season had the best predictive power, while in year two, the annual water balance (here, the difference between precipitation and ET0) was the best predictor for both species (Table 5). This supports our hypothesis that the climate sensitivity to ‘immediate’ drought is stronger at the very early stages of tree growth, when root systems are not yet fully established [43,44,45], compared to later stages where the water balance dominates results. Sensitivity to AWD and LDS was greater in the second year compared to the first. This could be attributed to the increased tree water use and consequent reduction in soil available water related to increased canopy interception and water drainage as a function of tree growth in the WaNuLCAS model [51]. For instance, the water use efficiency of J. curcas, defined as the water uptake to total rainfall ratio, was 4% in year one and 10% in year two under the most extreme historical drought scenario (1984–1985). This implies that the same AWD or LDS would result in more water stress in year two than in year one. Hence, the climatic factors related to the amount of precipitation showed greater sensitivity in year two, whereas greater sensitivity to LDSP, which describes the distribution of precipitation, was more evident in year one.
Just as empirical data gives insights in the credibility of model predictions, the current analysis of sensitivity of tree growth to a range of rainfall metrics can help to better judge the representativeness of the empirical data regarding climate variability in the study area. The year 2014 had the longest LDS of the available climate data set for the test site, while the AWD and LDSP of both years were in the upper quartiles (Table 3). The values of the wetness-related indicator (ATWP) were in the lowest quartile for both years. Apparently, the years in which experimental data were collected were already foreboding what climate change predictions point out as a ‘new normal’ for the study area: less predictable rain, with more extremes on both the high and the low end [12,13]. Therefore, the tree performance measured during the two years is probably a conservative estimate of what can be expected in years closer to the current average values and is more representative of the expected growth under projected climate conditions.
4.3. Effects of Rooting Depth on Biomass Growth under Extreme Dry Conditions
The simulation results showed that deeper rooting depth was an advantage to sapling growth of both species under extreme dry conditions (Figure 5). Moreover, the AGB at the end of year two was greater for deep–rooted than shallow–rooted saplings in both extreme dry and wet conditions. The improved performance can be attributed to enhanced tree water use under deep rooting depth conditions as a result of increased water uptake and canopy interception, and reduced water drainage and runoff (Figure 6). The relative increase in AGB, induced by the deep rooting depth, was greater under severe water stress compared to mild water stress, suggesting that deep-rooted saplings are less sensitive to extreme drought than shallow-rooted saplings. Similarly, Coulibaly et al. [41] has reported that tree species with deep rooting systems are less vulnerable to water deficits. These results can be attributed to the fact that during extreme drought conditions, deep rooted saplings take advantage of their access to deeper soil horizons, which could result in increased photosynthetic activity and continued biomass production, as reported by Hartl-Meier et al. [22] for beech (Fagus sylvatica L.) and larch (Larix decidua Mill.) under a temperate climate.
4.4. Replicability of the Approach
Where trees of a wide range of ages can be found in a local environment of interest, dendrochronological analysis can, in combination with climate records, be used for assessing the effects of climate change on young forests. In the absence of such, the combination we used of experiments, model calibration and identification of the local climate metric with the best predictive skill can improve the value of experiments and increase their interpretation, at the interface of climate change mitigation and adaptation strategies.
5. Conclusions
The WaNuLCAS model was successfully calibrated and validated to simulate sapling growth of two afforestation species in semi-arid northern Benin. Although the stem diameter and biomass predictions during the dry season were poorly simulated due to the limited ability of the model to reproduce trunk shrinkage and litterfall during this period, the overall outputs of the model calibration and validation were satisfactory. The model application to simulate the early growth of the afforestation species under past climate conditions permitted the quantification of the climate sensitivity of sapling growth.
The aboveground biomass growth was most sensitive to water availability, as evidenced by the negative relationships between growth and drought-related indicators, and the positive growth response to annual total wet-day precipitation. The distribution, rather than the total amount, of precipitation was the main factor limiting sapling growth at the very early stages of growth (year one), when tree root systems are not yet well established. Given the projected increase in variability of precipitation distribution, extended arid conditions, and longer dry spells in West Africa, the current results suggest that increased aridity could play an increasingly important role in limiting future tree establishment and forest growth. Based on the observed species-specific responses to climate variability and the importance of root depth in buffering the negative effects of extreme drought on sapling growth, a multi-species afforestation system with species that are able to develop deep-penetrating root systems may increase the resilience of plantations to climate change.
The current results illustrate that process-based modelling combined with field experiments can be effective in integration of multi-source data to assess the climate–growth relationships of tree species. Further verification of the simulation results under field conditions, through dendrochronological and rhizological studies, would be needed to develop confidence in the application of WaNuLCAS for climate–growth analyses.
Supplementary Materials
The following are available online at https://www.mdpi.com/2071-1050/10/6/1931/s1, Table S1: Tree parameters used for simulating the growth of Jatropha curcas L. in WaNuLCAS; Table S2: Tree parameters used for simulating the growth of Moringa oleifera Lam. in WaNuLCAS; Table S3: Relative increment in height (m), diameter (cm), and aboveground biomass (ABG, kg m−2) in response to fertilization, irrigation and fertilization plus irrigation as observed and as simulated by WaNuLCAS.
Author Contributions
F.N., J.P.A.L., J.B.N., and A.K. conceived and designed the experiments. F.N. and J.B.N. conducted the experiments and field data collection. F.N., N.K., and M.v.N. performed modeling and statistical analyses. All the authors contributed to the writing of the manuscript.
Acknowledgments
The authors gratefully acknowledge the financial support by the German Federal Ministry of Education and Research (BMBF) under the WASCAL (West African Science Service Center on Climate Change and Adapted Land Use) program, project No. 00100218 and the additional support by O-Jeong Eco-Resilience Institute (South Korea). We thank Nadine Worou, the technical staff of the WASCAL study catchment in Dassari, and the numerous workers for assistance during field sampling. We greatly appreciate the statistical guidance by Guido Lüchters and Merveille Koissi Savi.
Conflicts of Interest
The authors declare no conflict of interest.
Appendix A

Table A1.
Statistical criteria proposed by Loague and Green [59] to evaluate model performance.
Table A1.
Statistical criteria proposed by Loague and Green [59] to evaluate model performance.
| Criteria | Symbol | Formula | Acceptable Range | Optimum Value |
|---|---|---|---|---|
| Model efficiency | EF | ≤1 | 1 | |
| Coefficient of determination | CD | 0.5–2 * | 1 | |
| Maximum error | ME | ≥0 | 0 | |
| Root mean square error | RMSE | ≥0 | 0 | |
| Coefficient of residual mass | CRM | ≤1 | 0 |
Pi, predicted value; Oi, observed value; Omean, mean of the observed value. * The range for CD proposed by Walker et al. [57].
Figure A1.
Relative changes in the annual rainfall (mm), annual potential evapotranspiration (mm), and air temperature (°C) between 1981 and 2016 compared to the long-term historical means presented in Figure 1.
Figure A1.
Relative changes in the annual rainfall (mm), annual potential evapotranspiration (mm), and air temperature (°C) between 1981 and 2016 compared to the long-term historical means presented in Figure 1.


Figure A2.
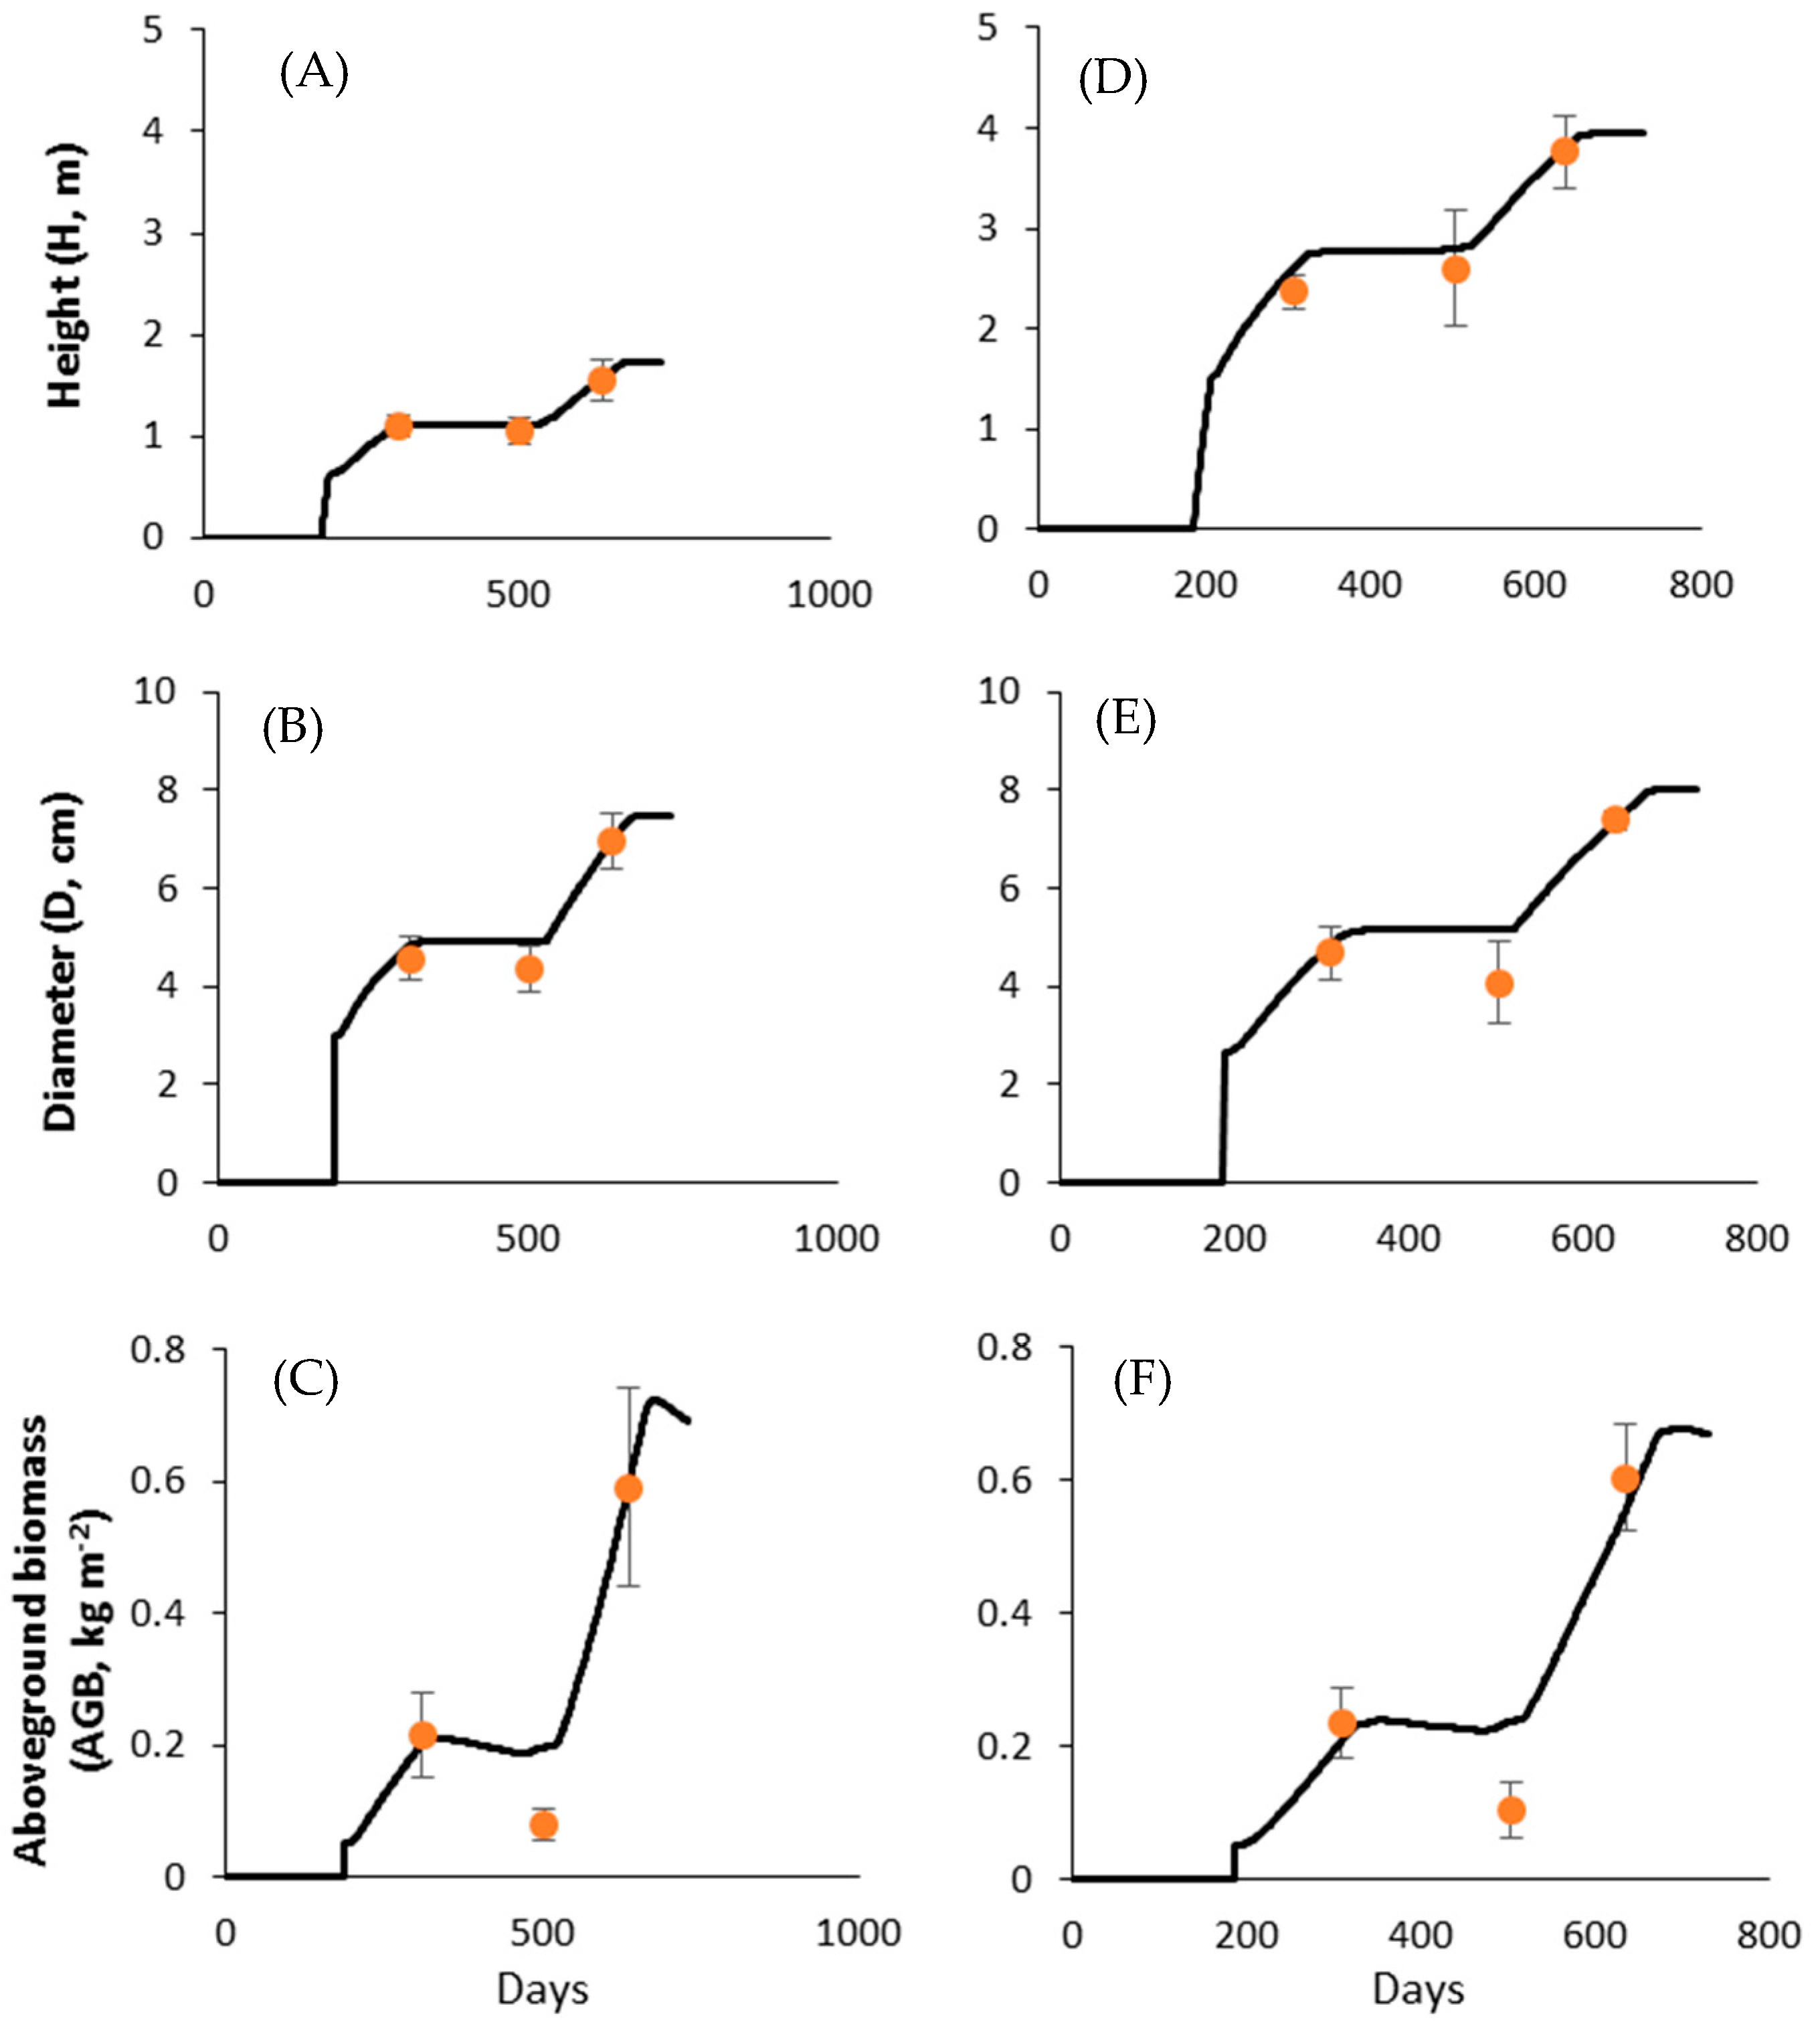
Simulated height (H, m), stem diameter (D, cm), and aboveground biomass (AGB, kg m−2) dynamics for Jatropha curcas (A–C) and Moringa oleifera (D–F) during calibration for which the empirical datasets from the fertilization treatment was used. The three comparison points (circles) represent the three harvest times (i.e., 5, 11, and 15 months after planting). Vertical bars are standard errors of the mean. Seedling planting time was defined at 186 Julian days in the Water, Nutrient and Light Capture in Agroforestry Systems (WaNuLCAS) model.
Figure A2.
Simulated height (H, m), stem diameter (D, cm), and aboveground biomass (AGB, kg m−2) dynamics for Jatropha curcas (A–C) and Moringa oleifera (D–F) during calibration for which the empirical datasets from the fertilization treatment was used. The three comparison points (circles) represent the three harvest times (i.e., 5, 11, and 15 months after planting). Vertical bars are standard errors of the mean. Seedling planting time was defined at 186 Julian days in the Water, Nutrient and Light Capture in Agroforestry Systems (WaNuLCAS) model.

References
- UNFCCC. Kyoto Protocol to the United Nations Framework Convention on Climate Change; United Nations Framework Convention on Climate Change: Bonn, Germany, 1997. [Google Scholar]
- UNFCCC. Outcome of the work of the ad hoc working group on long-term cooperative action under the convention—Policy approaches and positive incentives on issues relating to reducing emissions from deforestation and forest degradation in developing countries, and the role of conservation, sustainable management of forests and enhancement of forest carbon stocks in developing countries. In Proceedings of the Ad Hoc Working Group on Long-Term Cooperative Actionunder the Convention, Copenhagen, Denmark, 7–15 December 2009. [Google Scholar]
- Garrity, D.P.; Akinnifesi, F.K.; Ajayi, O.C.; Weldesemayat, S.G.; Mowo, J.G.; Kalinganire, A.; Larwanou, M.; Bayala, J. Evergreen Agriculture: A robust approach to sustainable food security in Africa. Food Secur. 2010, 2, 197–214. [Google Scholar] [CrossRef]
- Sanderson, M.; Santini, M.; Valentini, R.; Pope, E. Relationships between Forests and Weather; EC Directorate General of the Environment: Brussels, Belgium, 2012. [Google Scholar]
- Betts, R.A.; Boucher, O.; Collins, M.; Cox, P.M.; Falloon, P.D.; Gedney, N.; Hemming, D.L.; Huntingford, C.; Jones, C.D.; Sexton, D.M.H.; et al. Projected increase in continental runoff due to plant responses to increasing carbon dioxide. Nature 2007, 448, 1037–1041. [Google Scholar] [CrossRef] [PubMed]
- Hosonuma, N.; Herold, M.; De Sy, V.; De Fries, R.S.; Brockhaus, M.; Verchot, L.; Angelsen, A.; Romijn, E. An assessment of deforestation and forest degradation drivers in developing countries. Environ. Res. Lett. 2012, 7, 044009. [Google Scholar] [CrossRef] [Green Version]
- Pearson, T.R.H.; Brown, S.; Murray, L.; Sidman, G. Greenhouse gas emissions from tropical forest degradation: An underestimated source. Carbon Balance Manag. 2017, 12. [Google Scholar] [CrossRef] [PubMed]
- Pachauri, R.; Allen, M.; Barros, V.; Broome, J.; Cramer, W.; Christ, R.; Church, J.; Clarke, L.; Dahe, Q.; Dasgupta, P.; et al. Climate Change 2014: Synthesis Report. Contribution of Working Groups I, II and III to the Fifth Assessment Report of the Intergovernmental Panel on Climate Change; IPCC, Intergovernmental Panel on Climate Change: Geneva, Switzerland, 2014. [Google Scholar]
- Elliott, K.J.; Miniat, C.F.; Pederson, N.; Laseter, S.H. Forest tree growth response to hydroclimate variability in the southern Appalachians. Glob. Chang. Biol. 2015, 21, 4627–4641. [Google Scholar] [CrossRef] [PubMed]
- Thurm, E.A.; Uhl, E.; Pretzsch, H. Mixture reduces climate sensitivity of Douglas-fir stem growth. For. Ecol. Manag. 2016, 376, 205–220. [Google Scholar] [CrossRef]
- Poorter, L. Biodiversity of West African Forests: An Ecological Atlas of Woody Plant Species; CABI: Wallingford, UK, 2004. [Google Scholar]
- Sylla, M.B.; Giorgi, F.; Pal, J.S.; Gibba, P.; Kebe, I.; Nikiema, M. Projected Changes in the Annual Cycle of High-Intensity Precipitation Events over West Africa for the Late Twenty-First Century. J. Clim. 2015, 28, 6475–6488. [Google Scholar] [CrossRef]
- Sylla, M.B.; Nikiema, P.M.; Gibba, P.; Kebe, I.; Klutse, N.A.B. Climate Change over West Africa: Recent Trends and Future Projections. In Adaptation to Climate Change and Variability in Rural West Africa; Yaro, J.A., Hesselberg, J., Eds.; Springer International Publishing: Cham, Switzerland, 2016; pp. 25–40. ISBN 978-3-319-31497-6. [Google Scholar]
- Abdulai, I.; Vaast, P.; Hoffmann, M.P.; Asare, R.; Jassogne, L.; Van Asten, P.; Rötter, R.P.; Graefe, S. Cocoa agroforestry is less resilient to sub-optimal and extreme climate than cocoa in full sun. Glob. Chang. Biol. 2018, 24, 273–286. [Google Scholar] [CrossRef] [PubMed]
- Wang, S.; Huang, J.; He, Y.; Guan, Y. Combined effects of the Pacific Decadal Oscillation and El Niño-Southern Oscillation on Global Land Dry–Wet Changes. Sci. Rep. 2015, 4. [Google Scholar] [CrossRef] [PubMed]
- Castro, J.; Zamora, R.; Hódar, J.A.; Gómez, J.M. Alleviation of Summer Drought Boosts Establishment Success of Pinus sylvestris in a Mediterranean Mountain: An Experimental Approach. Plant Ecol. 2005, 181, 191–202. [Google Scholar] [CrossRef]
- Comita, L.S.; Engelbrecht, B.M.J. Drought as a driver of tropical tree species regeneration dynamics and distribution patterns. In Forests and Global Change; Coomes, D.A., Burslem, D.F.R.P., Simonson, W.D., Eds.; Cambridge University Press: Cambridge, UK, 2014; pp. 261–308. ISBN 978-1-107-32350-6. [Google Scholar]
- Noulèkoun, F.; Lamers, J.P.A.; Naab, J.; Khamzina, A. Shoot and root responses of woody species to silvicultural management for afforestation of degraded croplands in the Sudano-Sahelian zone of Benin. For. Ecol. Manag. 2017, 385, 254–263. [Google Scholar] [CrossRef]
- Geßler, A.; Keitel, C.; Kreuzwieser, J.; Matyssek, R.; Seiler, W.; Rennenberg, H. Potential risks for European beech (Fagus sylvatica L.) in a changing climate. Trees 2007, 21, 1–11. [Google Scholar] [CrossRef]
- Noulèkoun, F.; Khamzina, A.; Naab, J.B.; Lamers, J.P.A. Biomass allocation in five semi-arid afforestation species is driven mainly by ontogeny rather than resource availability. Ann. For. Sci. 2017, 74. [Google Scholar] [CrossRef]
- Van Noordwijk, M.; van Lawson, G.; Hairiah, K.; Wilson, J. Root distribution of trees and crops: Competition and/or complementarity. In Tree-Crop Interactions: Agroforestry in a Changing Climate; Ong, C.K., Black, C.R., Wilson, J., Eds.; CABI: Wallingford, UK, 2015; pp. 221–257. ISBN 978-1-78064-511-7. [Google Scholar]
- Hartl-Meier, C.; Zang, C.; Buntgen, U.; Esper, J.; Rothe, A.; Gottlein, A.; Dirnbock, T.; Treydte, K. Uniform climate sensitivity in tree-ring stable isotopes across species and sites in a mid-latitude temperate forest. Tree Physiol. 2015, 35, 4–15. [Google Scholar] [CrossRef] [PubMed]
- Gebrekirstos, A.; Mitlöhner, R.; Teketay, D.; Worbes, M. Climate-growth relationships of the dominant tree species from semi-arid savanna woodland in Ethiopia. Trees 2008, 22, 631–641. [Google Scholar] [CrossRef]
- Teets, A.; Fraver, S.; Weiskittel, A.R.; Hollinger, D.Y. Quantifying climate-growth relationships at the stand level in a mature mixed-species conifer forest. Glob. Chang. Biol. 2018. [Google Scholar] [CrossRef] [PubMed]
- Raz-Yaseef, N.; Yakir, D.; Schiller, G.; Cohen, S. Dynamics of evapotranspiration partitioning in a semi-arid forest as affected by temporal rainfall patterns. Agric. For. Meteorol. 2012, 157, 77–85. [Google Scholar] [CrossRef]
- Noulèkoun, F.; Naab, J.B.; Lamers, J.P.A.; Baumert, S.; Khamzina, A. Sapling biomass allometry and carbon content in five afforestation species on marginal farmland in semi-arid Benin. New For. 2018, 49, 363–382. [Google Scholar] [CrossRef]
- Schöngart, J.; Orthmann, B.; Hennenberg, K.J.; Porembski, S.; Worbes, M. Climate-growth relationships of tropical tree species in West Africa and their potential for climate reconstruction. Glob. Chang. Biol. 2006, 12, 1139–1150. [Google Scholar] [CrossRef]
- Myers-Smith, I.H.; Elmendorf, S.C.; Beck, P.S.A.; Wilmking, M.; Hallinger, M.; Blok, D.; Tape, K.D.; Rayback, S.A.; Macias-Fauria, M.; Forbes, B.C.; et al. Climate sensitivity of shrub growth across the tundra biome. Nat. Clim. Chang. 2015, 5, 887–891. [Google Scholar] [CrossRef]
- Brienen, R.J.W.; Zuidema, P.A. Lifetime growth patterns and ages of Bolivian rain forest trees obtained by tree ring analysis. J. Ecol. 2006, 94, 481–493. [Google Scholar] [CrossRef] [Green Version]
- Herrera-Ramirez, D.; Andreu-Hayles, L.; del Valle, J.I.; Santos, G.M.; Gonzalez, P.L.M. Nonannual tree rings in a climate-sensitive Prioria copaifera chronology in the Atrato River, Colombia. Ecol. Evol. 2017, 7, 6334–6345. [Google Scholar] [CrossRef] [PubMed]
- Bouriaud, O.; Bréda, N.; Dupouey, J.-L.; Granier, A. Is ring width a reliable proxy for stem-biomass increment? A case study in European beech. Can. J. For. Res. 2005, 35, 2920–2933. [Google Scholar] [CrossRef]
- Foster, J.R.; D’Amato, A.W.; Bradford, J.B. Looking for age-related growth decline in natural forests: Unexpected biomass patterns from tree rings and simulated mortality. Oecologia 2014, 175, 363–374. [Google Scholar] [CrossRef] [PubMed]
- Kimmins, J.P.; Mailly, D.; Seely, B. Modelling forest ecosystem net primary production: The hybrid simulation approach used in forecast. Ecol. Model. 1999, 122, 195–224. [Google Scholar] [CrossRef]
- Johnsen, K.; Samuelson, L.; Teskey, R.; McNulty, S.; Fox, T. Process Models as Tools in Forestry Research and Management. For. Sci. 2001, 47, 2–8. [Google Scholar]
- Van Noordwijk, M.; Lusiana, B. WaNuLCAS, a model of water, nutrient and light capture in agroforestry systems. In Agroforestry for Sustainable Land-Use Fundamental Research and Modelling with Emphasis on Temperate and Mediterranean Applications; Auclair, D., Dupraz, C., Eds.; Springer: Dordrecht, The Netherlands, 1999; Volume 60, pp. 217–242. ISBN 978-90-481-5258-2. [Google Scholar]
- Kang, H.; Seely, B.; Wang, G.; Cai, Y.; Innes, J.; Zheng, D.; Chen, P.; Wang, T. Simulating the impact of climate change on the growth of Chinese fir plantations in Fujian province, China. N. Z. J. For. Sci. 2017, 47. [Google Scholar] [CrossRef] [Green Version]
- Bayala, J.; Sanou, J.; Teklehaimanot, Z.; Ouedraogo, S.J.; Kalinganire, A.; Coe, R.; Van Noordwijk, M. Advances in knowledge of processes in soil–tree–crop interactions in parkland systems in the West African Sahel: A review. Agric. Ecosyst. Environ. 2015, 205, 25–35. [Google Scholar] [CrossRef]
- Luedeling, E.; Smethurst, P.J.; Baudron, F.; Bayala, J.; Huth, N.I.; van Noordwijk, M.; Ong, C.K.; Mulia, R.; Lusiana, B.; Muthuri, C.; et al. Field-scale modeling of tree–crop interactions: Challenges and development needs. Agric. Syst. 2016, 142, 51–69. [Google Scholar] [CrossRef]
- Bayala, J.; van Noordwijk, M.; Lusiana, B.; Ni’matul, K.; Teklehaimanot, Z.; Ouedraogo, S.J. Separating the Tree–Soil–Crop Interactions in Agroforestry Parkland Systems in Saponé (Burkina Faso) using WaNuLCAS. In Toward Agroforestry Design; Jose, S., Gordon, A.M., Eds.; Springer: Dordrecht, The Netherlands, 2008; Volume 4, pp. 285–297. ISBN 978-1-4020-6571-2. [Google Scholar]
- Bayala, J.; Heng, L.K.; van Noordwijk, M.; Ouedraogo, S.J. Hydraulic redistribution study in two native tree species of agroforestry parklands of West African dry savanna. Acta Oecol. 2008, 34, 370–378. [Google Scholar] [CrossRef]
- Coulibaly, Y.N.; Mulia, R.; Sanou, J.; Zombré, G.; Bayala, J.; Kalinganire, A.; van Noordwijk, M. Crop production under different rainfall and management conditions in agroforestry parkland systems in Burkina Faso: Observations and simulation with WaNuLCAS model. Agrofor. Syst. 2014, 88, 13–28. [Google Scholar] [CrossRef]
- Van Noordwijk, M.; Cadisch, G. Access and excess problems in plant nutrition. In Progress in Plant Nutrition: Plenary Lectures of the XIV International Plant Nutrition Colloquium; Horst, W.J., Bürkert, A., Claassen, N., Flessa, H., Frommer, W.B., Goldbach, H., Merbach, W., Olfs, H.-W., Römheld, V., Sattelmacher, B., et al., Eds.; Springer: Dordrecht, The Netherlands, 2002; pp. 25–40. ISBN 978-90-481-6191-1. [Google Scholar]
- Cao, K. Water relations and gas exchange of tropical saplings during a prolonged drought in a Bornean heath forest, with reference to root architecture. J. Trop. Ecol. 2000, 16, 101–116. [Google Scholar] [CrossRef]
- Gibbons, J.M.; Newbery, D.M. Drought avoidance and the effect of local topography on trees in the understorey of Bornean lowland rain forest. Plant Ecol. 2003, 164, 1–18. [Google Scholar] [CrossRef]
- Engelbrecht, B.M.J.; Kursar, T.A.; Tyree, M.T. Drought effects on seedling survival in a tropical moist forest. Trees 2005, 19, 312–321. [Google Scholar] [CrossRef] [Green Version]
- Adegbidi, A.; Burger, K.; Gandonou, E.; Mulder, I. Farmers’ Perceptions and Sustainable Land Use in the Atacora, Benin; CREED Working Paper 22; International Institute for Environment and Development: London, UK, 1999. [Google Scholar]
- Mulder, I. Soil Degradation in Benin: Farmers’ Perceptions and Responses. Ph.D. Thesis, Tinbergen Institute, Vrije Universiteit Amsterdam, Amsterdam, The Netherlands, 2000. [Google Scholar]
- Gandji, K.; Chadare, F.J.; Idohou, R.; Salako, V.K.; Assogbadjo, A.E.; Kakaï, R.L.G. Status and utilisation of Moringa oleifera Lam: A review. Afr. Crop Sci. J. 2018, 26, 137–156. [Google Scholar] [CrossRef]
- WRB (Ed.) World Reference Base for Soil Resources 2006: A Framework for International Classification, Correlation and Communication; World Soil Resources Reports; FAO: Rome, Italy, 2006; ISBN 978-92-5-105511-3. [Google Scholar]
- Walter, H.; Lieth, H. Climate Diagram World Atlas; VEB Gustav Fischer: Jena, Germany, 1967. [Google Scholar]
- Van Noordwijk, M.; Lusiana, B.; Khasanah, N.; Mulia, R. WaNuLCAS Version 4.0, Background on a Model of Water, Nutrient and Light Capture in Agrofoerestry Systems; World Agroforestry Center—ICRAF, SEA Regional Office: Bogor, Indonesia, 2011; ISBN 978-979-3198-59-0. [Google Scholar]
- De Willigen, P.; van Noordwijk, M. Roots for Plant Production and Nutrient Use Efficiency; Agricultural University Wageningen: Wageningen, The Netherlands, 1987. [Google Scholar]
- Emerman, S.H. The tipping bucket equations as a model for macropore flow. J. Hydrol. 1995, 171, 23–47. [Google Scholar] [CrossRef]
- De Willigen, P.; Nielsen, N.E.; Claassen, N.; Castrignanò, A.M. Modelling Water and Nutrient Uptake. In Root Methods; Smit, A.L., Bengough, A.G., Engels, C., van Noordwijk, M., Pellerin, S., van de Geijn, S.C., Eds.; Springer: Berlin/Heidelberg, Germany, 2000; ISBN 978-3-662-04188-8. [Google Scholar]
- Allen, R.G.; Pereira, L.S.; Raes, D.; Smith, M. Crop Evapotranspiration—Guidelines for Computing Crop Water Requirements; FAO Irrigation and Drainage Paper 56; FAO: Rome, Italy, 1998; Volume 300. [Google Scholar]
- Hodnett, M.G.; Tomasella, J. Marked differences between van Genuchten soil water-retention parameters for temperate and tropical soils: A new water-retention pedo-transfer functions developed for tropical soils. Geoderma 2002, 108, 155–180. [Google Scholar] [CrossRef]
- Walker, A.P.; Mutuo, P.K.; Albrecht, A.; Cadisch, G. Modelling of planted legume fallows in Western Kenya using WaNuLCAS. (I) Model calibration and validation. Agrofor. Syst. 2007, 70, 197–209. [Google Scholar] [CrossRef] [Green Version]
- Khasanah, N.; Perdana, A.; Rahmanullah, A.; Manurung, G.; Roshetko, J.M.; van Noordwijk, M. Intercropping teak (Tectona grandis) and maize (Zea mays): Bioeconomic trade-off analysis of agroforestry management practices in Gunungkidul, West Java. Agrofor. Syst. 2015, 89, 1019–1033. [Google Scholar] [CrossRef]
- Loague, K.; Green, R.E. Statistical and graphical methods for evaluating solute transport models: Overview and application. J. Contam. Hydrol. 1991, 7, 51–73. [Google Scholar] [CrossRef]
- Gazol, A.; Camarero, J.J. Mediterranean dwarf shrubs and coexisting trees present different radial-growth synchronies and responses to climate. Plant Ecol. 2012, 213, 1687–1698. [Google Scholar] [CrossRef]
- Johnson, J.B.; Omland, K.S. Model selection in ecology and evolution. Trends Ecol. Evol. 2004, 19, 101–108. [Google Scholar] [CrossRef] [PubMed] [Green Version]
- Burnham, K.P.; Anderson, D.R. Multimodel Inference: Understanding AIC and BIC in Model Selection. Sociol. Methods Res. 2004, 33, 261–304. [Google Scholar] [CrossRef]
- R Core Team. R: A Language and Environment for Statistical Computing; R Foundation for Statistical Computing: Vienna, Austria, 2017. [Google Scholar]
- Pinheiro, J.; Bates, D.; DebRoy, S.; Sarkar, D. R Core Team nlme: Linear and Nonlinear Mixed Effects Models; R Foundation for Statistical Computing: Vienna, Austria, 2017. [Google Scholar]
- Duan, J.; Sikka, A.; Grant, G. A comparison of stochastic models for generating daily precipitation at the HJ Andrews Experimental Forest. Northwest Sci. 1995, 69, 318–329. [Google Scholar]
- Nakagawa, S.; Schielzeth, H.; O’Hara Robert, B. A general and simple method for obtaining R2 from generalized linear mixed-effects models. Methods Ecol. Evol. 2013, 4, 133–142. [Google Scholar] [CrossRef]
- Rodgers, V.L.; Smith, N.G.; Hoeppner, S.S.; Dukes, J.S. Warming increases the sensitivity of seedling growth capacity to rainfall in six temperate deciduous tree species. AoB PLANTS 2018, 10. [Google Scholar] [CrossRef] [PubMed]
- Friedrichs, D.A.; Trouet, V.; Büntgen, U.; Frank, D.C.; Esper, J.; Neuwirth, B.; Löffler, J. Species-specific climate sensitivity of tree growth in Central-West Germany. Trees 2009, 23, 729–739. [Google Scholar] [CrossRef]
- Rykiel, E.J. Testing ecological models: The meaning of validation. Ecol. Model. 1996, 90, 229–244. [Google Scholar] [CrossRef]
- Hussain, K.; Wongleecharoen, C.; Hilger, T.; Ahmad, A.; Kongkaew, T.; Cadisch, G. Modelling resource competition and its mitigation at the crop-soil-hedge interface using WaNuLCAS. Agrofor. Syst. 2016, 90, 1025–1044. [Google Scholar] [CrossRef]
- Kozlowski, T.T.; Winget, C.H. Diurnal and Seasonal Variation in Radii of Tree Stems. Ecology 1964, 45, 149–155. [Google Scholar] [CrossRef]
- Muthuri, C.W.; Ong, C.K.; Black, C.R.; Mati, B.M.; Ngumi, V.W.; van Noordwijk, M. Modelling the effects of leafing phenology on growth and water use by selected agroforestry tree species in semi-arid Kenya. Land Use Water Resour. Res. 2004, 4, 1–11. [Google Scholar]
- Ettinger, A.K.; Ford, K.R.; HilleRisLambers, J. Climate determines upper, but not lower, altitudinal range limits of Pacific Northwest conifers. Ecology 2011, 92, 1323–1331. [Google Scholar] [CrossRef] [PubMed]
- Weber, P.; Bugmann, H.; Rigling, A. Radial growth responses to drought of Pinus sylvestris and Quercus pubescens in an inner-Alpine dry valley. J. Veg. Sci. 2007, 18, 777–792. [Google Scholar] [CrossRef]
- Ministère de l’Environnement, de l’Habitat et de l’Urbanisme (MEHU). Deuxième Communication Nationale de la République du Bénin sur les Changements Climatiques; MEHU: Cotonou, Republic of Benin, 2011. [Google Scholar]
Figure 1.
Climate diagram (according to Walter and Lieth [50]) based on 1981–2016 data of Natitingou (10°19′ N and 1°23′ E; altitude 460 m a.s.l), Tanguieta (10°37′ N and 1°16′ E; altitude 225 m a.s.l) and Pouri (10°54′ N and 1°6′ E; altitude 175 m.a.s.l) meteorological stations in the Atacora region, northern Benin. Top of the graph shows the long-term mean annual temperature and rainfall. The value at the top-left of the temperature axis is the mean of the average daily maximum temperature of the hottest month; the value at the bottom of the same axis is the mean of the average daily minimum temperature of the coldest month. Area shaded in blue indicates the moist period and area shaded in red shows the arid period. Area filled in blue indicates the period of excess water.

Figure 2.
WaNuLCAS schematic presentation of the experimental plot layout, displaying its horizontal and vertical dimensions. Note: --//-- indicate “broken” y-axis.
Figure 2.
WaNuLCAS schematic presentation of the experimental plot layout, displaying its horizontal and vertical dimensions. Note: --//-- indicate “broken” y-axis.

Figure 3.
Relationships between simulated and observed values of height (m), stem diameter (cm) and aboveground biomass (kg m−2) for J. curcas and M. oleifera during calibration. The data from the fertilization treatment (F) were used. The lines are the 1:1 lines. EF: model efficiency; CD: coefficient of determination; RMSE: root mean square error; CRM: coefficient of residual mass; ME: maximum error; R2: coefficient of determination of linear regression between observed and simulated values.

Figure 4.
Variation in the predicted annual aboveground biomass (AGB, kg m−2) growth for J. curcas and M. oleifera. Apart from the years 1981 and 2016, every year was used twice in the simulation, either as year 1 (filled symbols) or year 2 (open symbols) year.
Figure 4.
Variation in the predicted annual aboveground biomass (AGB, kg m−2) growth for J. curcas and M. oleifera. Apart from the years 1981 and 2016, every year was used twice in the simulation, either as year 1 (filled symbols) or year 2 (open symbols) year.

Figure 5.
Simulated effects of rooting depth (Shallow vs. Deep) on aboveground biomass (AGB, kg m−2) under severe (1984–1985) and mild (2004–2005) water stress for (A) Jatropha curcas and (B) Moringa oleifera.
Figure 5.
Simulated effects of rooting depth (Shallow vs. Deep) on aboveground biomass (AGB, kg m−2) under severe (1984–1985) and mild (2004–2005) water stress for (A) Jatropha curcas and (B) Moringa oleifera.

Figure 6.
Water balance terms (mm) for two rooting depths (Shallow and Deep) under severe (1984–1985) and mild (2004–2005) water stress for (A) Jatropha curcas and (B) Moringa oleifera. Cumulative values over the two-year simulation period are presented.
Figure 6.
Water balance terms (mm) for two rooting depths (Shallow and Deep) under severe (1984–1985) and mild (2004–2005) water stress for (A) Jatropha curcas and (B) Moringa oleifera. Cumulative values over the two-year simulation period are presented.

Table 1.
Inputs of soil physical and chemical properties to parameterize the pedotransfer (PTF) module of WaNuLCAS.
Table 1.
Inputs of soil physical and chemical properties to parameterize the pedotransfer (PTF) module of WaNuLCAS.
| Parameter | Soil Layer (cm) | |||
|---|---|---|---|---|
| 0–5 | 5–16 | 16–30 | 30–50 | |
| Clay (%) | 11.8 | 15.7 | 25.5 | 29.4 |
| Silt (%) | 31.4 | 35.3 | 33.3 | 37.3 |
| Sand (%) | 56.9 | 49.0 | 41.2 | 33.3 |
| BD (g cm−3) | 1.5 | 1.5 | 1.6 | 1.6 |
| pH-H2O | 5.3 | 5.2 | 5.7 | 5.8 |
| TOC (%) | 0.7 | 0.6 | 0.6 | 0.6 |
| Ntot (%) | 0.1 | 0.1 | 0.1 | 0.1 |
| P (mg kg−1) | 15.7 | 15.3 | 14.5 | 14.8 |
| CEC (cmol kg−1) | 4.7 | 6.0 | 5.2 | 5.3 |
| Ksat (cm d−1) | 73.2 | 18.4 | 207.7 | 232.4 |
Legend: BD: bulk density, TOC: total organic carbon, Ntot: total nitrogen, P: available phosphorus, CEC: cation exchange capacity, Ksat: saturated hydraulic conductivity. The data was obtained following a soil profile description conducted at the experimental site at the beginning of the trial in June 2014.
Table 2.
Allometric intercepts (a) and slopes (b) of the biomass components [26] used to simulate the tree growth by WaNuLCAS.
Table 2.
Allometric intercepts (a) and slopes (b) of the biomass components [26] used to simulate the tree growth by WaNuLCAS.
| Species | Biomass Fractions | a | b |
|---|---|---|---|
| Jatropha curcas | Total | 0.004 | 2.93 |
| Stem | 0.004 | 2.74 | |
| Leaf + Twig | 0.003 | 2.48 | |
| Litterfall * | 0.0002 | 3.29 | |
| Moringa oleifera | Total | 0.010 | 2.36 |
| Stem | 0.008 | 2.38 | |
| Leaf + Twig | 0.010 | 1.49 | |
| Litterfall * | 0.0002 | 3.29 |
* The model default values were used for litterfall allometric parameters.
Table 3.
Climate indicators considered in the climate sensitivity analysis. The overall (1981–2016) value range of the climate indicators, and the value of the climate variable for the current climate (2014 and 2015) are presented along with their rank.
Table 3.
Climate indicators considered in the climate sensitivity analysis. The overall (1981–2016) value range of the climate indicators, and the value of the climate variable for the current climate (2014 and 2015) are presented along with their rank.
| Parameters | Unit | Description | Definition | Range | 2014 | Rank ** | 2015 | Rank ** |
|---|---|---|---|---|---|---|---|---|
| AWD | mm | Annual water deficit | Difference between annual potential evapotranspiration (ET0) and precipitation | 155–1153 | 931 | 29/36 | 978 | 31/36 |
| LDSP | Days | Length of the longest dry spell | Maximum number of consecutive days of no precipitation within the rainy season (April–October; Figure 1) | 3–40 | 24 | 32/36 | 19 | 29/36 |
| LEDP * | Days | Length of extremely dry period | Number of days within a year when daily maximum temperature >99th percentile (40° C) and no precipitation (Zhang et al. 2011) | 0–42 | 8 | 30/36 | 42 | 36/36 |
| LDS | Months | Length of dry season | Number of consecutive months within a year with less than 100 mm of rainfall (Wood et al. 2001) | 5–10 | 10 | 36/36 | 9 | 35/36 |
| LWS | Day | Length of the longest wet spell | Maximum number of consecutive rainy days within the rainy season (April–October; see Figure 1) | 2–21 | 10 | 30/36 | 21 | 36/36 |
| ATWP | mm | Annual total wet-day precipitation | Annual total precipitation from wet days (i.e., days with precipitation ≥1 mm) (Zhang et al. 2011) | 670–1501 | 749 | 3/36 | 825 | 5/36 |
| R95p * | mm | Very wet days | Annual total precipitation from days with precipitation >95th percentile (19 mm) (Zhang et al. 2011) | 344–1096 | 395 | 4/36 | 424 | 7/36 |
| R95pot | - | Total precipitation with respect to the R95p | Fraction of precipitation accounted for by the very wet days (R95p) (Zhang et al. 2011) | 0.42–0.80 | 0.52 | 10/36 | 0.51 | 7/36 |
* The 95th and 99th percentiles of precipitation and temperature were identified from the historical (1981–2016) climate data. ** The ranking was done with regard to the 36 (i.e., 1981–2016) observations.
Table 4.
Results of the model validation for two tree species based on the datasets from the control (C), irrigation (I), and irrigation + fertilization (IF) treatments based on the GOF criteria (Loague and Green [59]). Values in brackets represent the optimum value of the criteria. Values close to the optimum value of each criterion are indicated in bold.
| Species | Growth Parameters | EF (1) | CD (1) | RMSE (0) | CRM (0) | ME (0) | R2 (1) |
|---|---|---|---|---|---|---|---|
| Jatropha curcas | Height (H, m) | 0.72 | 0.71 | 6.02 | 0.00 | 0.16 | 0.80 |
| Diameter (D, cm) | 0.72 | 2.48 | 11.12 | −0.03 | 1.17 | 0.81 | |
| Aboveground biomass (AGB, kg m−2) | 0.77 | 2.21 | 33.78 | −0.04 | 0.19 | 0.83 | |
| Moringa oleifera | Height (H, m) | 0.82 | 2.59 | 9.42 | −0.03 | 0.40 | 0.97 |
| Diameter (D, cm) | 0.70 | 1.76 | 12.94 | −0.08 | 1.32 | 0.88 | |
| Aboveground biomass (AGB, kg m−2) | 0.78 | 2.23 | 28.55 | −0.09 | 0.13 | 0.88 |
EF: model efficiency; CD: coefficient of determination; RMSE: root mean square error; CRM: coefficient of residual mass; ME: maximum error; R2: coefficient of determination of linear regression between observed and simulated values.
Table 5.
Mixed effect models comparisons for J. curcas and M. oleifera, showing the most important climate indicators along with the corresponding climate sensitivity indices.
Table 5.
Mixed effect models comparisons for J. curcas and M. oleifera, showing the most important climate indicators along with the corresponding climate sensitivity indices.
| Variables | Jatropha curcas | Moringa oleifera | ||||
|---|---|---|---|---|---|---|
| ΔAICc | Slope | R² | ΔAICc | Slope | R² | |
| LDSP1 | 12.22 | −0.63 | 0.39 | 9.33 | −0.58 | 0.33 |
| LDSP2 | 9.91 | −0.59 | 0.35 | 8.31 | −0.57 | 0.31 |
| LDS1 | 2.27 | −0.43 | 0.18 | 2.16 | −0.42 | 0.18 |
| LDS2 | 12.16 | −0.63 | 0.39 | 9.13 | −0.58 | 0.33 |
| AWD1 | 6.02 | −0.53 | 0.27 | 5.05 | −0.5 | 0.24 |
| AWD2 | 14.92 | −0.67 | 0.44 | 11.98 | −0.63 | 0.38 |
| ATWP1 | 3.60 | 0.46 | 0.21 | 2.96 | 0.45 | 0.20 |
| ATWP2 | 10.44 | 0.60 | 0.36 | 8.32 | 0.57 | 0.31 |
Note: ΔAICc is the corrected Akaike Information Criterion; R² is the pseudo coefficient of determination. Description of the climate variables is provided in Table 2. Subscripts accompanying the climate variables stand for year one (1) and year two (2).
© 2018 by the authors. Licensee MDPI, Basel, Switzerland. This article is an open access article distributed under the terms and conditions of the Creative Commons Attribution (CC BY) license (http://creativecommons.org/licenses/by/4.0/).
Share and Cite
MDPI and ACS Style
Noulèkoun, F.; Khamzina, A.; Naab, J.B.; Khasanah, N.; Van Noordwijk, M.; Lamers, J.P.A. Climate Change Sensitivity of Multi-Species Afforestation in Semi-Arid Benin. Sustainability 2018, 10, 1931. https://doi.org/10.3390/su10061931
AMA Style
Noulèkoun F, Khamzina A, Naab JB, Khasanah N, Van Noordwijk M, Lamers JPA. Climate Change Sensitivity of Multi-Species Afforestation in Semi-Arid Benin. Sustainability. 2018; 10(6):1931. https://doi.org/10.3390/su10061931
Chicago/Turabian StyleNoulèkoun, Florent, Asia Khamzina, Jesse B. Naab, Ni’matul Khasanah, Meine Van Noordwijk, and John P. A. Lamers. 2018. "Climate Change Sensitivity of Multi-Species Afforestation in Semi-Arid Benin" Sustainability 10, no. 6: 1931. https://doi.org/10.3390/su10061931
Note that from the first issue of 2016, this journal uses article numbers instead of page numbers. See further details here.