Calcium Imaging of GPCR Activation Using Arrays of Reverse Transfected HEK293 Cells in a Microfluidic System

 , , , and
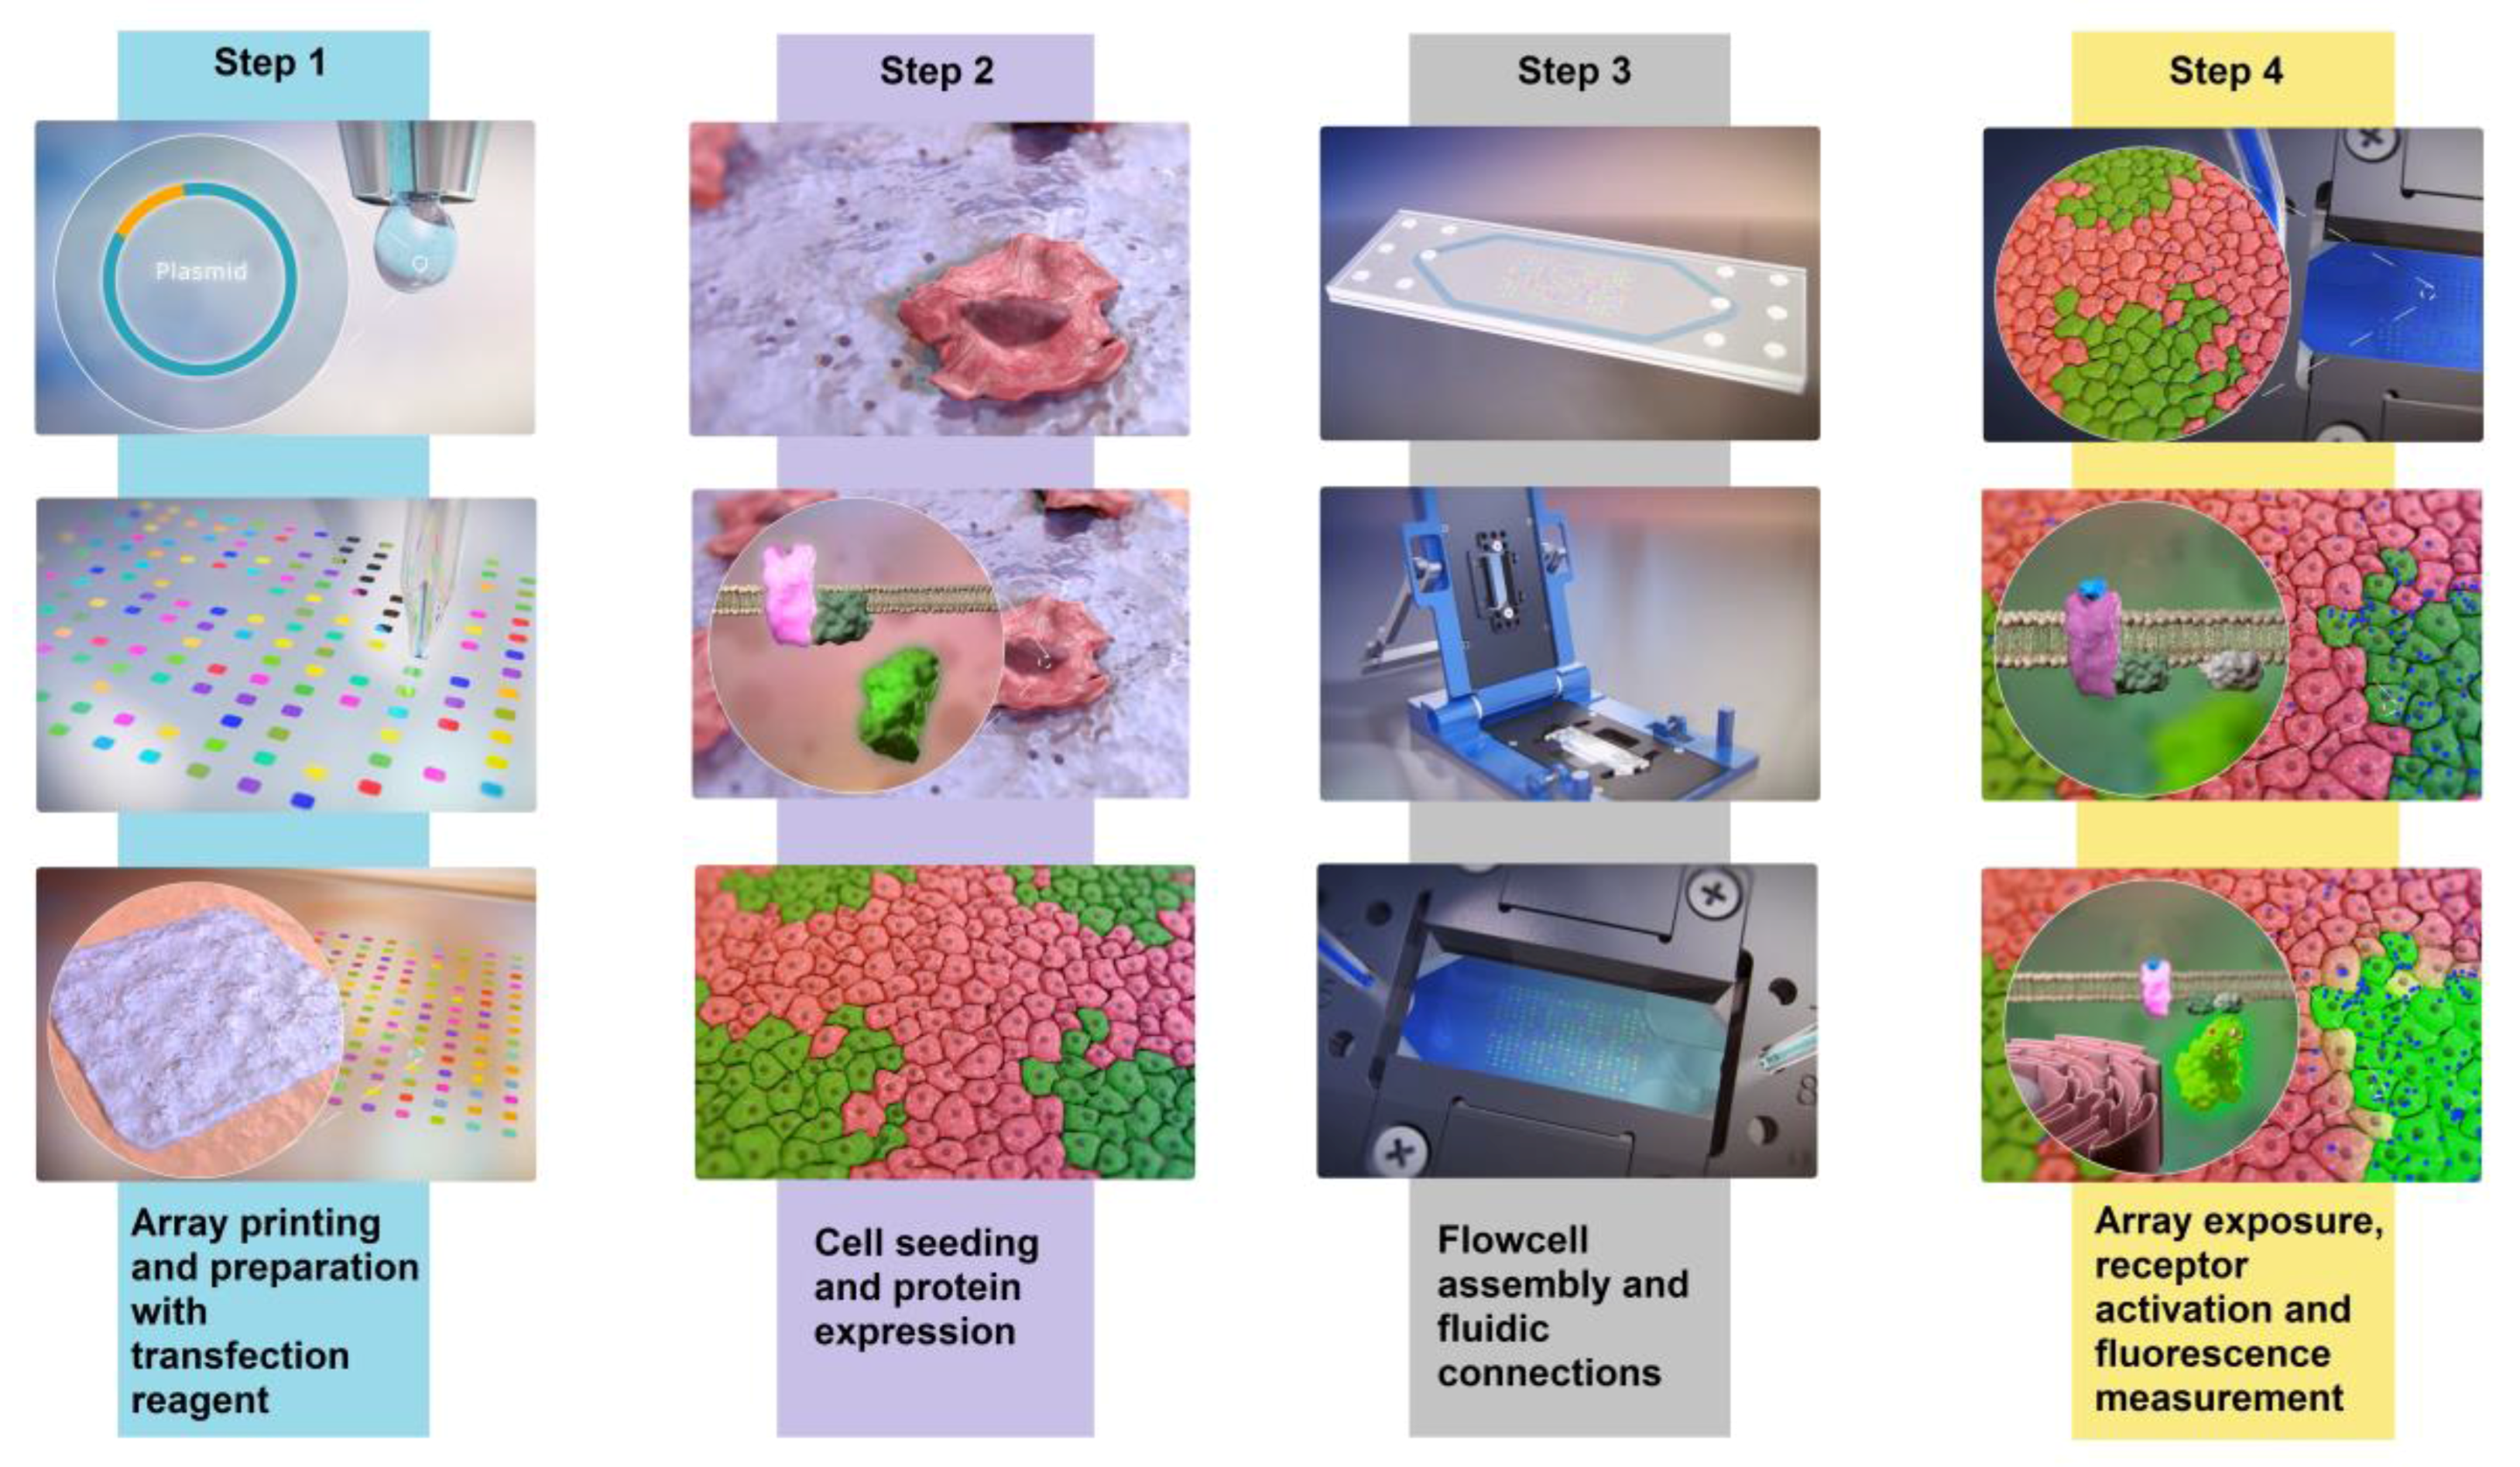
Abstract
:1. Introduction
2. Materials and Methods
2.1. Expression Vectors
2.2. Cleaning and Printing of DNA Arrays
2.3. Cell Culture and Reverse Transfection
2.4. Flowcell and Array Imaging Setup
2.5. Live Imaging of Reverse Transfection Time Course
2.6. Data Analysis of Fluorescent Protein Expression
2.7. Data Analysis of Calcium Responses
3. Results
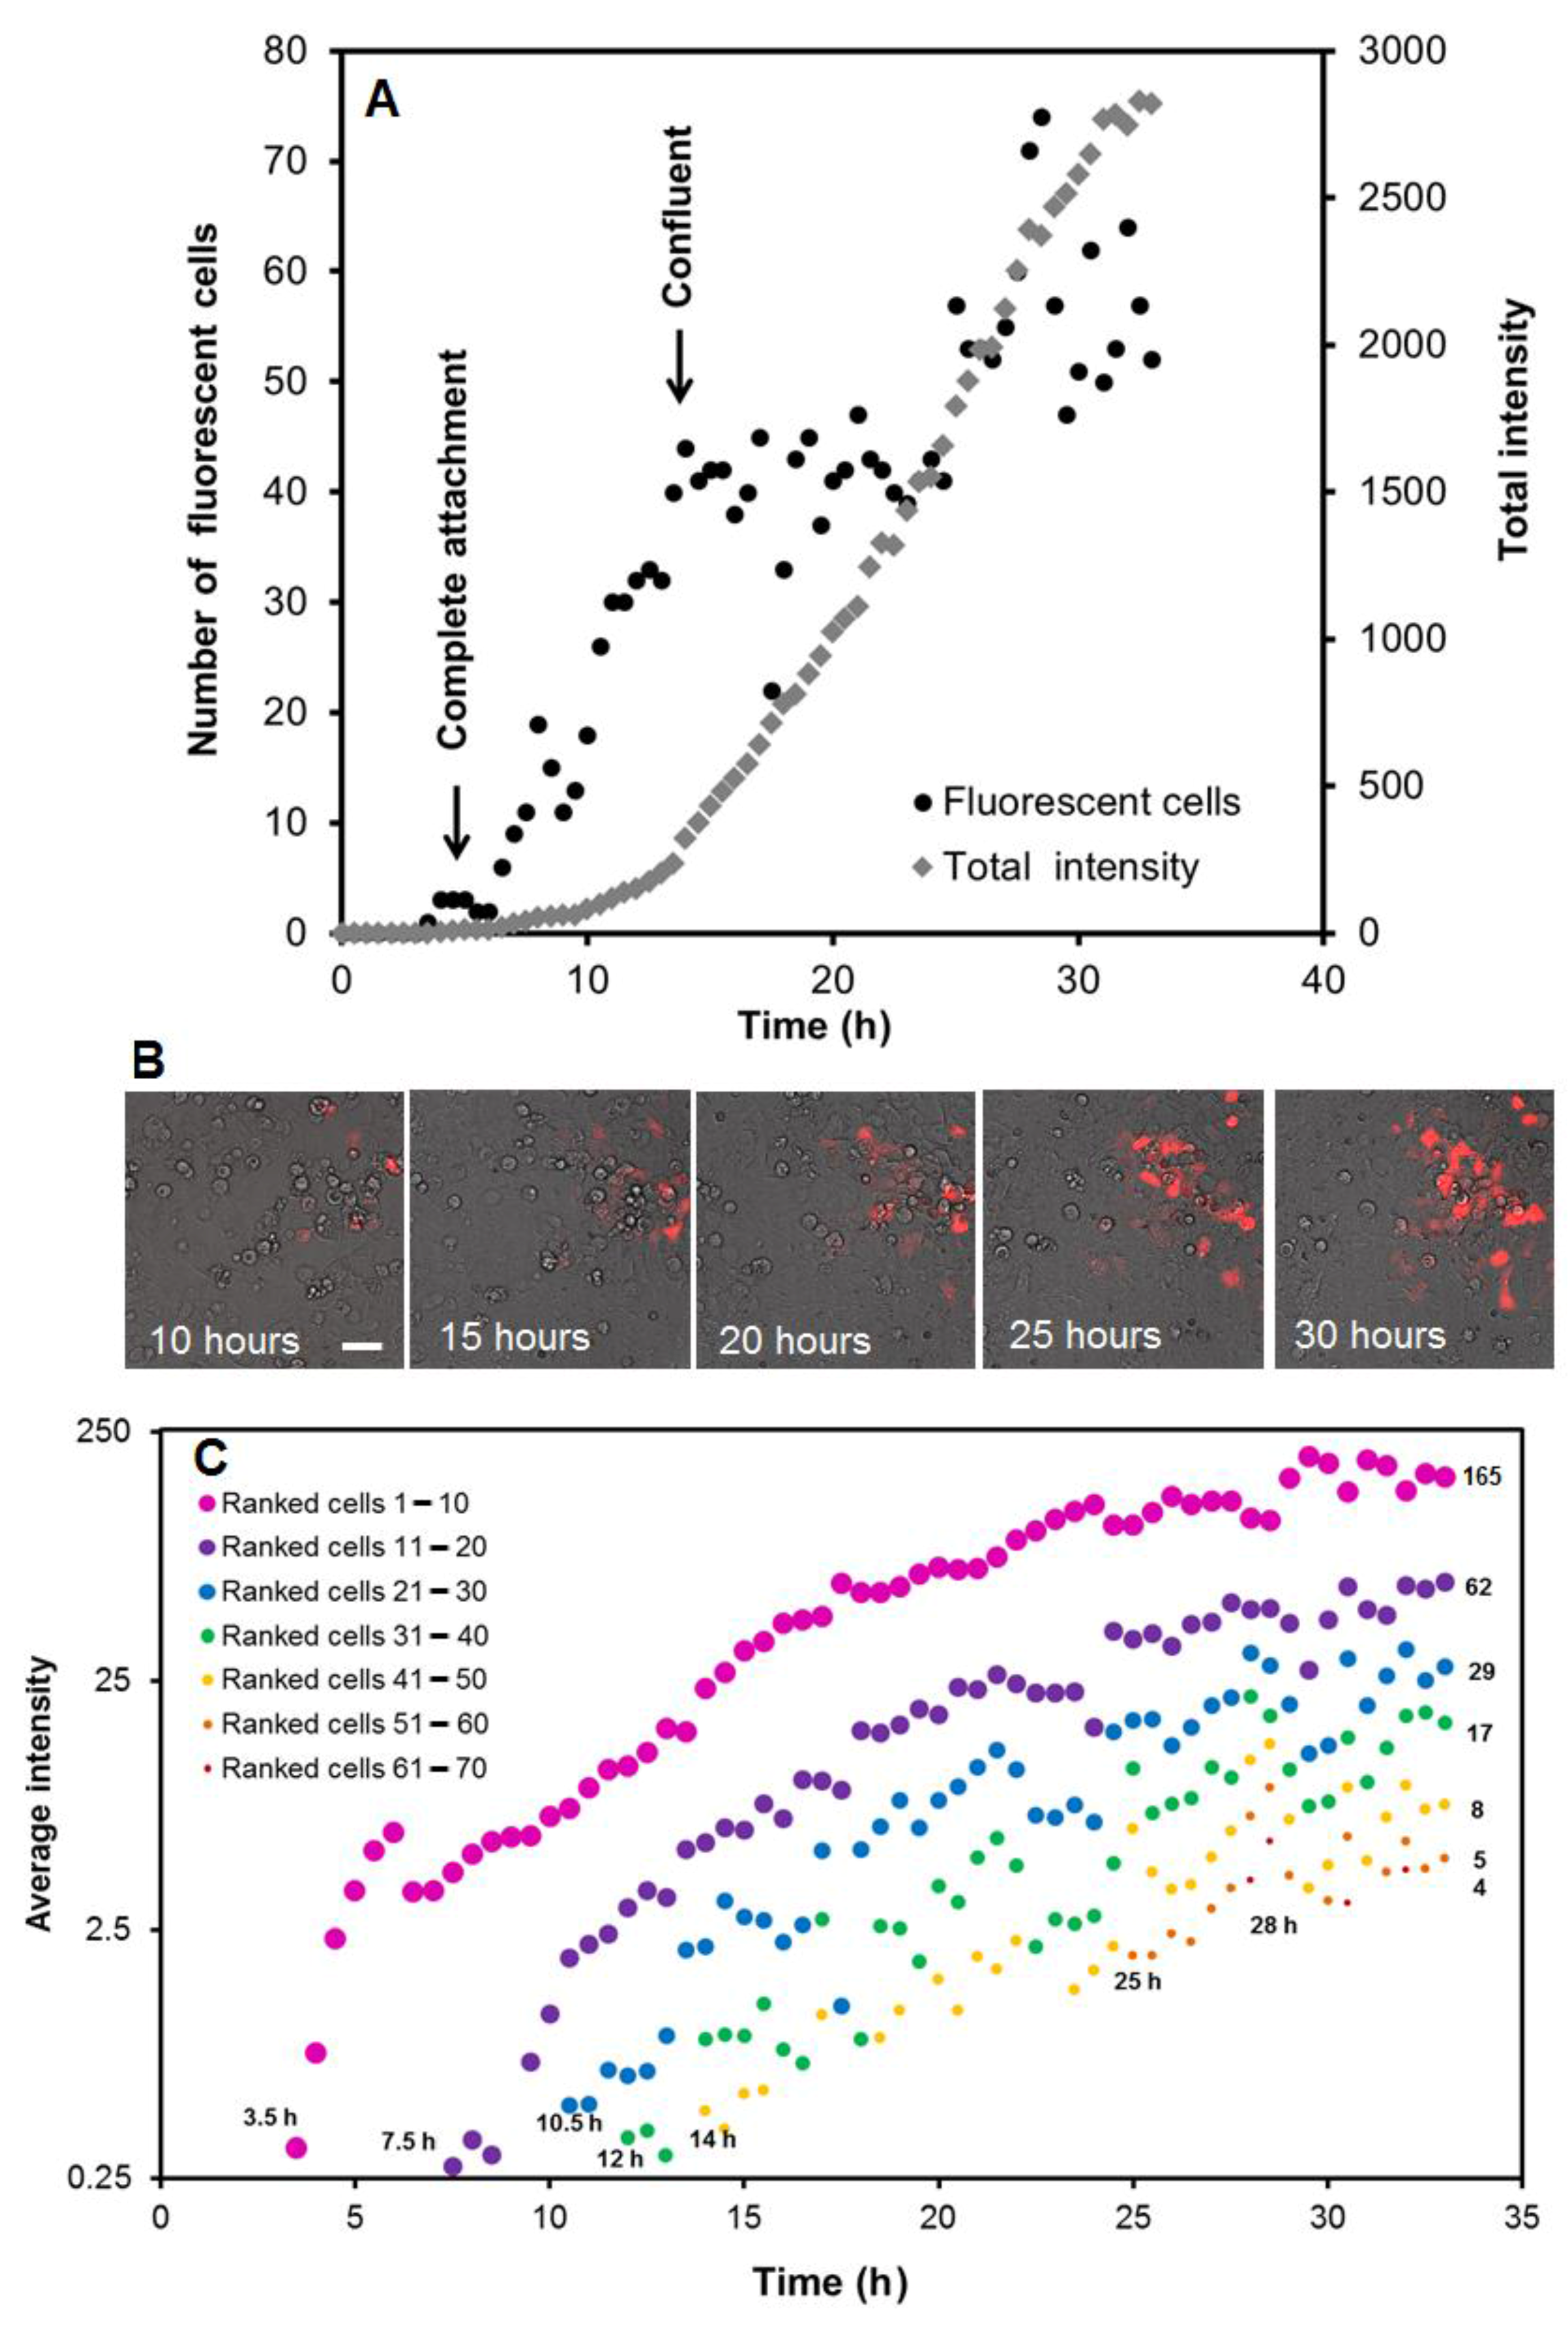
3.1. Time Course of Protein Expression after Reverse Transfection at the Cell and Spot Level
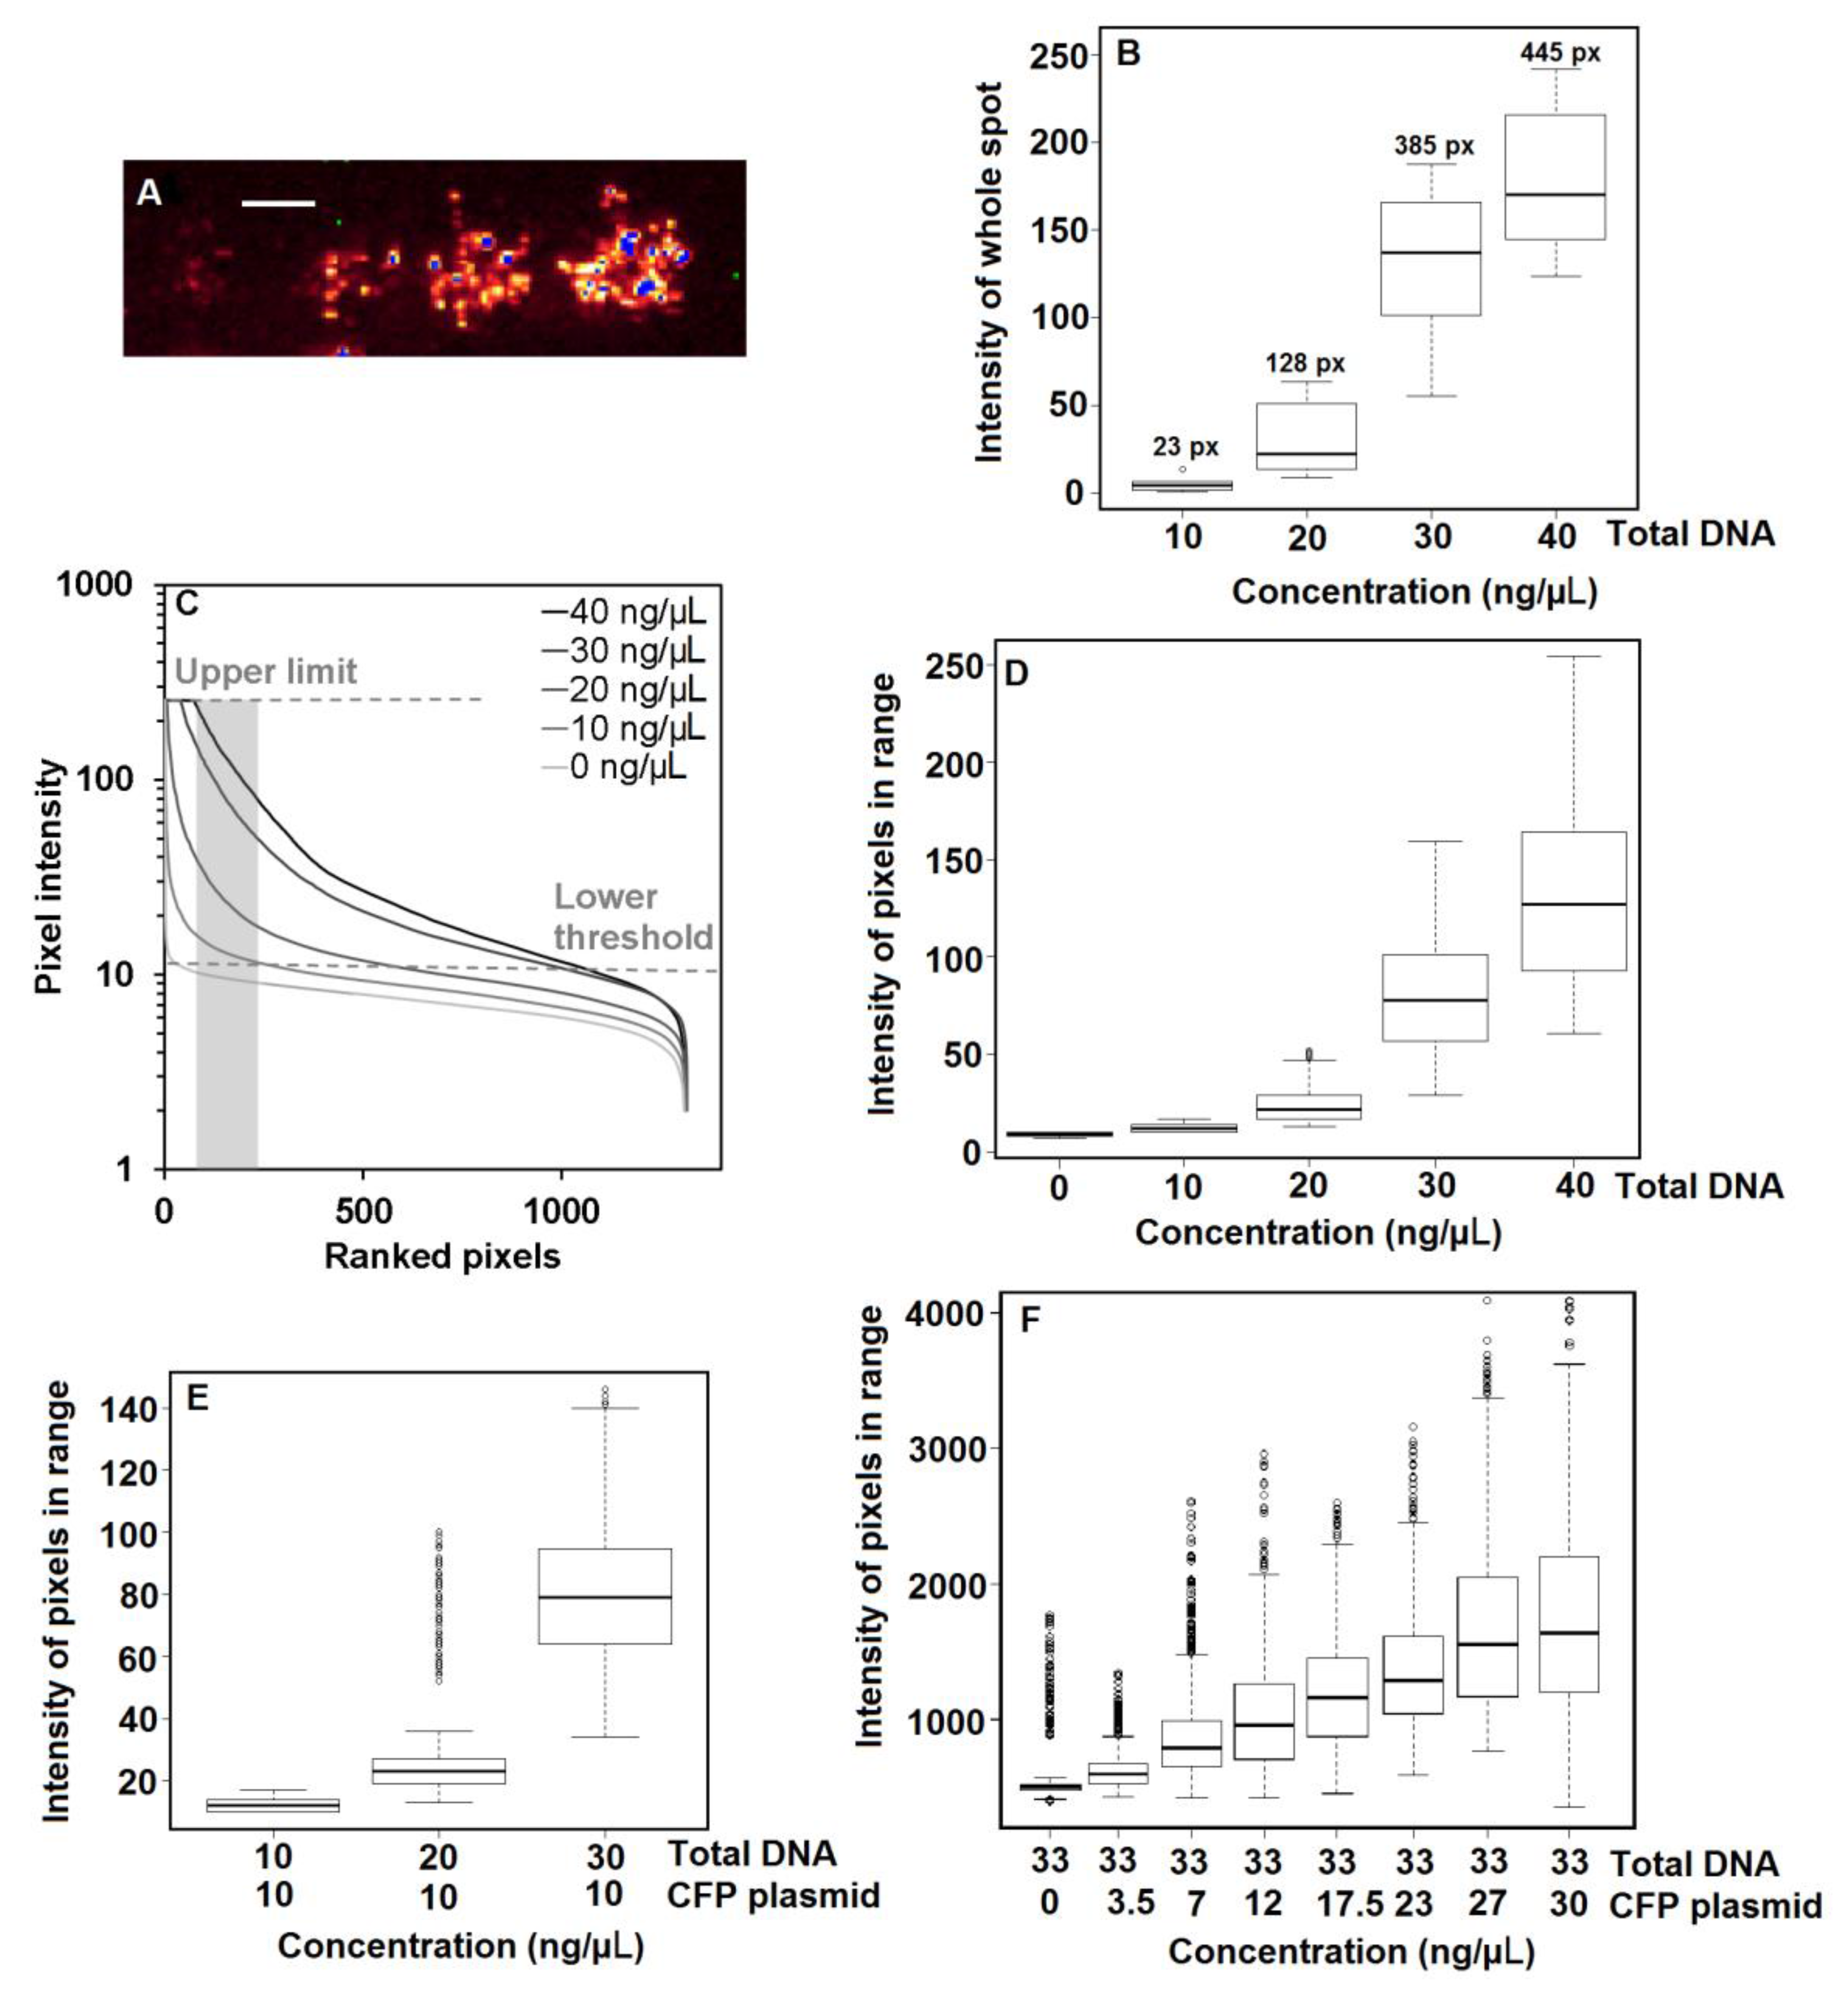
3.2. Effect of DNA Concentration on Protein Expression
3.3. Effect of Co-Transfection on Protein Expression
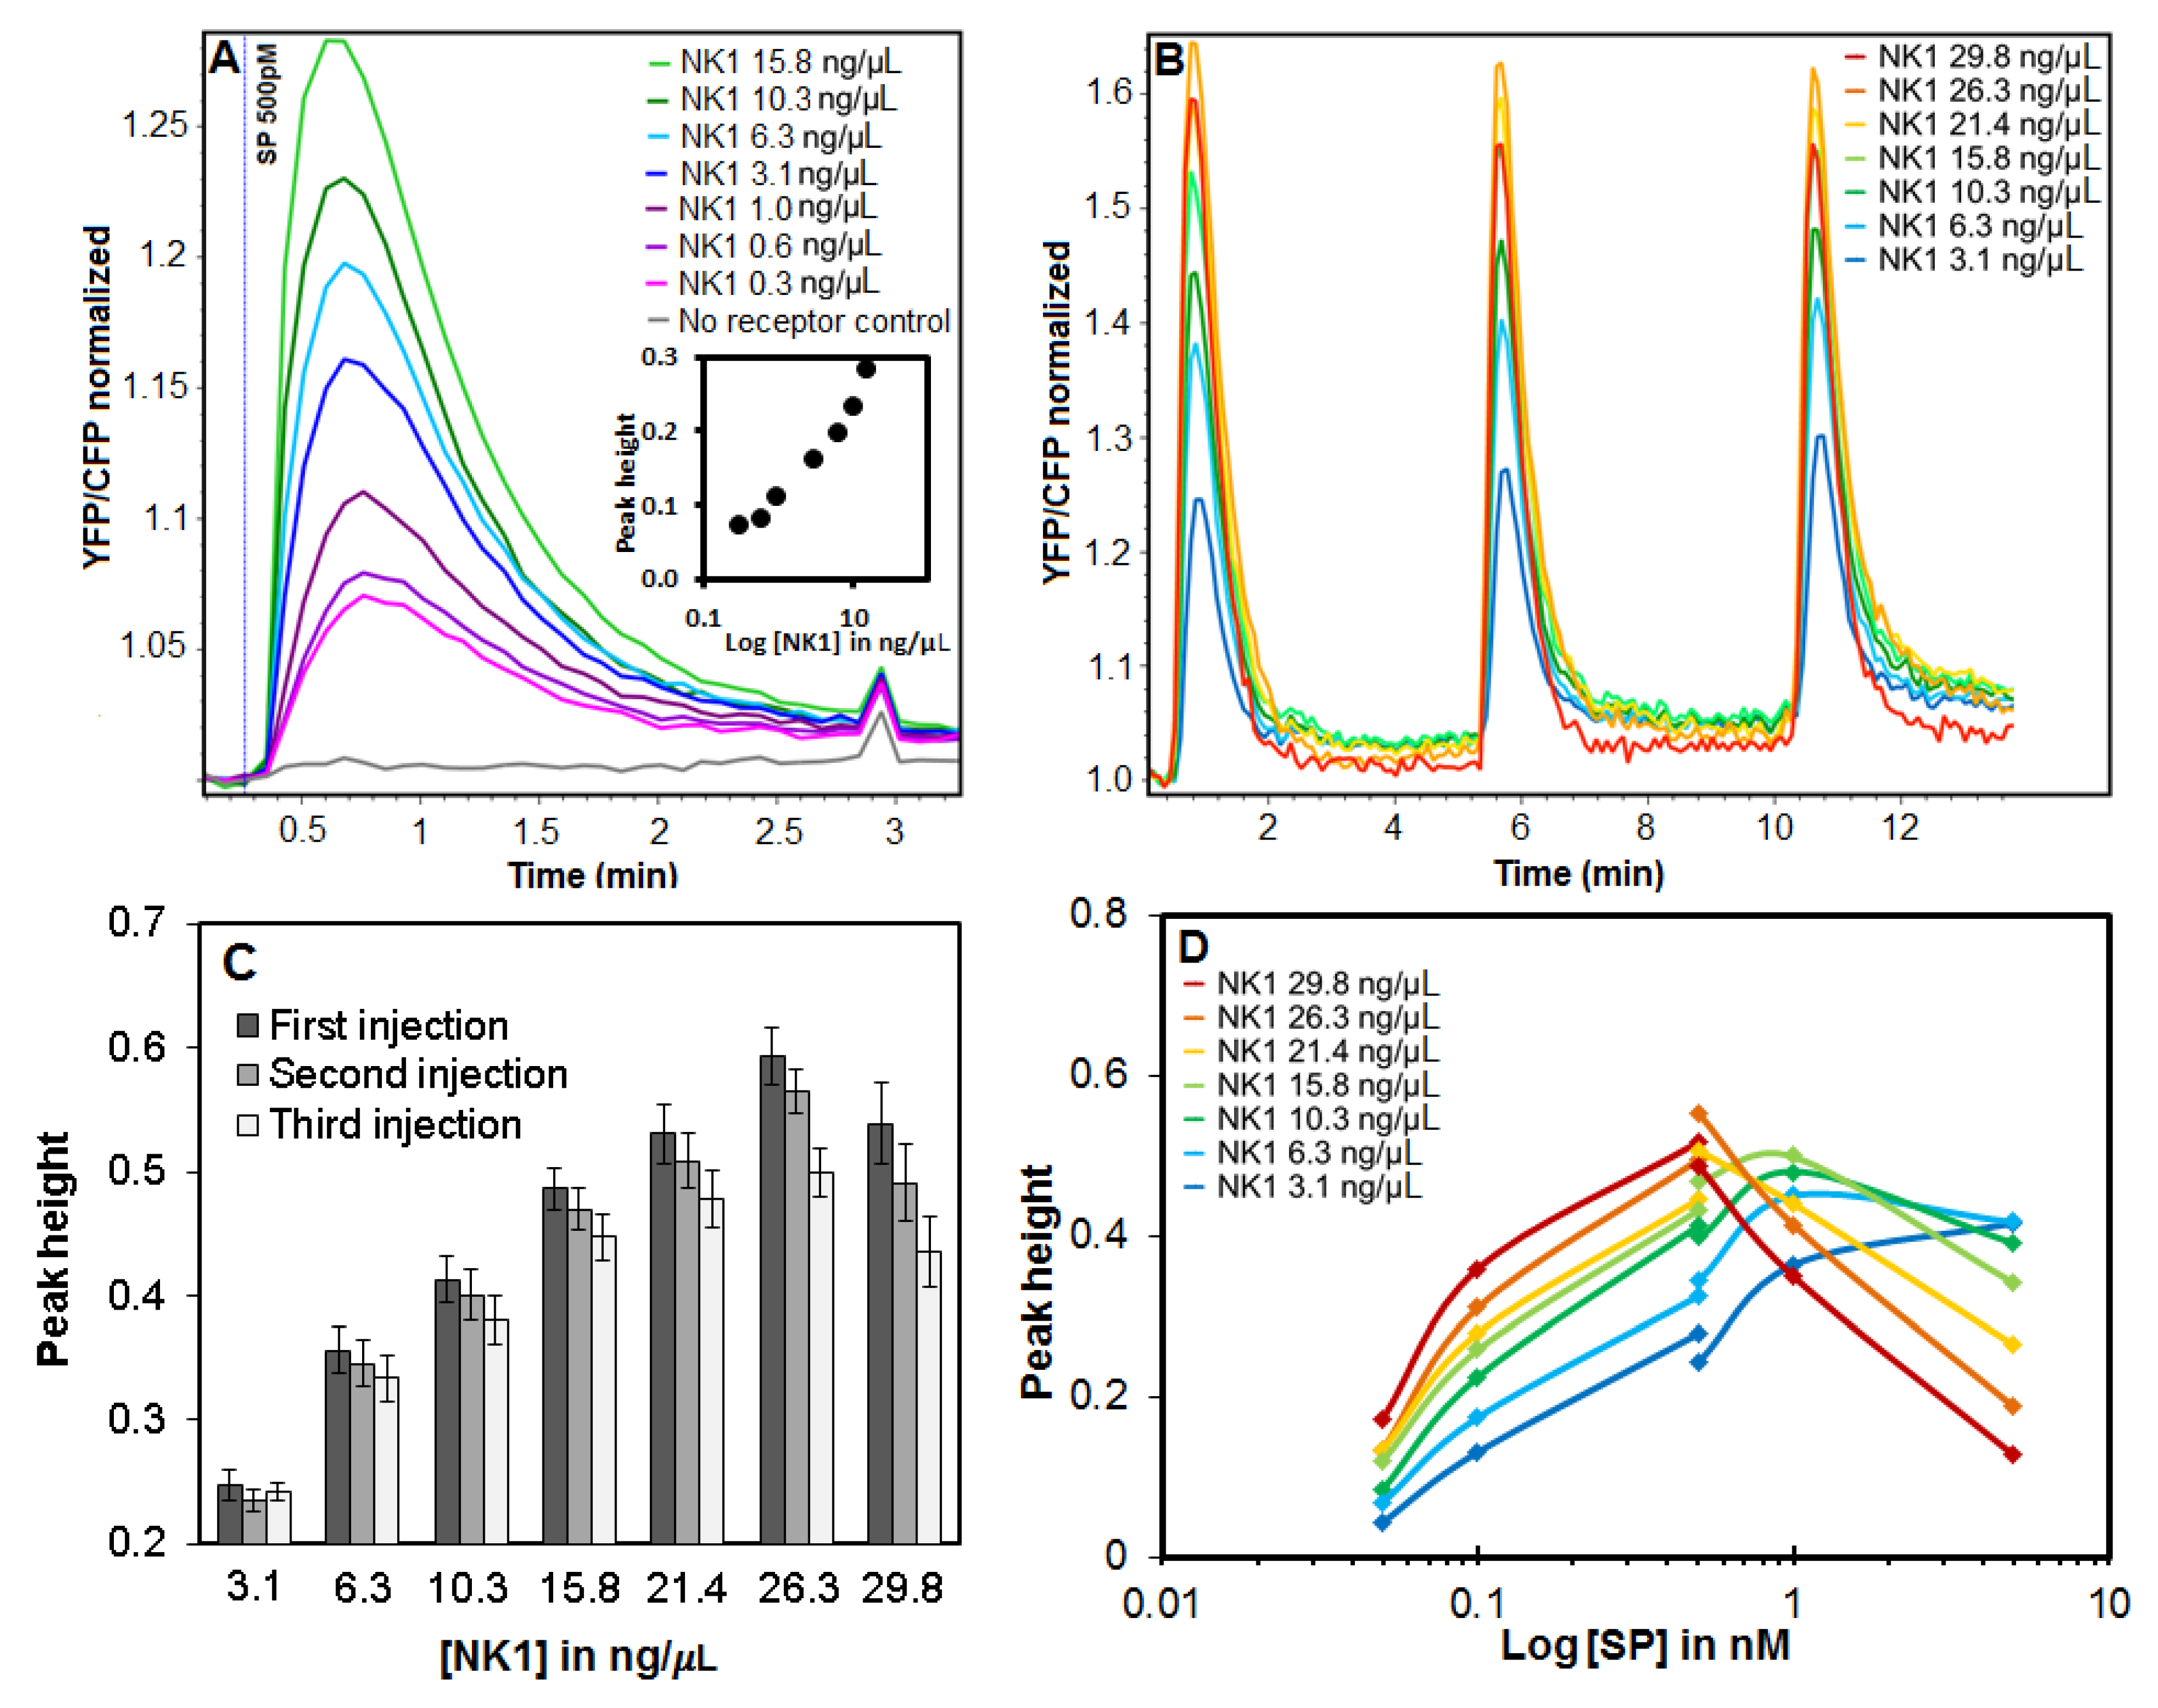
3.4. Effect of DNA Concentration on NK1 Receptor Calcium Signaling
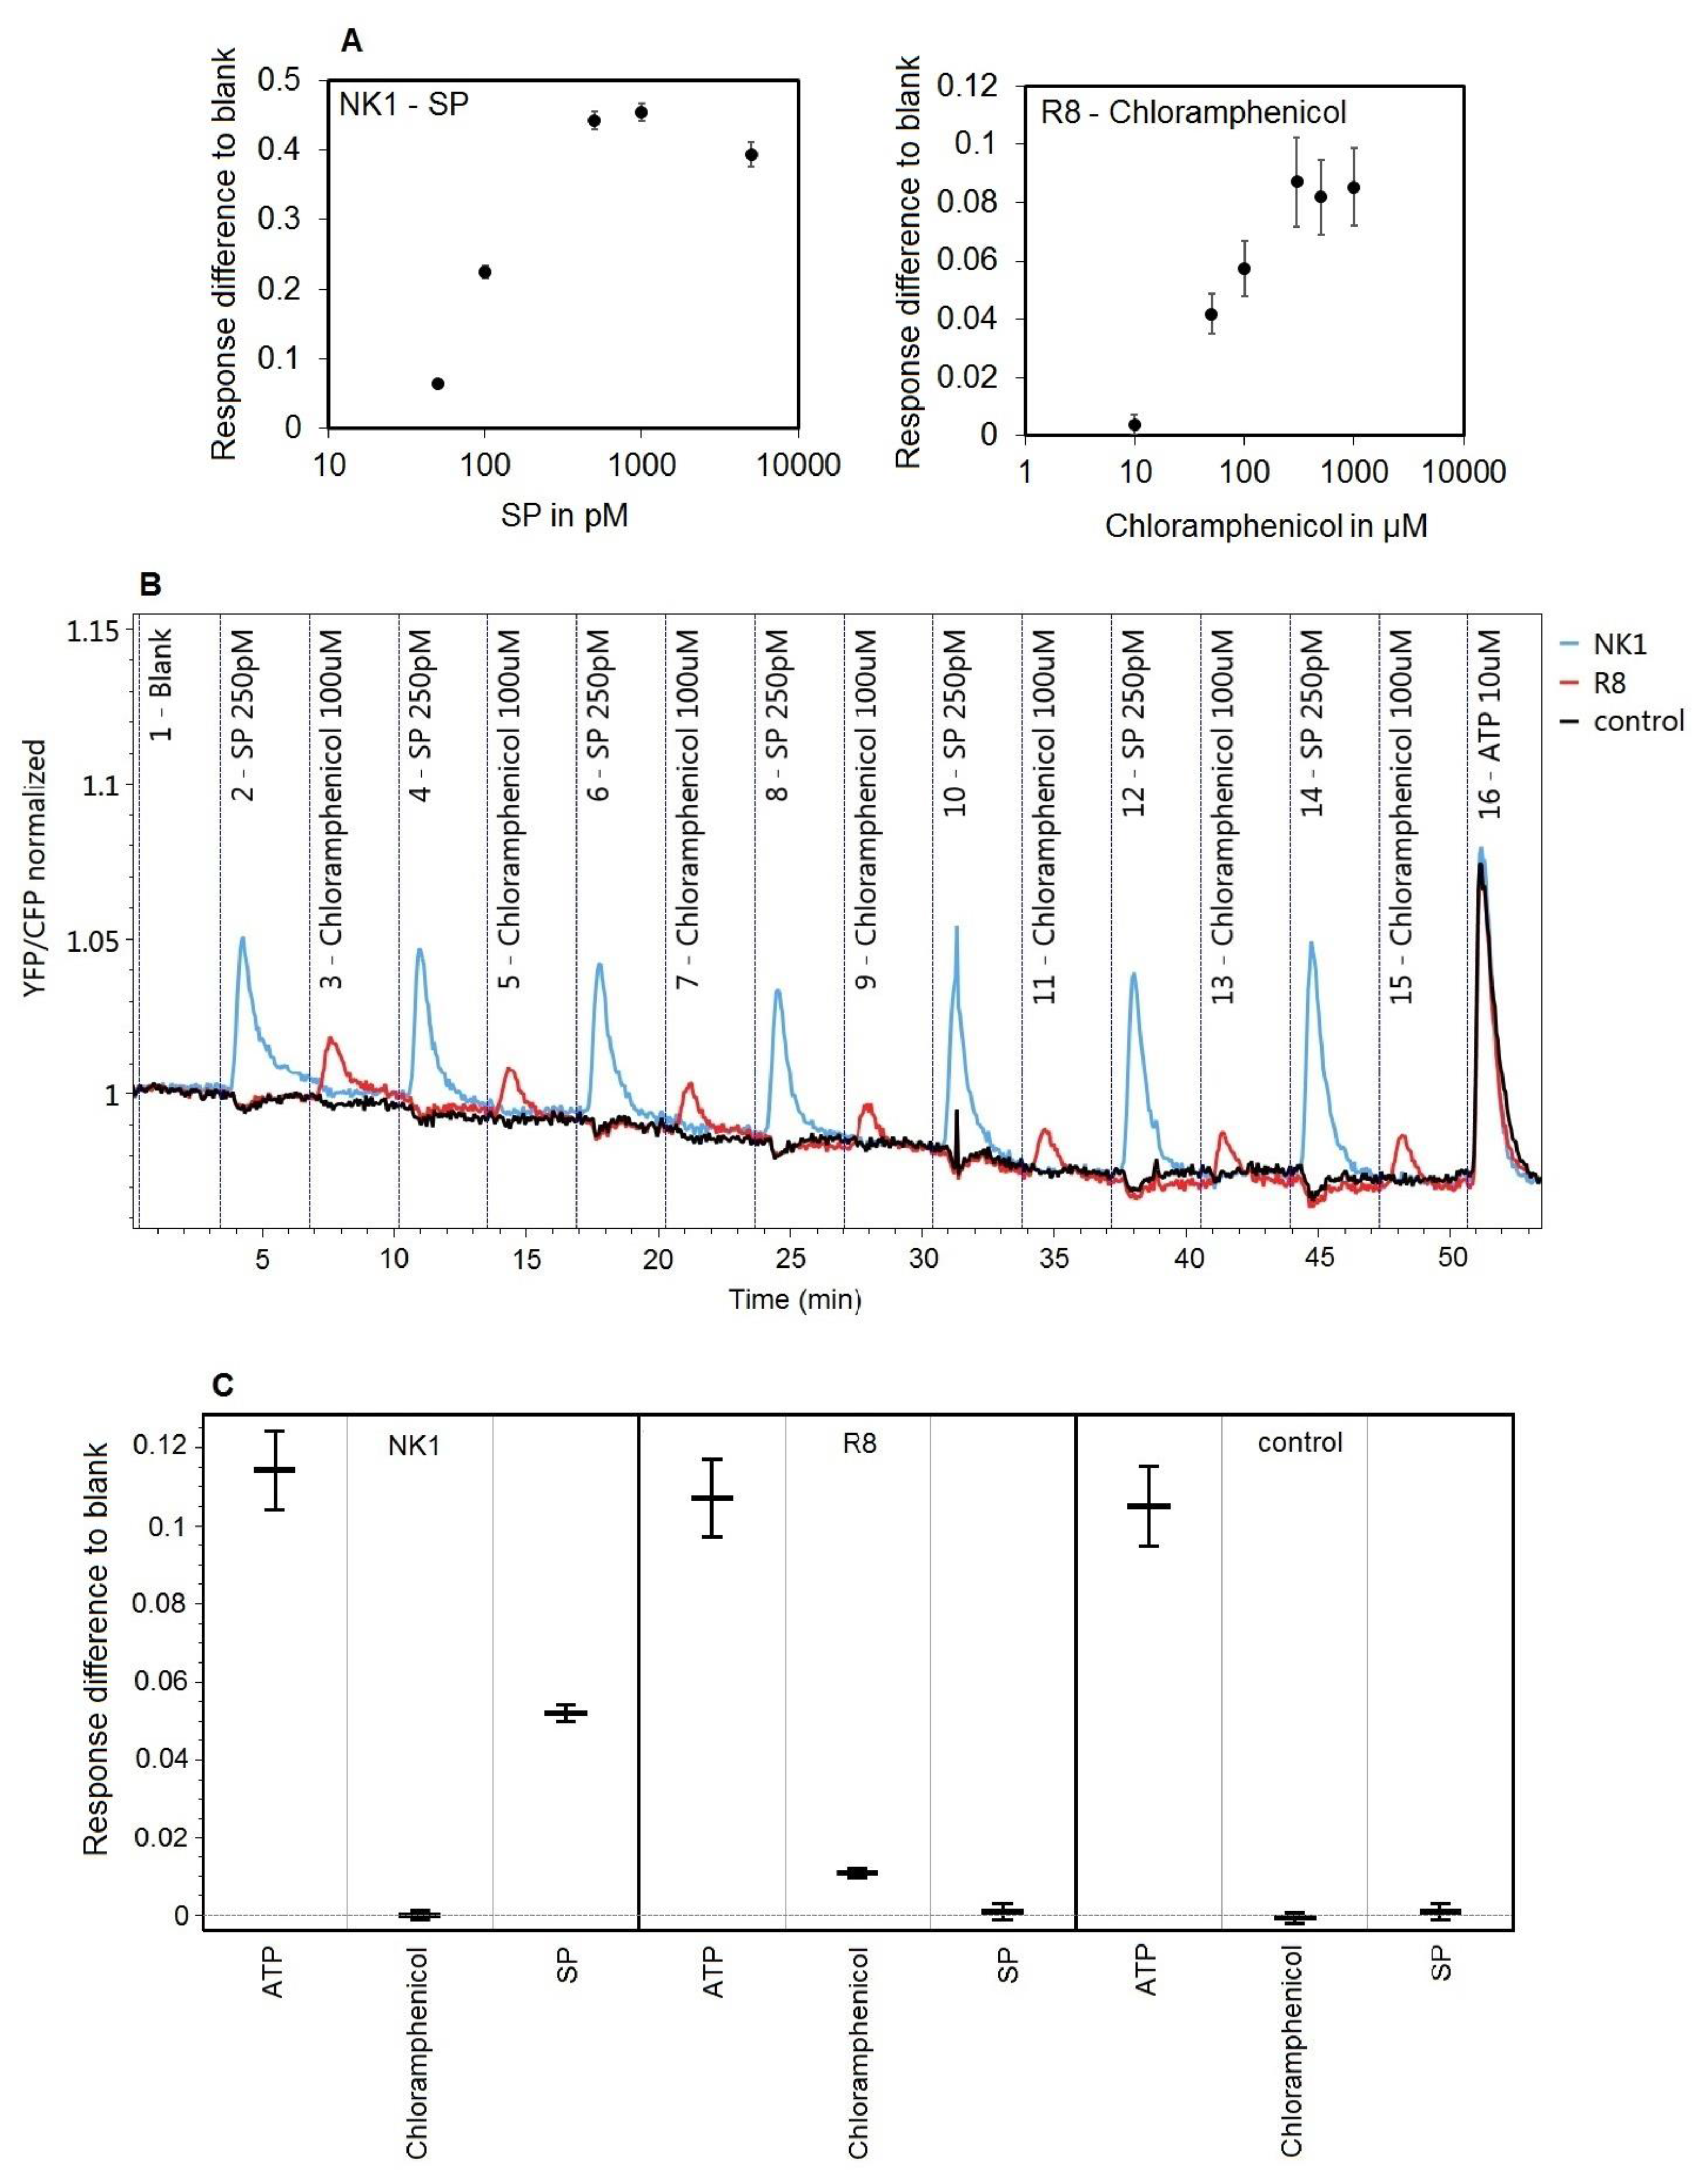
3.5. Specific Receptor Responses to Repeated Challenges
4. Discussion
5. Conclusions
Supplementary Materials
Acknowledgments
Author Contributions
Conflicts of Interest
References
- Ziauddin, J.; Sabatini, D.M. Microarrays of cells expressing defined cDNAs. Nature 2001, 411, 107–110. [Google Scholar] [CrossRef] [PubMed]
- Bailey, S.N.; Sabatini, D.M.; Stockwell, B.R. Microarrays of small molecules embedded in biodegradable polymers for use in mammalian cell-based screens. Proc. Natl. Acad. Sci. USA 2004, 101, 16144–16149. [Google Scholar] [CrossRef] [PubMed]
- Bailey, S.N.; Ali, S.M.; Carpenter, A.E.; Higgins, C.O.; Sabatini, D.M. Microarrays of lentiviruses for gene function screens in immortalized and primary cells. Nat. Methods 2006, 3, 117–122. [Google Scholar] [CrossRef] [PubMed]
- Rajan, S.; Djambazian, H.; Dang, H.C.; Sladek, R.; Hudson, T.J. The living microarray: A high-throughput platform for measuring transcription dynamics in single cells. BMC Genom. 2011, 12, 115. [Google Scholar] [CrossRef] [PubMed]
- Tian, J.; Alimperti, S.; Lei, P.; Andreadis, S.T. Lentiviral microarrays for real-time monitoring of gene expression dynamics. Lab Chip 2010, 10, 1967–1975. [Google Scholar] [CrossRef] [PubMed]
- Onuki-Nagasaki, R.; Nagasaki, A.; Hakamada, K.; Uyeda, T.Q.; Fujita, S.; Miyake, M.; Miyake, J. On-chip screening method for cell migration genes based on a transfection microarray. Lab Chip 2008, 8, 1502–1506. [Google Scholar] [CrossRef] [PubMed]
- Fujita, S.; Onuki-Nagasaki, R.; Ikuta, K.; Hara, Y. A simple method for producing multiple copies of controlled release small molecule microarrays for cell-based screening. Biofabrication 2016, 9, 011001. [Google Scholar] [CrossRef] [PubMed]
- Niidome, T.; Yakumaru, K.; Shiotani, A.; Yamashita, S.; Katayama, Y. Gene Transfer into Cells from Solid Surfaces and Its Application to In Vivo Systems. Chem. Lett. 2009, 38, 36–37. [Google Scholar] [CrossRef]
- Miyake, M.; Yoshikawa, T.; Fujita, S.; Miyake, J. Transfection microarray and the applications. Mol. Biosyst. 2009, 5, 444–449. [Google Scholar] [CrossRef] [PubMed]
- Kneuer, C.; Ehrhardt, C.; Bakowsky, H.; Kumar, M.N.; Oberle, V.; Lehr, C.M.; Hoekstra, D.; Bakowsky, U. The influence of physicochemical parameters on the efficacy of non-viral DNA transfection complexes: A comparative study. J. Nanosci. Nanotechnol. 2006, 6, 2776–2782. [Google Scholar] [CrossRef] [PubMed]
- Bengali, Z.; Rea, J.C.; Gibly, R.F.; Shea, L.D. Efficacy of immobilized polyplexes and lipoplexes for substrate-mediated gene delivery. Biotechnol. Bioeng. 2009, 102, 1679–1691. [Google Scholar] [CrossRef] [PubMed]
- Felgner, P.L.; Gadek, T.R.; Holm, M.; Roman, R.; Chan, H.W.; Wenz, M.; Northrop, J.P.; Ringold, G.M.; Danielsen, M. Lipofection: A highly efficient, lipid-mediated DNA-transfection procedure. Proc. Natl. Acad. Sci. USA 1987, 84, 7413–7417. [Google Scholar] [CrossRef] [PubMed]
- Brunner, S.; Sauer, T.; Carotta, S.; Cotten, M.; Saltik, M.; Wagner, E. Cell cycle dependence of gene transfer by lipoplex, polyplex and recombinant adenovirus. Gene Ther. 2000, 7, 401–407. [Google Scholar] [CrossRef] [PubMed]
- Lechardeur, D.; Sohn, K.J.; Haardt, M.; Joshi, P.B.; Monck, M.; Graham, R.W.; Beatty, B.; Squire, J.; O'Brodovich, H.; Lukacs, G.L. Metabolic instability of plasmid DNA in the cytosol: A potential barrier to gene transfer. Gene Ther. 1999, 6, 482–497. [Google Scholar] [CrossRef] [PubMed]
- Cohen, R.N.; van der Aa, M.A.; Macaraeg, N.; Lee, A.P.; Szoka, F.C., Jr. Quantification of plasmid DNA copies in the nucleus after lipoplex and polyplex transfection. J. Controll. Release Off. J. Controll. Release Soc. 2009, 135, 166–174. [Google Scholar] [CrossRef] [PubMed]
- Fliedl, L.; Kast, F.; Grillari, J.; Wieser, M.; Grillari-Voglauer, R. Optimization of a quantitative PCR based method for plasmid copy number determination in human cell lines. New Biotechnol. 2015, 32, 716–719. [Google Scholar] [CrossRef] [PubMed]
- Soni, M.; Lai, F. Cell-based co-transfection microarrays for use with HEK293T cells on a poly D-lysine-coated polystyrene microplate. Methods Mol. Biol. 2011, 706, 13–25. [Google Scholar] [PubMed]
- De La Vega, J.; Braak, B.T.; Azzoni, A.R.; Monteiro, G.A.; Prazeres, D.M. Impact of plasmid quality on lipoplex-mediated transfection. J. Pharm. Sci. 2013, 102, 3932–3941. [Google Scholar] [CrossRef] [PubMed]
- Woodruff, K.; Maerkl, S.J. A High-Throughput Microfluidic Platform for Mammalian Cell Transfection and Culturing. Sci. Rep. 2016, 6, 23937. [Google Scholar] [CrossRef] [PubMed]
- Enomoto, J.; Takagi, R.; Onuki-Nagasaki, R.; Fujita, S.; Fukuda, J. Reverse transfection in microchamber arrays for cell migration assays. Sens. Actuat B Chem. 2014, 190, 896–899. [Google Scholar] [CrossRef]
- Jain, T.; McBride, R.; Head, S.; Saez, E. Highly parallel introduction of nucleic acids into mammalian cells grown in microwell arrays. Lab Chip 2009, 9, 3557–3566. [Google Scholar] [CrossRef] [PubMed]
- Schudel, B.R.; Harmon, B.; Abhyankar, V.V.; Pruitt, B.W.; Negrete, O.A.; Singh, A.K. Microfluidic platforms for RNA interference screening of virus-host interactions. Lab Chip 2013, 13, 811–817. [Google Scholar] [CrossRef] [PubMed]
- Oh, E.H.; Lee, S.H.; Lee, S.H.; Ko, H.J.; Park, T.H. Cell-based high-throughput odorant screening system through visualization on a microwell array. Biosens. Bioelectron. 2014, 53, 18–25. [Google Scholar] [CrossRef] [PubMed]
- Mishina, Y.M.; Wilson, C.J.; Bruett, L.; Smith, J.J.; Stoop-Myer, C.; Jong, S.; Amaral, L.P.; Pedersen, R.; Lyman, S.K.; Myer, V.E.; et al. Multiplex GPCR assay in reverse transfection cell microarrays. J. Biomol. Screen. 2004, 9, 196–207. [Google Scholar] [CrossRef] [PubMed]
- Roelse, M.; de Ruijter, N.C.; Vrouwe, E.X.; Jongsma, M.A. A generic microfluidic biosensor of G protein-coupled receptor activation-monitoring cytoplasmic [Ca(2+)] changes in human HEK293 cells. Biosens. Bioelectron. 2013, 47, 436–444. [Google Scholar] [CrossRef] [PubMed]
- Henquet, M.G.; Roelse, M.; de Vos, R.C.; Schipper, A.; Polder, G.; de Ruijter, N.C.; Hall, R.D.; Jongsma, M.A. Metabolomics meets functional assays: Coupling LC-MS and microfluidic cell-based receptor-ligand analyses. Metabol. Off. J. Metabol. Soc. 2016, 12, 115. [Google Scholar] [CrossRef] [PubMed]
- Meyerhof, W.; Batram, C.; Kuhn, C.; Brockhoff, A.; Chudoba, E.; Bufe, B.; Appendino, G.; Behrens, M. The molecular receptive ranges of human TAS2R bitter taste receptors. Chem. Sens. 2010, 35, 157–170. [Google Scholar] [CrossRef] [PubMed]
- Meshki, J.; Douglas, S.D.; Lai, J.P.; Schwartz, L.; Kilpatrick, L.E.; Tuluc, F. Neurokinin 1 receptor mediates membrane blebbing in HEK293 cells through a Rho/Rho-associated coiled-coil kinase-dependent mechanism. J. Biol. Chem. 2009, 284, 9280–9289. [Google Scholar] [CrossRef] [PubMed]
- Maggi, C.A. The mammalian tachykinin receptors. Gen. Pharmacol. 1995, 26, 911–944. [Google Scholar] [CrossRef]
- Palmer, A.E.; Qin, Y.; Park, J.G.; McCombs, J.E. Design and application of genetically encoded biosensors. Trends Biotechnol. 2011, 29, 144–152. [Google Scholar] [CrossRef] [PubMed]
- Nagai, T.; Yamada, S.; Tominaga, T.; Ichikawa, M.; Miyawaki, A. Expanded dynamic range of fluorescent indicators for Ca(2+) by circularly permuted yellow fluorescent proteins. Proc. Natl. Acad. Sci. USA 2004, 101, 10554–10559. [Google Scholar] [CrossRef] [PubMed]
- Miyawaki, A.; Llopis, J.; Heim, R.; McCaffery, J.M.; Adams, J.A.; Ikura, M.; Tsien, R.Y. Fluorescent indicators for Ca2+ based on green fluorescent proteins and calmodulin. Nature 1997, 388, 882–887. [Google Scholar] [CrossRef] [PubMed]
- Ueda, T.; Ugawa, S.; Yamamura, H.; Imaizumi, Y.; Shimada, S. Functional interaction between T2R taste receptors and G-protein alpha subunits expressed in taste receptor cells. J. Neurosci. Off. J. Soc. Neurosci. 2003, 23, 7376–7380. [Google Scholar]
- Kamentsky, L.; Jones, T.R.; Fraser, A.; Bray, M.A.; Logan, D.J.; Madden, K.L.; Ljosa, V.; Rueden, C.; Eliceiri, K.W.; Carpenter, A.E. Improved structure, function and compatibility for CellProfiler: Modular high-throughput image analysis software. Bioinformatics 2011, 27, 1179–1180. [Google Scholar] [CrossRef] [PubMed]
- Haghparast, S.M.; Kihara, T.; Miyake, J. Distinct mechanical behavior of HEK293 cells in adherent and suspended states. PeerJ 2015, 3, e1131. [Google Scholar] [CrossRef] [PubMed]
- Erb, L.; Weisman, G.A. Coupling of P2Y receptors to G proteins and other signaling pathways. Wiley Interdiscip. Rev. Membr. Transp. Signal. 2012, 1, 789–803. [Google Scholar] [CrossRef] [PubMed]
- Zabner, J.; Fasbender, A.J.; Moninger, T.; Poellinger, K.A.; Welsh, M.J. Cellular and molecular barriers to gene transfer by a cationic lipid. J. Biol. Chem. 1995, 270, 18997–19007. [Google Scholar] [CrossRef] [PubMed]
- Krek, W.; DeCaprio, J.A. Cell synchronization. Methods Enzymol. 1995, 254, 114–124. [Google Scholar] [PubMed]
- Kauffman, M.G.; Noga, S.J.; Kelly, T.J.; Donnenberg, A.D. Isolation of cell cycle fractions by counterflow centrifugal elutriation. Anal. Biochem. 1990, 191, 41–46. [Google Scholar] [CrossRef]
- Ross, G.F.; Bruno, M.D.; Uyeda, M.; Suzuki, K.; Nagao, K.; Whitsett, J.A.; Korfhagen, T.R. Enhanced reporter gene expression in cells transfected in the presence of DMI-2, an acid nuclease inhibitor. Gene Ther. 1998, 5, 1244–1250. [Google Scholar] [CrossRef] [PubMed]
- Moriguchi, R.; Kogure, K.; Iwasa, A.; Akita, H.; Harashima, H. Non-linear pharmacodynamics in a non-viral gene delivery system: Positive non-linear relationship between dose and transfection efficiency. J. Controll. Release Off. J. Controll. Release Soc. 2006, 110, 605–609. [Google Scholar] [CrossRef] [PubMed]
- Grady, E.F.; Garland, A.M.; Gamp, P.D.; Lovett, M.; Payan, D.G.; Bunnett, N.W. Delineation of the endocytic pathway of substance P and its seven-transmembrane domain NK1 receptor. Mol. Biol. Cell 1995, 6, 509–524. [Google Scholar] [CrossRef] [PubMed]
- Bennett, V.J.; Simmons, M.A. Analysis of fluorescently labeled substance P analogs: Binding, imaging and receptor activation. BMC Chem. Biol. 2001, 1, 1. [Google Scholar] [CrossRef]
- Varrault, A.; Journot, L.; Audigier, Y.; Bockaert, J. Transfection of human 5-hydroxytryptamine1A receptors in NIH-3T3 fibroblasts: Effects of increasing receptor density on the coupling of 5-hydroxytryptamine1A receptors to adenylyl cyclase. Mol. Pharmacol. 1992, 41, 999–1007. [Google Scholar] [PubMed]


© 2018 by the authors. Licensee MDPI, Basel, Switzerland. This article is an open access article distributed under the terms and conditions of the Creative Commons Attribution (CC BY) license (http://creativecommons.org/licenses/by/4.0/).
Share and Cite
Roelse, M.; Henquet, M.G.L.; Verhoeven, H.A.; De Ruijter, N.C.A.; Wehrens, R.; Van Lenthe, M.S.; Witkamp, R.F.; Hall, R.D.; Jongsma, M.A. Calcium Imaging of GPCR Activation Using Arrays of Reverse Transfected HEK293 Cells in a Microfluidic System. Sensors 2018, 18, 602. https://doi.org/10.3390/s18020602
Roelse M, Henquet MGL, Verhoeven HA, De Ruijter NCA, Wehrens R, Van Lenthe MS, Witkamp RF, Hall RD, Jongsma MA. Calcium Imaging of GPCR Activation Using Arrays of Reverse Transfected HEK293 Cells in a Microfluidic System. Sensors. 2018; 18(2):602. https://doi.org/10.3390/s18020602
Chicago/Turabian StyleRoelse, Margriet, Maurice G.L. Henquet, Harrie A. Verhoeven, Norbert C.A. De Ruijter, Ron Wehrens, Marco S. Van Lenthe, Renger F. Witkamp, Robert D. Hall, and Maarten A. Jongsma. 2018. "Calcium Imaging of GPCR Activation Using Arrays of Reverse Transfected HEK293 Cells in a Microfluidic System" Sensors 18, no. 2: 602. https://doi.org/10.3390/s18020602