

Abstract
Large scale land acquisitions (LSLA), and Reducing Emissions from Deforestation and forest Degradation (REDD+) are both land based phenomena which when occurring in the same area, can compete with each other for land. A quantitative analysis of country characteristics revealed that land available for agriculture, accessibility, and political stability are key explanatory factors for a country being targeted for LSLA. Surprisingly LSLA occur in countries with lower accessibility. Countries with good land availability, poor accessibility and political stability may become future targets if they do not already have LSLA. Countries which high levels of agriculture-driven deforestation and LSLA, should develop interventions which reduce forest loss driven either directly or indirectly by LSLA as part of their REDD+ strategies. Both host country and investor-side policies have been identified which could be used more widely to reduce conflicts between LSLA and REDD+. Findings from this research highlight the need for and can inform the development of national and international policies on land acquisitions including green acquisitions such as REDD+. Land management must be considered with all its objectives—including food security, biodiversity conservation, and climate change mitigation—in a coherent strategy which engages relevant stakeholders. This is not currently occurring and might be a key ingredient to achieve the targets under the Sustainable Development Goals 2 and 15 and 16 (related to food security and sustainable agriculture and the protection of forests) among others.
Export citation and abstract BibTeX RIS

Original content from this work may be used under the terms of the Creative Commons Attribution 3.0 licence.
Any further distribution of this work must maintain attribution to the author(s) and the title of the work, journal citation and DOI.
1. Introduction
Land use and land use changes are influenced by global processes including two, which have received recent attention: Large Scale Land Acquisitions (LSLA) and Reducing Emissions from Deforestation and forest Degradation (REDD+). LSLA can be defined as large-scale (≥200 ha) land investments which result in the transfer of rights, control or ownership of land (Nolte et al 2016), although there is ongoing discussion about the definition of LSLA (Edelman et al 2013). LSLA can provide benefits to local communities (Smalley et al 2014, Deininger and Byerlee 2011) and income to host governments who in some cases actively seek investments (Friis and Reenberg 2010). However, there is a general consensus that LSLA occurring in low-income countries results in negative impacts on food and tenure security, and the livelihoods of local communities (Cotula 2012). REDD+ is a mechanism designed to reduce global greenhouse gasses (GHGs) in the atmosphere, while promoting forest conservation, sustainable management of forests and enhancing carbon stocks (UNFCCC 2014). REDD+ features prominently in the Paris Climate Agreement (UNFCCC 2015) due to the impact of land use change on GHG emissions, with forest loss being major source of GHG emissions in tropical countries (Houghton et al 2012).
Being a globally limited resource (Foley et al 2011, Seppelt et al 2014) competition for land for different land uses occurs and thus links LSLA and REDD+. LSLA has also been identified as a driver of forest loss potentially causing conflicts with REDD+ efforts (Scholes 2012). Yet, most research on LSLA has focussed on the social and political aspects of the phenomena (e.g. De Schutter 2011, Messerli et al 2013, Scoones et al 2013a, Borras et al 2012, Edelman 2013, Edelman et al 2013), and the impacts on forests and on forest protection efforts including REDD+ have not been widely researched to the authors' knowledge.
Most LSLA deals (80%) are for agriculture (Nolte et al 2016), with agricultural LSLA being the focus of much research (e.g. De Schutter 2011, Cotula et al 2011, Mbow 2010). There is an existing body of research on the factors related to agricultural LSLA, with underlying or ultimate drivers on the global scale being world population increases, dietary changes, financial crises (which promote land as an alternative investment source), and public policies such as European Union biofuel consumption targets and food price increases among others (Friis and Reenberg 2010, Cotula et al 2009, Messerli et al 2013, Edelman et al 2013, Cotula 2012). Research also exists on the characteristics of areas or countries which are hosts of LSLA and the factors making them attractive to investors. Expanding economic relations between host and investor countries (or economic liberalization of host countries) and support to the private sector through informational, technical and bureaucratic assistance are cited as important. There is no analysis yet however, which identifies the drivers of LSLA for agriculture in a statistically robust and consistent way. This study aims to fill this gap, by providing a comprehensive analysis of country characteristics which may be favourable for LSLA. We use the results to link LSLA with REDD+.
REDD+ has been compared to LSLA and has been labelled one type of 'green grabbing' (Fairhead et al 2012). LSLA and REDD+ can have similar impacts on land tenure, biodiversity and sustainable development (Fairhead et al 2012, Larson et al 2013), but REDD+ has been developed with the aim of avoiding some of the negative effects which are typically linked with land acquisitions (Larson et al 2013), partially through the Cancun safeguards (UNFCCC 2010).
Understanding where LSLA occur is the first objective of this study, and a hypothesis about the predisposing factors characterizing countries which experience LSLA was tested using a data-driven approach. The aims of the study are thus (i) determining the predisposing factors which characterize countries which are objects of LSLA, (ii) identifying countries where forest loss may be driven by LSLA and (iii) exploring the potential to reduce forest loss and conflicts between REDD+ and LSLA.
2. Conceptual framework characterizing countries which are objects of LSLA
A deductive approach based on a literature review was used to build the hypothesis that countries that are objects of LSLA will have the following four characteristics:
Potential for returns from investments: LSLA is hypothesized to be more frequent in countries which have land with high potential agricultural productivity and can produce returns on investments of agricultural inputs. Agricultural LSLA are likely to occur in areas with favourable conditions for agriculture which has been demonstrated by growing pressure on the best lands such as those with good soil fertility or irrigation potential (Cotula 2012, Breu et al 2016). Land value may also influence buyers, with higher valued land (probably due to their favourable conditions for agriculture) attracting investors, although cheap lands where returns can be generated also attract investors (Cotula et al 2009, Cotula 2012). The increase in availability of fertilizers has been cited as a driver of agricultural LSLA (Cotula et al 2009), since higher yields will result from the investment in fertilizer.
Suitable land: It is assumed that investors focus on countries with large areas of land suitable for agriculture. A wide range of land cover and uses are appropriate for investments, including existing agricultural land (Deininger and Byerlee 2011, De Schutter 2011, Cotula et al 2011); both commercial (Cotula 2012) and smallholder (Anseeuw et al 2012, Fairhead et al 2012, Edelman et al 2013, Cotula 2012), and forests (Scholes 2012). Since it is also suggested that most land suitable for LSLA for agriculture is under use or claim already (Cotula et al 2009) this implies that frontier areas will be sought in future. There is also evidence that marginal lands play a role for new agricultural developments, but that the potential is not fully realized (Nalepa and Bauer 2012). Proximity to markets is cited as important for investors (Cotula 2012).
Access for investors: It is hypothesized that LSLA are more likely to occur in countries where investors can acquire and develop the land more easily. The legal regimes and national traditions for trade, investment and property (specifically laws and policies applying to land purchasing) will impact the likelihood of LSLA occurring (Edelman et al 2013). Host country governments make policy reforms specifically to improve the investment climate, including tax breaks to encourage investors, and reforming land regulations (Cotula 2012, Cotula et al 2009, Deininger and Byerlee 2011). In contrast to supporting policies, weak tenure regulations also equate to increased acquisitions (Cotula 2012, Corbera et al 2011). Other governments restrict investments, for example in the forestry and agricultural sectors, several countries do not allow 100% foreign ownership (including Philippines, Mexico and Thailand which allow a 50% share, and Armenia, India, Indonesia and Sudan which allow a 50%–80% foreign involvement) (World Bank 2014). Some countries have regulations related to specific crops, for example in Sierra Leone 5% to 20% of the shares of biofuel investments must be held by Sierra Leoneans (Cotula et al 2009).
Security of investments: Investors are assumed to develop LSLA in areas where there are low risks to loss of investments through for example conflicts. Political instability is considered a risk for investors in LSLA (Cotula et al 2009). There also needs to be a minimum regulatory requirement for investments to take place which will ensure respect for private property. The regulatory environment determines how control of resources and stakeholders allows the investor to acquire the land and use it for the desired purpose. This aspect of LSLA is referred to as 'control grabbing' (Borras et al 2012, Messerli et al 2013). Additionally economic sanctions in the form of trade embargos are often imposed on countries engaged in conflicts, which although are mainly focussed on goods related to conflicts (EC 2016) can affect agricultural activities, making investments insecure. A number of countries included in this study currently have these restrictive measures related to trade (EC 2016).
3. Data and methodology
3.1. Data on LSLA: the land matrix
Occurrences of LSLA were determined using the Land Matrix, which was designed to introduce transparency and inclusion in decision making in the land acquisition sector (Anseeuw et al 2012, Nolte et al 2016). A binary response variable (whether a country is an object of LSLA or not) was used. LSLA were therefore defined according to the definition of the Land Matrix, however only international investments for agricultural purposes (including biofuels and fibre) were included with domestic land acquisitions being excluded. Only 'concluded' or 'contract signed' deals were included. The countries included in the study were restricted to the scope of the Land Matrix, which is lower-middle income countries. In this study the World Bank (World Bank 2013) list of low to middle income countries was used to identify those countries which had no LSLA. Some inconsistencies appeared in the current list of lower-middle income countries, and those which appeared in the Land Matrix. So countries which appeared in the Land Matrix, but were middle income countries in 2010 (i.e. recently promoted to the high income category according to the World Bank definition) were included (Uruguay, Russia, Lithuania, Chile), leading to a population of 142 countries. This study therefore includes some non-annex 1 countries which were excluded for the analysis related to REDD+ and LSLA to avoid misinterpretation of results given the fact that non-annex 1 countries are not eligible for REDD+.
The Land Matrix includes land deals reported by media, official data and research outputs, so methods may be affected and results biased by the intention to produce data for advocacy purposes (Edelman et al 2013, Scoones et al 2013a). Other potential biases in the Land Matrix are that countries under autocratic rule tend to provide less information and conflict-ridden areas may receive more press attention. Biases in datasets can be dealt with statistically, however validation information on LSLA is required which is not available. Utilizing a binary response variable for LSLA occurrences largely overcomes these biases, since it is unlikely that a country with LSLA would have all LSLA occurrences from the Land Matrix database missing, and if some but not all of the occurrences were missing, the binary response would be correct. Although there is a debate as to the quality of the Land Matrix data, there is also an agreement that these data are valuable for developing the agenda on the topic (Scoones et al 2013b, Rulli and Odorico 2013). Indeed, several examples exist where the Land Matrix and other similar data have been successfully used to assess LSLA in a number of contexts (Deininger and Byerlee 2011, Rulli et al 2012, Anseeuw et al 2012, Giovannetti and Ticci 2016, Breu et al 2016).
3.2. Characterizing countries which are objects of LSLA: indicators
Indicators were identified (table 1) for each of the four components of the hypothesis regarding the characteristics of countries which are objects of LSLA (section 2). Data sources for which 33% of countries had no data were omitted (average missing data was <10% for all variables).
Table 1. Variables used to identify characteristics of countries which explain whether or not they are objects of LSLA (as defined by the Land Matrix).
| Characteristic | Expected indicator for LSLA occurrence and explanation | Data source and description | Variable name |
|---|---|---|---|
| Potential for returns | Large yield gaps exist | Difference between actual yield and potential yield of major grains (t ha−1) (Neumann et al 2010), weighted based on the area under production (Monfreda et al 2008) | Yield gap |
| Agriculture is a successful sector, and contributes to the countries' GDP (high share) | % of GDP (gross domestic product) from agriculture (c. year 2013 or most recent) (World Bank 2013) | Agricultural GDP | |
| Appropriation of net primary productivity (NPP) by humans is demonstrated (high value) | Total quantity of NPP appropriated by humans as vegetables, paper, wood (including construction and fuel use), meat, soft fibre, eggs and milk (Imhoff and Bounoua 2006, Imhoff et al 2004) (Pg C) | HANPP | |
| Suitable land | Area of land available for agricultural use, which is not protected is large (high percentage) | Multiple data sources (table 2) (% of country land area) | Available land |
| Accessibility to markets is high (lower travel time; low value) | Accessibility, average travel time to city (minutes) (Uchida and Nelson 2008) | Accessibility | |
| Access for investors | Favourable conditions for business (high score on business index) | Ease of doing business (World Bank 2013), ordinal data | East of doing business |
| Regulatory quality (high value) | World Bank governance indicators (World Bank 2012), ordinal data | Regulatory quality | |
| Security of investment | Control of corruption is good (high value) | Control of corruption (World Bank 2012), ordinal data | Corruption |
| Country is peaceful (high value) | Global peace index (Institute for Economics and Peace 2015), ordinal data | Peace | |
| Country is stable (low value) | Fragile states index (Fund For Peace 2015), ordinal data | Fragile |
For the accessibility variable, we use the gridded data set provided by the EU joint research centre (JRC) to estimate the average travel time to major cities (>50 000 inhabitants) per country (Uchida and Nelson 2008). Here accessibility is the travel time to a given location of interest using available transport networks. Transport networks include land based transport; on and off roads and rail networks, and water networks; via navigable rivers and shipping lanes in lakes and oceans. Transport type, potential speeds on different road types, and environmental factors such as land cover and slope are used to calculate the travel speed of the transport network. National boundaries and border crossings are considered, as they can lead to travel delays (Uchida and Nelson 2008). Thus we characterize each country by the average travel time to major cities. As cities are defined by population, they represent potential markets.
Area of land available for agricultural use was calculated as a proportion of the country land area (Carter et al 2015) (table 2). Urban areas, as well as bare areas, water bodies, permanent snow and ice, and areas dominated by lichens and mosses, which are likely to have a low biophysical potential for agriculture were excluded. Land with steep slopes, and land with a low potential for agricultural productivity was also excluded, and forests were left in. Information about the selection of these indicators can be found in Carter et al (2015). Protected areas were excluded since these are typically considered to be unavailable for agriculture (Lambin et al 2013). Protected areas can reduce deforestation (and therefore may be off-limits for LSLA), however Soares et al (2010) show that deforestation rates within and outside protected areas may in specific cases not differ. Additionally, in Myanmar, forest reserves have been de-gazetted in order to allow for LSLA (Woods 2015). Another study investigating land for cropland expansion did not consider International Union for Conservation of Nature (IUCN) protected areas categories V and VI (Protected Landscape/ Seascape and Protected area with sustainable use of natural resources) a limit for agricultural expansion as cropland can exist in these areas (Eitelberg et al 2015). However since details on IUCN categories in the World Database of Protected Areas are incomplete (IUCN UNEP-WCMC 2014) all IUCN protected areas were excluded. The inclusion of protected areas therefore in this case gives an indication of barriers for LSLA, but LSLA can also occur where it is not permitted according to an area's protected area status.
Table 2. Land available for LSLA—data sources and availability conditions.
| Availability factor | Availability condition | Data source and description |
|---|---|---|
| Land use/cover | Land is not bare, urban, water, permanent snow and ice or currently lichen or mosses | 300 m resolution land cover map based on a global surface reflectance (SR) composite time series, 2010 (ESA 2013) |
| Yield potential for rainfed agriculture | Potential crop productivity >3.5 t ha−1 | 10 arc minute climate dataset combined with soil water storage map and a dynamic water and crop model (Droogers et al 2001) |
| Suitable topography for agriculture | Slopes <15% | 30 arc second aggregate based on 90 m resolution digital terrain map from the Shuttle Radar Topographic Mission (SRTM) (Fischer et al 2008) |
| Protected area status | Land does not have protected area status | Globally spatially referenced World Database of Protected Areas (WDPA) (IUCN UNEP-WCMC 2014) |
3.3. Characterizing countries which are objects of LSLA: classification trees
Classification trees were used to understand the relationship between the response variable (presence or absence of LSLA) and the explanatory variables (see tables 1 and 2). Classification trees have been used in a variety of situations, and when tested against other comparable methods (clustering or regressions for example) provided useful results (Moreno-Fernández et al 2015, Shekoofa et al 2014). In our case, a number of the explanatory variables are highly correlated and show strong non-linear relationships (as would be expected with socio-economic measures at the country level), and have missing data. Classification trees are able to handle such data characteristics. Classification and Regression Trees (C&RT), involve recursive partitioning to complete a binary tree of homogenous subsets through reducing the impurity in each step. C&RT uses the Gini impurity to select variables. Trees were pruned by cross-validation to avoid overfitting, the minimum number of cases for each node (parent or child) was set to 5, and trees were produced with SPSS 22 (IBM 2013).
3.4. The impact of LSLA on REDD+ and forests
In order to assess the potential for forest loss due to LSLA, two assumptions were considered. Firstly, where agriculture driven deforestation is already high, there is existing demand for farmland so it is likely that any further acquisitions would exacerbate the need for farmland. Secondly, countries which are already objects of LSLA or which have characteristics which are particularly attractive to LSLA investors (findings of the classification tree) can potentially have LSLA driven forest loss. Where both REDD+ and LSLA appear in the same country, potential conflicts occur, so possible mechanisms to avoid this are discussed. Assessments of REDD+ drivers and interventions were made, to establish if LSLA was considered a threat to forests and if interventions were in place to address this threat.
Data on agriculture-driven deforestation were obtained from Carter et al (2015) who combined data on deforestation for the period 2000–2010 with data on the proportion of deforested land which is converted to agriculture. Percent loss of forest area was reported, and countries were divided by tertiles into 3 groups of 41; low, medium, and high agriculture-driven deforestation (19 had no data on agriculture-driven deforestation).
In line with Carter et al (2015), engagement in REDD+ was determined by including engagement in international REDD+ initiatives such as UN-REDD, World Bank Forest Carbon Partnership Facility as well as REDD+ project development and funding acquisition. Countries were classed as being engaged in REDD+ if any of these occurred.
A review of REDD+ documents was carried out to identify if LSLA-related drivers specifically are considered a threat to forests according to national REDD+ preparation documents. For this study, the most recent REDD+ Readiness Preparation Proposals (R-PPs) submitted to the World Bank Forest Carbon Partnership Facility (FCPF) (FCPF 2015) were reviewed to assess if LSLA was specifically considered a driver. Additionally, country reported information on the main drivers of deforestation (direct and indirect) as summarized by Kissinger et al (2012) were divided into those related to and not related to LSLA (supplementary table 2 available at stacks.iop.org/ERL/12/035010/mmedia).
Data from Salvini et al (2014) were used, to identify countries whose REDD+ interventions address LSLA. An analysis of available documents (including R-PPs) was carried out by Salvini et al (2014) who assessed whether proposed interventions which were designed to reduce deforestation were linked to the drivers which were also identified. Both Kissinger et al (2012) and Salvini et al (2014) use official documents which are available and on which REDD+ implementation is based.
4. Results
4.1. The characteristics of countries which are objects of LSLA
There were 142 countries in the analysis, 80 (56%) of which were objects of LSLA and 62 (44%) were not. The classification tree's main split was based on available land, showing this has the most discriminating role (p < 0.0001) in determining whether or not a country is likely to have LSLA. Countries with relatively small areas of land available (<18.9% of the country area) are more likely not to have LSLA. If available land area is above this threshold, then an accessibility indicator (mean travel time in the country >192 minutes to a large city or market), determines that countries are likely to have LSLA. For countries with a travel time below this threshold, then fragility is the determinant, and those more fragile (>72.8—described as a 'warning' or 'alert' by the Fragile states index (Fund For Peace 2015)) are likely not to have LSLA. The classification tree has an overall accuracy of 78.9%, an omission error (not identifying a LSLA country) of 13.8% and comission error (identifying a non-LSLA country as a LSLA country) of 30.6% for LSLA.
4.2. LSLA, forest loss and REDD+
Figure 2 (see also supplementary table 1) groups countries according to the level of agriculture-driven deforestation (percent forest loss, divided into tertiles) and the node in which they end up in the classification tree. Node 1, in which 22.2% of the countries have LSLA, includes mainly countries with low agriculture-driven deforestation, and node 2, where most countries (81.6% of all countries) have LSLA includes countries which are more likely to have high agriculture-driven deforestation.
REDD+ and LSLA can both occur in the same country (figure 2, table 3). Only countries that are eligible for REDD+ (non-annex 1 countries) and are within the scope of the Land Matrix (low and middle income countries) were analysed. Targets of LSLA were 12 times (95% confidence interval 5–32) more likely to be engaged in REDD+ than those who do not have LSLA (P-value of Fisher exact test of association between 132 targets of LSLA and REDD+ <0.001).
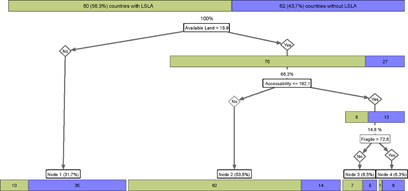
Figure 1 Classification tree characterizing countries which are and are not objects of LSLA. The percentage and number (n) of countries belonging to each node are shown, with the condition by which the split is made labelled above each node, and the name of the variable related to that condition is marked at each split.
Download figure:
Standard image High-resolution image
Figure 2 Agriculture-driven deforestation (percent forest loss 2000–2010 divided into tertiles) and classification of country with respect to likeliness of LSLA placement in the classification tree (figure 1) for (a) all countries in the study, which also colours those countries which do not report LSLA but show similar characteristics to those with LSLA. (b) only those countries are coloured (in accordance to the classification as described in a), for which LSLA is reported and which participate in REDD+. Nodes are defined in accordance to the results of the classification tree, 1: low available (avail.) land, 2: High available land and low access, 3: high available land, high access, low fragility (frag.), 4: high available land, high access and high fragility.
Download figure:
Standard image High-resolution image
Table 3. Instances of LSLA recorded in Land Matrix and engagement in REDD+.
| Number of countries |
LSLA | No-LSLA |
|---|---|---|
| REDD+ | 62 | 17 |
| No-REDD+ | 12 | 41 |
a10 countries included in the Land Matrix were not eligible for REDD+ (i.e. they were UNFCCC Annex 1 countries) so they were not included in this analysis.
Of the countries which are eligible for REDD+, countries in node 2 (around 80% of which have LSLA) are more likely to be engaged in REDD+ than those in the other nodes in the decision tree (which less have LSLA). Countries in node 2 with high agriculture-driven deforestation tend to be engaged in REDD+ (31 out of 34 countries, all of which are eligible for REDD+), and are spread across Africa, South and Central America and Asia.
In the 30 countries for which REDD+ documents were assessed, agriculture expansion was noted as a major driver of deforestation, with commercial monocultures typical of LSLA being cited as major causes in many countries (supplementary table 2). In a number of countries, agricultural LSLA are occurring but the country does not cite commercial agricultural expansion as a driver (Democratic Republic of the Congo, Kenya, Republic of Congo, Zambia) (Kissinger et al 2012). In these cases it could be that LSLA occur in non-forested land, or more likely that the driver is not recognized. In some countries, LSLA was specifically identified as a direct driver of deforestation (Burkina Faso, Cambodia, Central African Republic, Guatemala) (Kissinger et al 2012). Indirect drivers also pointed towards LSLA being a threat, with weak governance, poor enforcement of laws, and tenure being cited commonly as drivers (Kissinger et al 2012). Two of the countries in the study by Kissinger et al (2012) which did not have LSLA (El Salvador, Panama) cited agriculture expansion, and in particular commercial/mechanized agriculture as a main driver of deforestation. In these cases, it could be that domestic LSLA were occurring (which were excluded from the analysis). Of the 27 REDD+ countries investigated which have LSLA, only nine have interventions aiming to reduce deforestation which address the driver. For the four countries that specifically cite LSLA as a driver of deforestation (including Cambodia, Burkina Faso and Central African Republic), only Guatemala has planned interventions which specifically address this and other drivers identified there.
5. Discussion
5.1. The characteristics of countries which are objects of LSLA
The review of literature revealed four important requirements for LSLA: potential for returns, available land, access for investment and security of investment. The results from this analysis confirm several of these requirements. Available land was found to be the main determinant of whether a country will have LSLA. Countries with >19% land suitable for agriculture were more likely to have LSLA than countries with less than 19% available land (21 countries). These countries with less than 19% available land included those covered by large arid areas which is not suitable for agriculture (for example those with land area within the Sahara desert: Algeria, Eritrea, Egypt, Libya, Niger). For countries with large areas of available land, access to land is also relevant to whether or not they have LSLA. Literature on LSLA suggests that areas with access to markets are more favourable for LSLA, and this may be the case for individual instances of LSLA. Our study found that countries with low access are more likely to have LSLA, which is likely to be partly because our research focuses on deals, which are often large (on average >330 km2 (The Land Matrix Global Observatory 2013)), and it is likely that large tracts of land cannot be found in countries which have more urban areas for example (where access is high). Countries which have a large areas of suitable land but access of <192 minutes travel time to markets on average in the country, are not interesting to investors if countries fragility is high. This confirms the hypothesis that security of investments is likely to be a consideration for investors. Indicators which identified the 'access for investors' criteria (favourable conditions for business, and regulatory quality), were not found to be related to LSLA according to this methodology. However, an indicator not being recognized in the decision tree does not confirm the absence of a link with LSLA. Other indicators for this criteria 'access for investors' could be tested to confirm the hypothesis posed in this study.
Countries which exhibit the characteristics which are attractive to investors: land availability, poor accessibility and political stability may be future targets if they do not already have of LSLA (for example Belize, Ecuador, Nepal and Togo).
There are other characteristics which literature suggested would be linked with LSLA but which were excluded from the analysis because they were not relevant for investors, or data were not available or suitable. For example land prices were found to influence LSLA, with cheap land being preferred by investors as there is potential for capital accumulation, which can mitigate risks in agricultural production (Cotula 2012). However, there is a lack of data on land prices thus it was not included in the analysis. Populated areas can also be attractive to LSLA investors (Messerli et al 2013), however population density was not included since it is likely to vary widely across countries, with the national average not describing situation for local LSLA investments well (Eckert et al 2016). Despite these limitations, the deductive approach used to identify factors which attracted investors, allowed the identification of key characteristics of countries which were objects of LSLA. More research carried out at different scales, would allow the identification of more characteristics linked to LSLA (Eckert et al 2016).
5.2. Impact of LSLA on forests
This study did not include domestic LSLA, since the aim of the C&RT analysis was to investigate what characteristics attract foreign LSLA investors to countries. However, domestic LSLA can still threaten forests, so Bangladesh, Niger and Thailand which have only domestic deals should be considered when analysing the impact of LSLA on forests (see supplementary table 1).
Countries with LSLA or that have characteristics found in countries with LSLA, often have high agriculture-driven deforestation (figure 2). Although this study cannot confirm a causal relationship (neither direct nor indirect) between LSLA and deforestation, LSLA are often very large, and have been reported to occur in forested areas, and therefore can impact forest cover. According to the Land Matrix, the average size of concluded transnational deals (for any intention) is 364 km2, which is more than the area of annual deforestation in 83 of 125 countries included in this study for which data were available (17 had no data). Many countries also have multiple deals, and considering that the largest agriculture-related reported deal is 14 000 km2 (Republic of Congo), there is potential for large areas of forest loss if forested areas are targeted. On average there are 15 concluded deals in each country, and the countries with the largest number of LSLA are Indonesia (125), Cambodia (104) and Mozambique (79). In these countries increased attention to forest loss associated with LSLA would be beneficial, as a larger area of LSLA may result in a larger chance of forests being targeted. The relative size of forest compared to agricultural land is also likely to be important for estimating impacts of LSLA on forests, for example Democratic Republic of the Congo has vast forest areas, and the total area of land deals in this country (according to the Land Matrix database) account for an area of only 1% of the total forest area. In contrast, in Cambodia, land deals account for an area equivalent of 16% forest area, 28% agricultural area, or 41% of its arable land area (NGOs estimate a higher proportion: between 56 and 63% of the arable land area (Edelman 2013)). Even if non-forested land in Cambodia is targeted for LSLA, deforestation could occur indirectly where existing activities on the land are displaced into forests.
In some cases LSLA are 'virtual' acquisitions as the conversion to another land use is postponed for long periods, is partially realized, fails to materialize (McCarthy et al 2012), or acquisitions are speculative and so they involve small and temporary investments (Messerli et al 2013). These virtual acquisitions may have less of an impact to forests than when conversion to agriculture occurs. However, even if the land is not converted for its intended use, degradation may occur as experienced in Indonesia, where licences and subsidies are given for establishing plantations, but companies instead clear the forest, sell the timber and abandon the land (Romijn et al 2013). In this case, if land is not subsequently converted to agriculture, it is possible that regrowth of the forest will occur.
5.3. Potential to reduce the impact of LSLA on forests
To avoid loss of forests from LSLA, the link between the two needs to be understood. Salvini et al (2014) describe a logical chain for developing interventions to address drivers of deforestation. For interventions to be effective, an understanding of specific drivers should be made and following this, interventions can be designed to address these drivers. REDD+ interventions should then be redesigned following an assessment (monitoring) of the success of the intervention. In in many cases, this link between drivers and interventions is not made in REDD+ plans (supplementary table 2). For the countries in which agricultural LSLA are occurring, but in which commercial agricultural expansion is not cited as a driver (Democratic Republic of the Congo, Kenya, Republic of Congo, Zambia) more work can be invested in determining if LSLA is driving deforestation (the first step in the logical chain). The second step is designing the interventions to match the drivers. In the cases of Indonesia, Cambodia and Mozambique (the countries with the highest number of LSLAs according to the Land Matrix), the impacts of commercial agriculture on forests are recognized in the REDD+ documentation, however only in Mozambique were the interventions found to match the drivers of deforestation (supplementary table 2). For countries which do not recognize commercial agriculture as a driver of deforestation but that identify LSLA as a driver, indirect drivers such as lack of planning and consultation, and lack of secure land tenure are cited. Based on this knowledge, countries can develop interventions which address these indirect drivers, however, developing interventions directly targeting LSLA is recommended to reduce the impact of LSLA on forests.
The fact that some countries do not identify drivers, or do not propose interventions which address these drivers is particularly interesting. Of the 27 countries which were assessed (supplementary table 2), all had already produced the R-PP s which forms the basis of their strategy in the FCPF (excluding Zambia which is participating in UN-REDD), so are relatively advanced in terms of REDD+ implementation.
In general, investments in agricultural land (such as through LSLA) are thought to lead to increased returns which incentivise expansion (Angelsen 2008, Deininger and Byerlee 2011, Pirard and Belna 2012). Two potential mechanisms exist through which agricultural investments can occur without impacting forests. Firstly, existing agricultural land can be acquired and production maintained or increased to avoid the displacement of agricultural activities to other areas (Valin et al 2013, Ausubel et al 2013). The Land sparing concept (or segregation) suggests that increasing the output on agricultural land reduces the need to increase agricultural areas (Kastner et al 2012, Stevenson et al 2013). Specifically, technology-induced intensification is supposed to be land saving at the global level (Byerlee et al 2014) but could potentially have negative effects on productivity (Seppelt et al 2016). Secondly, available or degraded land can be used for LSLA, again avoiding the need to acquire forested areas (Carter et al 2015). Global maps of unused or low carbon land have been produced (Dinerstein et al 2014), but national or regional maps are needed to suggest hot spots and cold spots of LSLA and deforestation coincidence. However there is some debate on whether there is land unused, or idle (which is non-forested), and also whether current maps are useful for identifying it, as discussed by Nalepa and Bauer (2012) on the use of remote sensing tools to identify marginal land. There are several examples of initiatives which aim to restore degraded land, for example 'Initiative 20x20' which aims to restore 20 million hectares of degraded land in Latin America and the Caribbean by 2020 (World Resources Institute 2016). However, these initiatives themselves need to be implemented with care, as they could be classed as 'green grabbing' and may involve elements found in LSLA; large areas, and a change in land rights being obvious ones.
5.4. Planning for LSLA and REDD+
Since there are a number of countries which have both REDD+ and LSLA, there is an opportunity for lessons learned in REDD+ to be transferred into the policies relating to LSLA. In the case of Liberia, the R-PP aims to avoid REDD+ becoming a LSLA. Much research is focussed on the impacts of LSLA on smallholders, which mainly stem from loss of land (Anseeuw et al 2012, Cotula 2012, Fairhead et al 2012, Edelman et al 2013, Oberlack et al 2016). Community participation is one key approach to mitigate this (Oberlack et al 2016). The Cancun 'guidance and safeguards for policy approaches and positive incentives related to REDD+' (UNFCCC 2010) include several actions mostly relating to rights of local communities and other stakeholders, which could be modified for the context of LSLA and directly integrated into national regulations. Consultations for REDD+ require the engagement of relevant stakeholders, and an iterative consultation process that includes a complaint management process; a structure which would also be suited to the LSLA context. This has in some cases led to better tenure security (Larson et al 2013), which could also be beneficial for investors in LSLA. Similar recommendations can also be found for instance in Cotula et al (2009).
In practice, that there is a potential for interventions in the supply chains of agricultural products (for example those produced in LSLA) which aim to reduce deforestation, to be implemented alongside REDD+ to produce low emissions rural development (Nepstad et al 2013). Green public procurement policies (for example the Roundtable for Sustainable Palm Oil (RSPO 2016) and Round table on Responsible Soy (RTRS 2016)) could also make agricultural production more sustainable and aligned to climate change objectives. Zero-deforestation is commonly understood as commitments from the private sector to eliminate deforestation from their supply chain (Meyer and Miller 2015), and when applied to LSLA can avoid forest loss. Since investors of LSLA in this study are international and due to the scale of investments, it is likely that some are exporting products. Concern from countries and consumers in importing countries about environmental issues could lead to uptake of green procurement policies in LSLA.
One barrier to success is policy coherence which is typically difficult to achieve, and conflicting policies (for example those favouring LSLS and those favouring REDD+) can hinder sustainable land use (Minang et al 2015).
LSLA and REDD+ show two distinct patterns with respect to the governance of the global land system. While the first is driven by tele-connected global agricultural markets, the latter is a legal framework introduced to mitigate climate change. This study demonstrates how these processes co-occur in different countries where competition for land can potentially lead to conflicts. As such, LSLA should be specifically discussed in platforms where interventions to reduce deforestation are being planned. Our analysis suggests that land management must be considered with all its objectives such as food security, biodiversity conservation, climate change mitigation in a coherent strategy which engages relevant stakeholders. This is not currently occurring and might be a key ingredient for the implementation of activities to achieve the targets under the Sustainable Development Goals 2, 15 and 16 (related to food security and sustainable agriculture and the protection of forests) among others.
Acknowledgments
We acknowledge funding from the Germany Federal Ministry of Education and Research (GLUES, 01LL0901A, R.S.), and the International Climate Initiative (IKI) of the German Federal Ministry for the Environment, Nature Conservation, Building and Nuclear Safety (BMUB), NORAD (Grant Agreement # QZA-016/0110 nr 1500551), and AusAID (Grant Agreement # 63560) within CIFOR's Global Comparative Study on REDD+. This research contributes to the Global Land Project (www.glp.earth) and was carried out as part of the CGIAR Research Program on Forests, Trees, and Agroforestry. We thank the reviewers for their helpful comments which strengthened the manuscript.